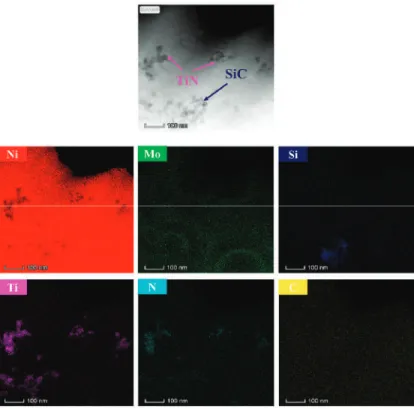
Figure 4 shows the EDS (energy dispersive spectrometer) elements mapping of the duplex nanoparticles reinforced Ni-Mo coating. Figure 6a shows the stress-strain curves of the aluminum foam and the aluminum foam subjected to electrodeposition for different times. The stress-strain curve also showed that the coating increases the energy absorption of the aluminum foam.
The quality of the coating on the surface increases the strength and rigidity of the aluminum foam. This limited improvement in compression properties is due to the small amount of nanoparticles in the Ni-Mo coatings. The corrosion resistance of the aluminum foam and the aluminum foams with an electrodeposited Ni-Mo coating and a duplex nanoparticle-reinforced Ni-Mo coating was detected.
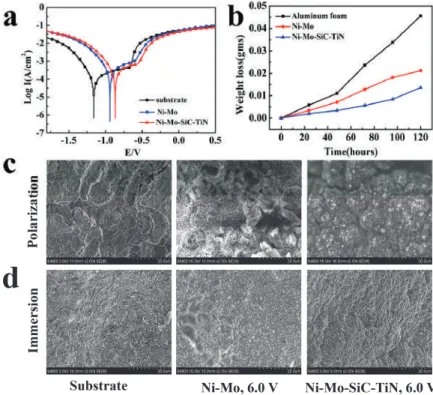
Polarization curves of the samples (a) and weight loss versus time curves after immersion test (b); SEM images of the substrate and coatings after polarization test (c) and immersion test (d). This difference illustrates that SiC and TiN nanoparticles can have an improvement in the corrosion resistance of Ni-Mo coating. Figure 7d shows the corrosion morphologies of aluminum foam, Ni-Mo coating, and double nanoparticle-reinforced Ni-Mo coating deposited at 6.0 V voltage after immersion test.
Almost no corrosion was observed on the surface of the duplex nanoparticle-reinforced Ni-Mo coating due to the protection of the nanoparticles.
Conclusions
Dispersed nanoparticles can increase the corrosion resistance of the coating, as the nanoparticles can prevent contact between the etching solution and the coatings. The aluminum foam was severely corroded and there were many corrosion products and corrosion pits on the aluminum foam. An EDS spectrum analysis was performed on the corrosion surface and it was found that the oxygen content in the corrosion product was 17.04 wt. %.
Compared to aluminum foam, the Ni-Mo coating provided better protection for the substrate. Local corrosion cracks can be observed and the oxygen content of the corrosion products decreased to 8.03 wt.%. The nanoparticles filled the voids in the matrix coating and improved the compactness of the coating.
Compared with the aluminum alloy matrix, the corrosion rates of the Ni-Mo coating and the duplex nanoparticle reinforced Ni-Mo coating were improved by 51.9% and 72.5%, respectively. The corrosion rate of aluminum foam covered with a Ni-Mo coating was reduced by 51.9%. The deformation rate affects the compressive property and energy absorbing capacity of aluminum alloy foam. Mater.
Effects of annealing temperature on microstructure, surface roughness, mechanical and tribological properties of Ni–P and Ni–P/SiC films.Surf. Improvement of the mechanical and thermal properties of open cell aluminum foams by electrodeposition of Cu.Mater. Advances in research on mechanical properties of closed cell aluminum foams and its applications in automotive collision.Chin.
This article is an open access article distributed under the terms and conditions of the Creative Commons Attribution (CC BY) license (http://creativecommons.org/licenses/by/4.0/).
Electrochemical Corrosion Behavior of Ni-Fe-Co-P Alloy Coating Containing Nano-CeO 2 Particles in
- Introduction
- Materials and Methods
- Results
- Conclusions
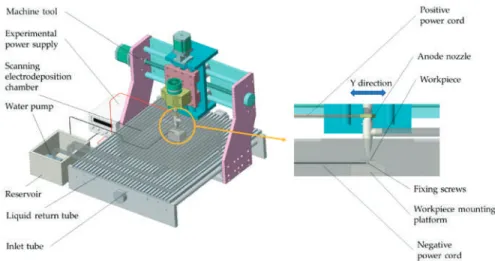
The height between the bottom of the anode nozzle and the machining surface of the workpiece is 1.5 mm. The particle size of the nano-CeO2 particles in the test was 100 nm, and the concentration of the nano-CeO2 particles in the plating solution was 1.5 g/L, respectively. The corrosion resistance of the coating was revealed by the electrochemical test of the three-electrode system (Figure 2).
Corrosion potential, corrosion current and other parameters were used to investigate the corrosion resistance of the coating and substrate. The SEM photographs in Figure 3 (image type is SEI) show the surface topography of the composite coating before corrosion. When the concentration of CeO2 nanoparticles in the coating solution reaches 1.5 g/L or more (Figure 3d), it can be observed that the surface morphology of the coating has obvious agglomeration, and the surface of the coating is rough and uneven, with bumps and defects created.
The formation of larger protrusions affects the quality of the coating, and the advantage of nano-CeO2 particles is not obvious. Using EDS technology, the EDS spectrum has been obtained by analyzing the composition of the surface of the coating shown in Figure 3. Studies have shown that the uniform distribution of elements and particles is due to the improved corrosion resistance of the coating.
It can be seen from Figure 8 that the anodic polarization process of the composite coating is hindered and significant passivation occurs, and the composite coating is obtained when the concentration of CeO2 nanoparticles in the coating solution is 1 g/L. As the concentration of nano-CeO2 particles in the electroplating solution increases, the self-corrosion potential shifts continuously, and the corrosion current density gradually decreases. Compared to the pure Ni-Fe-Co-P coating, the addition of nano-CeO2 particles increases the inhibition of the corrosion process of the nickel-based coating.
It shows that the corrosion resistance of the Ni-Fe-Co-P alloy coating is effectively improved by collapsing nano-CeO2 particles. The SEM photographs in Figure 11 (image type is SEI) show the surface topography of the composite layer after corrosion. The degree of corrosion of the composite coating with different concentrations of nano-CeO2 particles in the plating solution is different.
The addition of nano-CeO2 particles increases the P mass fraction of the coating, which helps slow down corrosion. After doping with appropriate number of nano-CeO2 particles, the alloy coating can inhibit this corrosion, and the corrosion rate of the Ni-Fe-Co-P-1 g/L CeO2 composite coating is the smallest, which shows the best corrosion resistance.