However, when the content of the reflective functional material reached 18%, the cooling effect of the coating did not increase, but decreased slightly. This trend suggests that carbon black had a negative effect on the coating's cooling effect, while it improved the surface glare. Figure 8 shows that the emissive layer had a positive effect on the coating's cooling performance.
When the amount of silicon dioxide was increased to 21%, the increase in the cooling effect of the coating was small, only 0.49◦C.
Conclusions and Outlook
Comparison and analysis of heat-reflective coating for asphalt pavement based on cooling effect and anti-slip performance. Constr. Synthesis and characterization of Fe3+doped Co0.5Mg0.5Al2O4inorganic pigments with high near-infrared reflectance.Adv. Experimental evaluation of urban heat island mitigation potential of retro-reflective pavement in urban canyons. Energy building.
Urban canyon albedo and its implications for the use of reflective cool pavements.Energy Build.
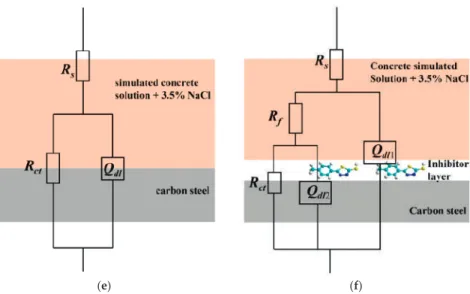
Effect of Inhibitor on Adsorption Behavior and
Mechanism of Micro-Zone Corrosion on Carbon Steel
- Introduction
- Experimental Methods
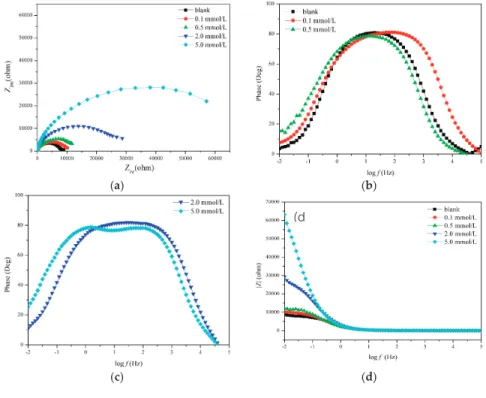
- Results and Discussion 1. EIS Measurement Results
- Conclusions
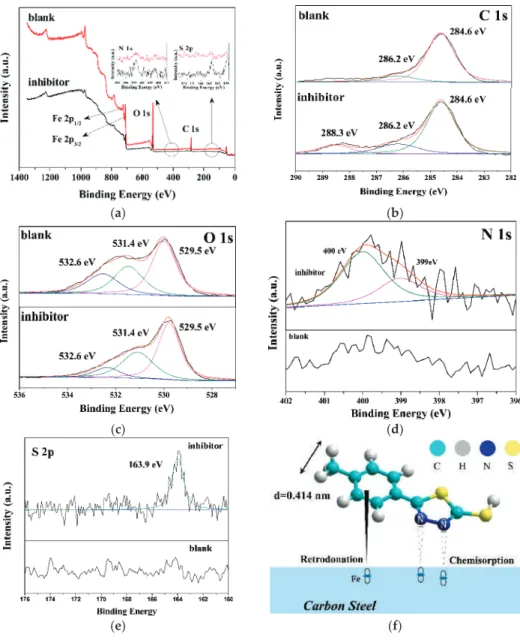
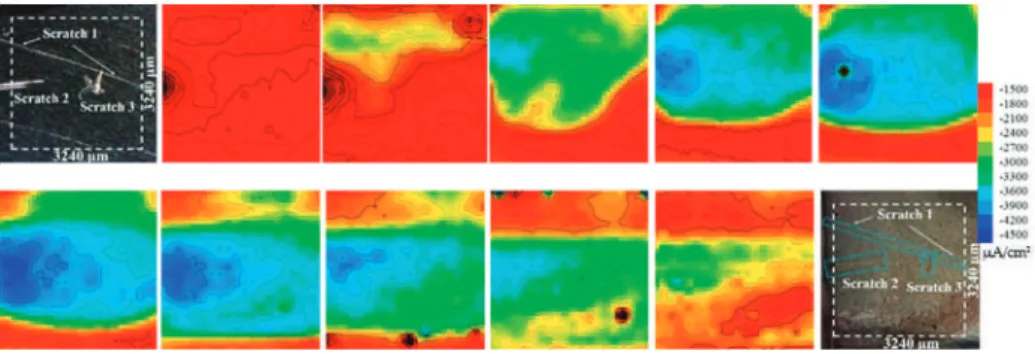
The molecule of the inhibitor under study, namely 2-(5-mercapto-1,3,thiadizaole-2-yl)-(4-methylbenzene), is shown in Figure 1. This solution in the absence of the inhibitor is taken as a blank for comparison. However, prior to SVET tests, scratches are made on the surface of the carbon steel.
Based on the above analysis, the inhibitor adsorption mechanism with coexisting physisorption and chemisorption on carbon steel is shown in Figure 4f.
Performances of Cement Mortar Incorporating Superabsorbent Polymer (SAP) Using Different
Materials and Methods
The self-drying shrinkage of the samples was considered to occur mainly in the first three days [32]. Therefore, the deformation after three days was recorded as the shrinkage of the samples in the paper during drying. The specific freezing and thawing test procedure was carried out according to the Chinese standard (GB/T.
2 The relative dynamic elastic modulus of the sample is less than 60% of the initial value;.
Results and Discussion
The formation of the large SAP cavity has some negative effects on the compressive strength of the sample [25]. It indicates that the 28 d compressive strength of mortars is closely related to the dosage method of SAP, and the incorporation of powdered SAP is more contributed to the development of the 28 d compressive strength of mortar than that of swollen SAP. However, the average size of mortar with swollen SAP (S0.3%-0.06) is 5.62 mm, which can result in a significant reduction in the compressive strength of the mortar.
As existing studies have reported [39,40], drying shrinkage is closely related to the total water-cement ratio and generally increases as the total water-cement ratio increases. Moreover, compared with 0.4% SAP, the dosage of 0.3% SAP can better reduce the drying shrinkage of mortar, which indicates that the drying shrinkage of mortar is also closely related to the amount of blown SAP. Figure 8a,b shows the effect of introduced w/c on the drying shrinkage of mortar for a given 0.3.
Consequently, for a given water-to-cement ratio of 0.06 and 0.3% SAP, the freeze-thaw resistance of the mortar was investigated by measuring the mass loss rate and relative dynamic elastic modulus of the mortar under different freeze-thaw cycles in Figure 9. Therefore, the introduction of SAP can improve the freeze-thaw resistance of the mortar, especially the powdery SAP. However, the scaling occurs on the surface rather than on the inside of the sample during the freeze-thaw cycles.
Therefore, the mass loss of the mortar containing the swollen SAP increases during the freeze-thaw cycles and the strength decreases clearly. The influence of dosage method and material characteristics of superabsorbent polymers (SAP) on the effectiveness of the internal concrete curing materials.
Preparation and Evaluation of Exhaust-Purifying Cement Concrete Employing Titanium Dioxide
Experiments
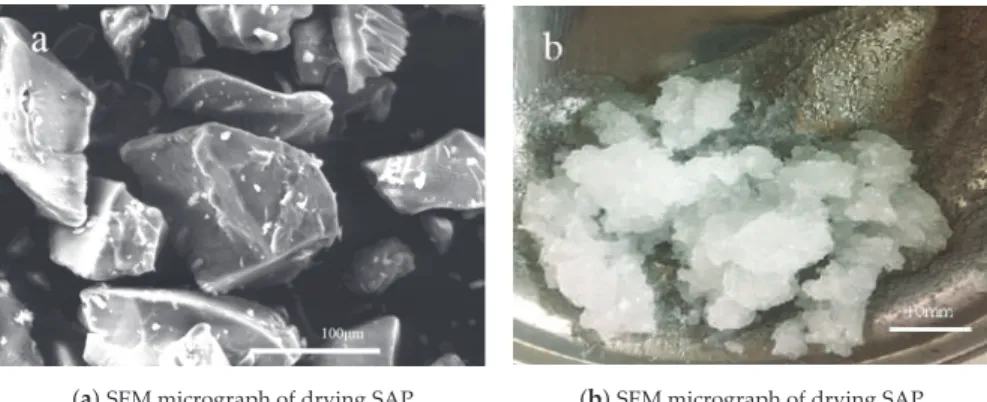
The surface of the samples placed in the reaction chamber was parallel to the lamp to ensure uniform illumination of the sample surfaces. The morphology of powdered TiO2 and the internal structure of the concrete samples were observed by scanning electron microscopy (SEM, Hitachi S-4800, Tokyo, Japan). Surface elemental analysis of the samples was performed using energy dispersive X-ray spectroscopy (EDS) [13,28].
The effect of the planetary high-energy ball milling treatment on the catalyst morphology and crystal structure was investigated by SEM and XRD tests, prior to preparing concrete samples. It can be seen that the percentage of the (101) peak, which is the most thermodynamically stable and has a relatively low chemical activity [19], strongly decreases from 51.84% to 48.47% after application of the ball mill procedure. It should be noted that prior to the start of formal testing, the device was subjected to blank control verification and the change in NO concentration was recorded.
During the equipment verification, the NO concentration was almost unchanged, which proved that the sealing of the reaction chamber was good. Overall, the degradation rate of modified nano-TiO2 samples was much higher than that of the original nano-TiO2 samples. At the same time, the photocatalytic degradation rate of porous cement concrete is better than that of ordinary cement concrete, which is due to the larger contact area with light caused by the connected pores in porous concrete.
In terms of material strength, the best nano-TiO2 content of cement was 3% and 4% for both types of concrete, respectively. Due to Fe3+ doping in the crystal, the photocatalytic degradation effect of the modified nano-TiO2 is better than that of the original nano-TiO2.
Effects of Polypropylene Fibre and Strain Rate on Dynamic Compressive Behaviour of Concrete
Experimental Program
All mixtures are sensitive to the strain rate in terms of dynamic compressive stress, known as. The increase in dynamic compressive strength due to the “strain rate effect” can be attributed to the lateral inertia effect on the contact surface of the specimens under high-velocity impact loading [9,41,42]. For each mixture, the total energy was calculated by multiplying the strain energy density (ie, the area under the stress-strain curve) by the sample volume [12].
Below the strain rate of 50 s−1 and 70 s−1, the effect of PP fiber contents on DIF of all blends was remarkable. The effect of strain rate on the dynamic failure mode of all blends is illustrated in Figure 13. It can be clearly seen that the failure patterns of the blends were more complete with the PP fiber under low strain rate.
Two parts of energy are generally required to break fiber reinforced concrete, i.e. the energy to break the matrix and the energy to pull out or tear fiber reinforcements [9]. When the strain rate is relatively high, the impact loading time is extremely short and therefore the dynamic compressive strength of all mixtures was improved by increasing the energy to generate cracks. The 'strain rate effect' can be observed for all mixtures with respect to the dynamic pressure properties.
As the strain rate increased, the dynamic compressive strength of all mixtures increased and the DIF of all mixtures increased gradually. However, the effectiveness of PP fibers decreased when the strain rate increased, which can be mainly attributed to the extremely short impact loading time.

Anti-Corrosion Property of Glass Flake Reinforced Chemically Bonded Phosphate Ceramic Coatings
Materials and Methods 1. Materials
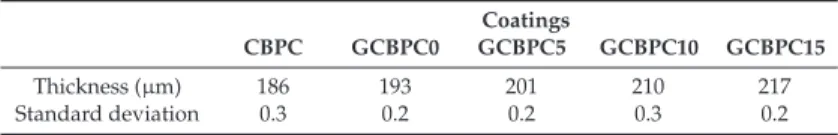
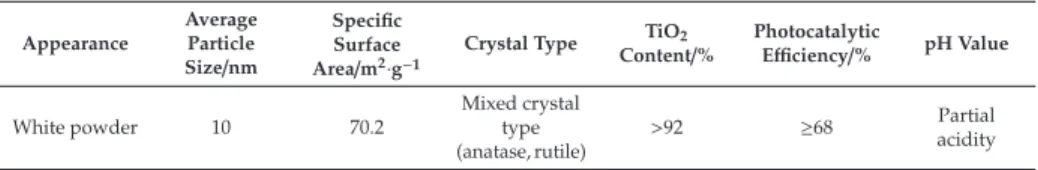
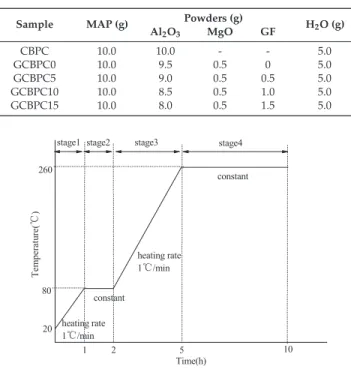
The CBPC coatings reinforced with GF were applied to round steel 8 mm in diameter and 20 mm in length by mixing raw materials of phosphate ceramics as shown in Table 1. Chromium trioxide CrO3 Sinopharm Chemical Reagent Co., Ltd., Shanghai, China Alumina Al2O3 Aladdin Industrial Corporation Tech Co., Ltd., Shanghai, China Magnesia MgO Sinopharm Chemical Reagent Co., Ltd., Shanghai, China Glass flake (150 mesh) SiO2. Hebeifang China Ltd. 3H3PO4+Al(OH)3→Al(H2PO4)3+3H2O (1) The mixing proportion of phosphate ceramic coating materials is shown in table 2.
Before coating preparation, 800 grit silicon carbide sandpaper was used to polish the surface of the round steel, the round steel was degreased in acetone for 15 minutes (in ultrasonic bath) and then rinsed with deionized water. Laser scanning confocal microscopy (LSCM, manufacture, Oberkochen, Germany) was used to characterize the thickness and surface topography of the GF. The thickness of the coating was tested using a QNIX4500 coating thickness gauge (QNIX, Oberkochen, Germany) with a precision of 1μm.
The crystalline phases of phosphate ceramic coatings after curing were measured with an X-ray diffractometer (PANalytical Empyrean, Almelo, The Netherlands) using a CuKαsource scanning from 5◦ to 70◦in 2θ. A differential scanning calorimeter (STA instruments, Selb, Germany) was used to analyze the curing behavior of phosphate ceramic coating materials under an N2 atmosphere with a gas flow of 30 ml/min, a heating rate of 10 °C/min, a start temperature of 25 °C and a final temperature of 400 °C. Furthermore, the SEM micrographs of the surface and cross-section of the coated samples were examined on a JSM-IT300 (JEOL, Tokyo, Japan) under secondary electron mode, test voltage of 10 kV and platinum surface treatment.
Potentiodynamic polarization was performed using a CS350 workstation (Wuhan Corrtest Instrument Co., Ltd., Wuhan, China), as well as electrochemical impedance spectroscopy (EIS) measurement, with a three-electrode system, containing the reference electrode (saturated with calomel), the opposite working electrode (opposite electrode). At least three repeated electrochemical tests were performed to confirm the reliability of the measurement.
Results and Discussions
The difference in thickness is not enough to affect the corrosion resistance of the coatings. The results obtained from the XRD patterns of the phosphate ceramic coatings are shown in Figure 4. Therefore, the healing enthalpy of reaction of the phosphate ceramic materials increases with the addition of the magnesia and the GF additives, which highlights the higher crosslinking density in the phosphate ceramic materials [35,36].
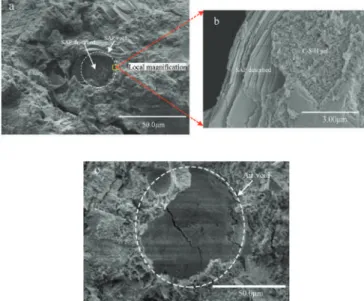
In addition, the GF particles on the surface and interior of the coating are shown in Figures 6 and 7. On the other hand, the GF particles achieve homogeneous and parallel dispersion on the surface and interior of the coatings. The effect of the magnesia and the GF particles on the corrosion resistance of CBPC samples was evaluated using the polarization measurement in 3.5 wt% NaCl solution.
Figure 8 illustrates the potentiodynamic polarization data for the uncoated round steel and the coated different phosphate ceramic samples. As is well known, the higher the value of η, the better the anti-corrosion performance can be. According to EIS parameters from Table 6, the solution resistance (Rs) remains stable, the addition of magnesium oxide improves the anti-corrosion performance of CBPC to some extent, as the coating resistance (Rc) and charge transfer resistance (Rct) increase.
Second, the parallel distribution of GF particles on the surface and interior of the coating makes the electrolyte diffusion path more tortuous. Meanwhile, the GF particles have a good adhesion with GCBPC and achieve a homogeneous and parallel distribution on the surface and inside of the coatings.