Eva Wollenberg, University of Vermont and CGIAR Research Program on Climate Change, Agriculture and Food Security (CCAFS), USA. The CGIAR Research Program on Climate Change, Agriculture and Food Security (CCAFS) is supported by Australia (ACIAR), the Government of Canada through the Federal Department of the Environment, Denmark (DANIDA), Ireland. Irish Aid), the Netherlands (Ministry of Foreign Affairs), New Zealand, Portugal (IICT), Russia (Ministry of Finance), Switzerland (SDC), the British Government (UK Aid), the European Union, and carried out with technical support from the International Fund for Agricultural Development (IFAD).
Contributors
Motivation for These Guidelines
Agriculture in tropical developing countries produces about 7–9% of annual anthropogenic greenhouse gas (GHG) emissions and contributes to additional emissions through land-use change (Smith et al. 2014. Our current ability to quantify GHG emissions and mitigation from agriculture in tropical developing countries is remarkable limited (Rosenstock et al. 2013.
Who Should Use These Guidelines?
Some could be incremental changes in practice (such as improved nitrogen use), while others could be system-wide changes (such as changing crops or animal breeds, or building trees). Once the geography and scope of mitigation efforts have been established, establish a list of practices that may be applicable.
How to Use These Guidelines
This characterization of the system provides fundamental information about the distribution and importance of agricultural activities in the landscape. The six chapters that make up this step discuss methods for quantifying stocks, stock changes, and fluxes of the major sources and sinks of greenhouse gases, including land use and land cover change (Kearney and Smukler Chap. 3), soil gas emissions (Butterbach- Bahl et al.
Chapter 2
Targeting Landscapes to Identify Mitigation Options in Smallholder Agriculture
Introduction
Many research initiatives aim to close this information gap and will ultimately lead to the adoption of mitigation practices in smallholder agriculture. If estimates of emission reductions are not available, the success of mitigation measures will be unknown.
Initial Steps
Landscape units can be further divided into j farm types and k common lands to describe differences in the ways individual households and communities access and use land. The identified units can be studied in terms of land productivity, economic results, carbon stocks, GHG emissions and the social and cultural importance of agricultural activities for rural households.
Top-Down Approach
- Landscape Stratifi cation: An Example from East Africa
2.6 (a) In situ land use/land cover information of training samples for one of the ten strata; the segmented image objects are also visible in gray, (b) classification result based on spectral and textural properties of the WorldView-2 ® VHR image for the same stratum. The two previous approaches are based on static descriptions of the landscape units (or of their components) in the form of LULC.
Bottom-Up Approach
- Field Typology Defi nition
There is evidence that field types can be determined based on simple indicators related to soil quality and soil productivity. The process of determining the typology of the field depends on the landscape within which the project operates and the sociocultural norms of the farmers.
Combining Top-Down and Bottom-Up: The Basis for Scaling Up
Fields next to the homestead are given a score of 2, while fields further away from the homestead are given a score of 0. Those with scores between 4 and 10 were marked as field type 2, and those with scores lower than 4 were marked as field type 3.
Conclusions
Appendix
Jobbágy EG, Sala OE, Paruelo JM (2002) Patterns and controls of primary production in the Patagonian steppe: a remote sensing approach. Ostrom E, Nagendra H (2006) Insights into linking forests, trees and people from the air, on the ground and in the laboratory.
Chapter 3
Determining Greenhouse Gas Emissions and Removals Associated with Land-Use
Introduction
Emission factors refer to the data used to calculate carbon stocks associated with activity data and are usually presented as metric tons of carbon (or carbon dioxide equivalents) per acres. The focus of this chapter is on the generation of activity data and the various methods available to link emission factors and/or carbon stock densities with activity data to estimate total carbon stocks and GHG emissions/removals at the landscape scale.
Determining Change in LULC
- Setting Project Boundaries
- Data Acquisition
- LULC Classifi cation and Change Detection
Unsupervised classification algorithms group pixels into similar spectral classes and very small spectral differences between classes can be identified (Vinciková et al. 2010. Explicit spatial methods (Approach 3) to detect changes in LULC can be divided into three categories of general: comparison after classification, image.
Developing a Baseline
- Baseline Scenarios
- Reference Regions
The project-specific approach is often based on logical arguments, where the baseline scenario is identified as the scenario facing the fewest barriers (Greenhalgh et al. 2006. This approach may require more greenhouse gas-related and spatially explicit data to enable quantitative analysis of trends in LULC changes and greenhouse gas emissions/removals (Greenhalgh et al. 2006.

Calculating Carbon Stock Changes
- Key Carbon Pools
- Initial Carbon Stock Estimates
- Monitoring Carbon Stock Changes
Carbon stock changes are estimated using one of two general methods: one process-based and the other stock-based. Single carbon stock density is applied to each LULC class based on default global or regional data.
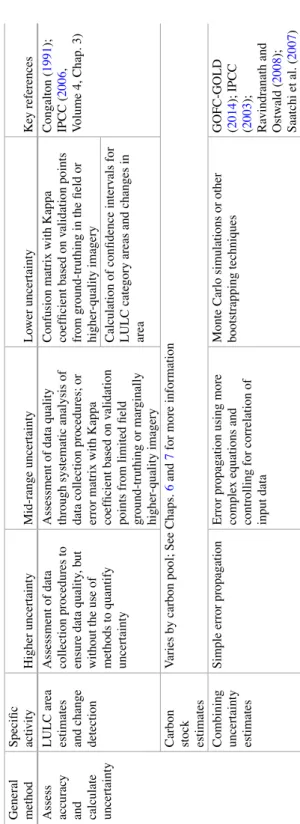
Assessing Accuracy and Calculating Uncertainty
- LULC Classifi cation Accuracy Assessment
- LULC Change Detection Accuracy Assessment
- Uncertainty Associated with Estimating Carbon Stocks
- Combining Uncertainty Values and Reporting Total Uncertainty
Combining uncertainty estimates for activity data, LULC change detection and emission factors or carbon stocks can be done in several ways, from simple error propagation calculations (Tier 1) to more complex Monte Carlo simulations, also called bootstrapping or bagging (Tier 2 and 3). Simulation results can be combined with classification accuracies to calculate uncertainties for each pixel.
Challenges, Limitations, and Emerging Technologies
In: Giri CP (ed) Remote sensing of land use and land cover, Remote sensing applications series. Lambin EF, Geist HJ, Lepers E (2003) Land use dynamics and land cover change in tropical regions.
Chapter 4
Quantifying Greenhouse Gas Emissions from Managed and Natural Soils
Introduction
Thus, changes in land use and land management, as well as changes in climate, affect plant primary production and flow of litter to the soil and the dynamics of mineralization of organic matter in the soil. This chapter does not aim to provide a cookbook of how to measure soil and GHG fluxes.
What Technique Is Most Suitable for Measuring
As a result, greenhouse gas fluxes also vary significantly across spatial scales, necessitating the development of a robust sampling strategy to target measurement sites, i.e. determine which localities are representative of the landscape you want to work in in order to estimate greenhouse gases. flows and develop strategies to reduce these emissions. Targeting (Chapter 2 of these guidelines) is a cornerstone to allow meaningful scale-up to landscape and higher spatial scales.
Biosphere–Atmosphere Exchange Processes of GHGs?
Micrometeorological Measurements
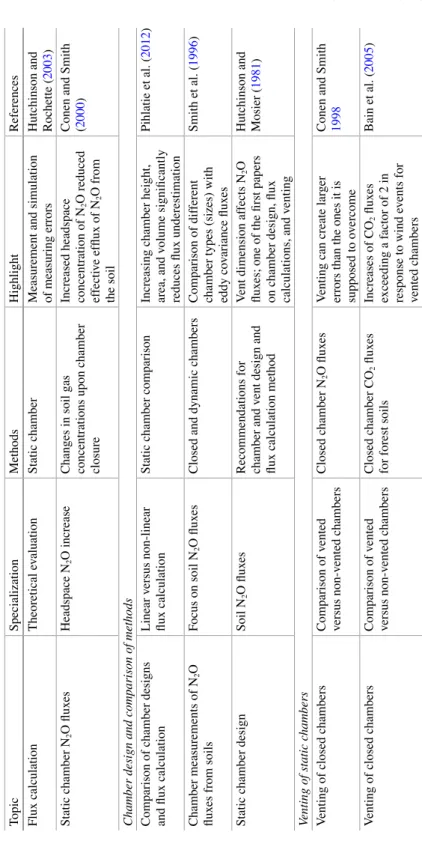
Ventilation dimension affects N 2 O fluxes; one of the first papers on chamber design, flux calculations and venting. Venterea and Baker (2008) Static chamber measurements of soil CO 2 fluxes Spatial heterogeneity, flux calculation Frequency of sampling and number of chambers to overcome spatial heterogeneity.
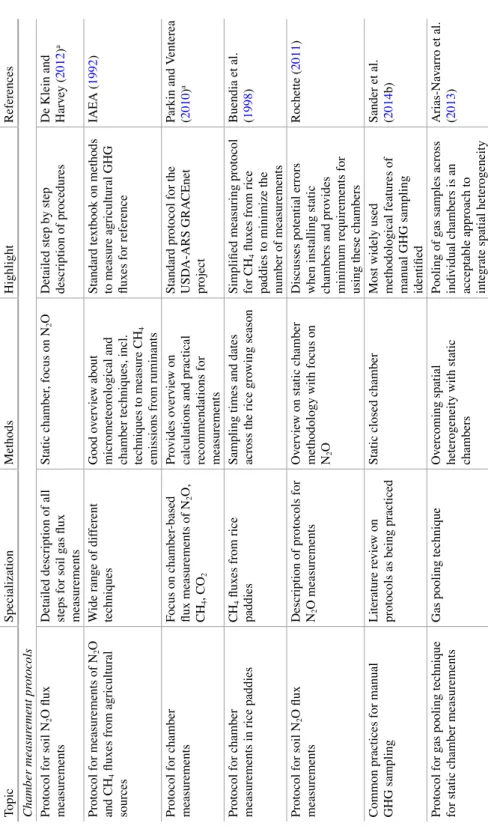
Chamber Measurements
The closing time of the chamber depends not only on the size of the gas flow, but also on the height of the chamber. The gas concentration above the soil surface (black line) remains at a relatively constant level; at the moment when the chamber is closed (left arrow), the concentration in its superspace starts to increase.
Measurement of GHG Fluxes in Rice Paddies
- Rice Chamber Design and General Procedure (See Also Table 4.2 )
- Time of Day of Sampling
- Sampling Frequency
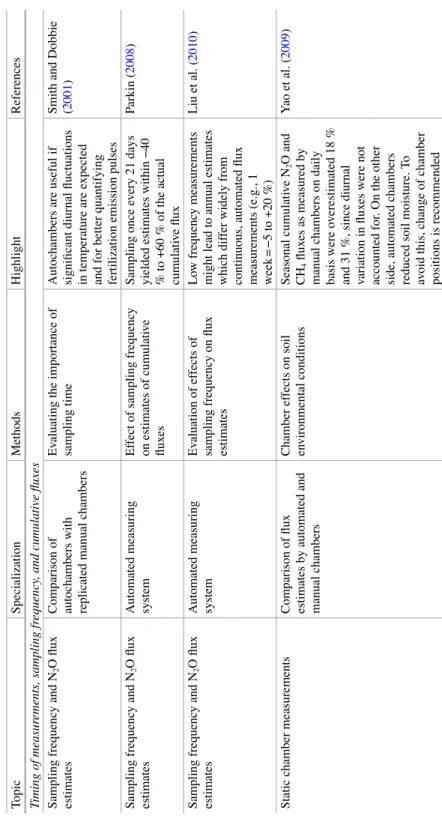
The problem can be addressed by proper sampling design (Fig. 4.1) (see e.g. Davidson et al.. 2002) or by using the gas pooling technique (Arias-Navarro et al. Methane emissions typically follow a distinct diurnal variation following changes in soil temperature ( Neu et al.
Analytical Instruments Used for Chamber Measurements
- Gas Chromatography
- Spectroscopic Methods
- Auxiliary Measurements
Therefore, measurements of greenhouse gas fluxes are quite useless if environmental parameters such as soil and vegetation properties and management are not monitored simultaneously, as these factors have a significant influence on the fluxes. Comprehensive datasets, including both flux measurements and detailed information on soil and vegetation properties and management are prerequisites for model development and testing.
Conclusions
Denmead OT (2008) Approaches to measuring methane and nitrous oxide fluxes between landscapes and the atmosphere. Kebreab E, Clark K, Wagner-Riddle C, France J (2006) Methane and nitrous oxide emissions from Canadian animal agriculture: a review.
Chapter 5
A Comparison of Methodologies for Measuring Methane Emissions
Introduction
The accumulation of excessive amounts of H 2 in the rumen negatively affects the rate of fermentation and the growth of some microbial consortia. Increased production and efficiencies in the livestock sector are seen as complementary outcomes if enteric methanogenesis can be reduced.
- Estimation from Diet
These methods can be used to support mitigation strategies or to quantify total national livestock emissions. A number of algorithms can be used for this, although emission estimates can vary by 35% or more for a given diet (Tomkins et al. 2011.
Direct Measurement
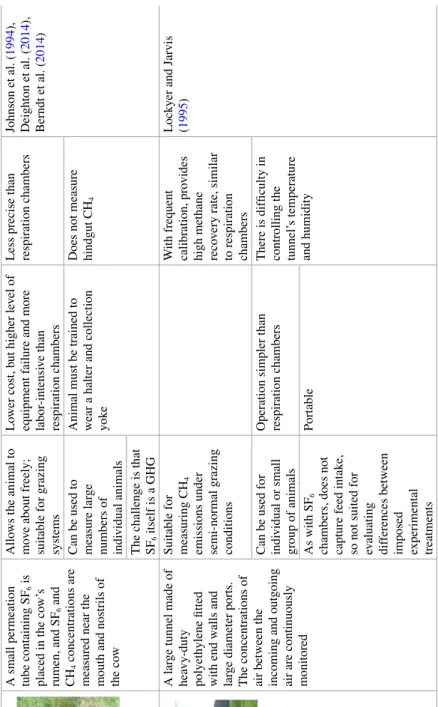
- Open-Circuit Respiration Chambers
- Ventilated Hood System
- Polytunnel
- Sulfur Hexafl uoride Tracer Technique
- Open-Path Laser
Their use is technically demanding and only a few animals can be monitored at any time (McGinn et al. 2008). Only a few animals can be used for measurements within the chambers at any time (Nay et al.
Short-Term Measurement
- Greenfeed ® Emission Monitoring Apparatus
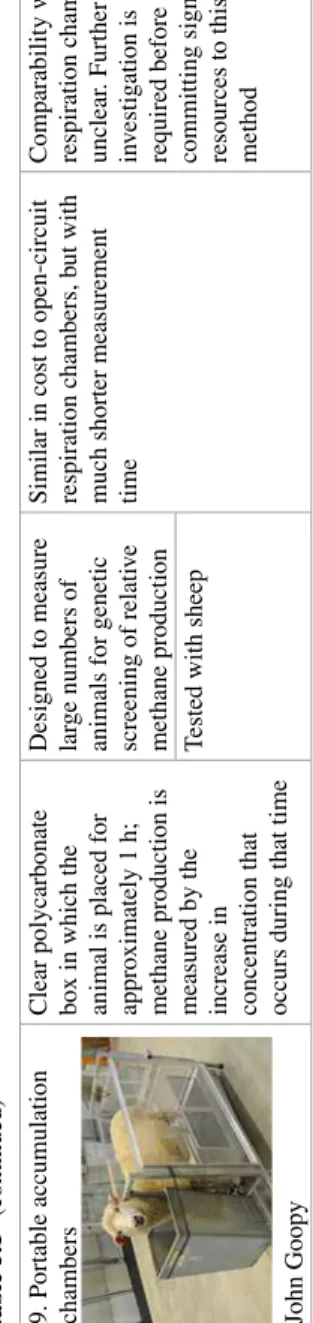
- Portable Accumulation Chambers
- Application of CH 4 :CO 2 Ratio
- Spot Sampling with Lasers
Subsequent investigations have shown that such measurements are moderately reproducible in the field and have potential for genetic screening of animals (Goopy et al. 2015. This method requires knowledge of the intake, energy content and heat gain of the meal consumed).
- Intraruminal Telemetry
Spot measurements of methane in the air around cattle's mouths have been made using laser devices to provide short-term estimates of enteric methane flow (Chagunda et al. The use of a rumen bolus to measure methane in the liquid phase is logistically possible and small changes (<50 μmol L -1 ) in CH 4 concentrations can be detectable (Gibbs 2008.
Summary
McGinn SM, Flesch TK, Harper LA, Beauchemin KA (2006) An approach to measuring whole-farm methane emissions. Murray PJ, Gill E, Balsdon SL, Jarvis SC (2001) A comparison of methane emissions from grazing sheep pastures with different management intensities.
Quantifying Tree Biomass Carbon Stocks and Fluxes in Agricultural Landscapes
Introduction
The synergy between climate adaptation and mitigation through trees in agricultural lands is now receiving explicit attention (Duguma et al. 2014. Most NFIs (except Sweden and Canada) do not include explicit TOF categories (de Foresta et al. 2013).
Accuracy, Scale, and Cost
BEM modeling is therefore a suitable way to estimate carbon from both field inventories and remote sensing. This is because there is currently no remote sensing instrument that can directly measure carbon stocks in trees (Gibbs et al. 2007.
Quantifi cation of Five Carbon Pools of Representative Plots
- Selecting Plots
- Measurements of Proxies for Tree Biomass
- Calculating C Stocks and Fluxes
- Scaling to Whole-Farms and Landscapes
It is therefore crucial that the sample is representative of the wider area and company. Repeatedly measuring the same tree species is an opportunity to obtain information about growth rates or annual changes in carbon stocks.
Additional Sources of Information
Duguma L, Minang PA, van Noordwijk M (2014) Climate change mitigation and adaptation in the land use sector: from complementarity to synergy. Kuyah S, Dietz J, Muthuri C, van Noordwijk M, Neufeldt H (2013) Allometry and partitioning of aboveground and belowground biomass in cultivated Eucalyptus species dominating agricultural landscapes of western Kenya.
Introduction
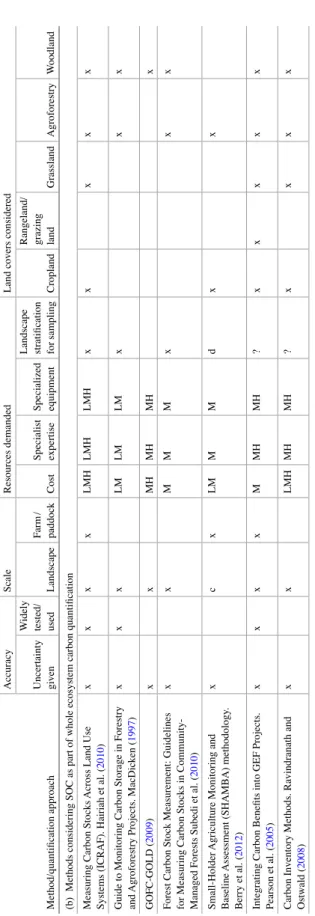
Yet they can also offer great mitigation potential through the implementation of good governance and sustainable agricultural practices, especially through improvements in land use management, as almost 90% of IPCC-identified technical potential lies in improving soil carbon sinks (Lipper et al. 2011 ). Therefore, efficient sampling designs across small farming systems are needed to ensure that SOC stocks and stand changes can be detected at different scales with a given accuracy and at minimal cost (Milne et al. 2012; Singh et al. 2013).
Quantification of Soil Carbon Stocks
- Sampling Design: Stratification of the Project Area
- Sample Collection
- Sample Preparation and Analytical Methods
- Quantification of SOC Stocks
- Scaling SOC Stocks to Landscape and Whole Farms
Indeed, the largest component of the total cost incurred in SOC surveys corresponds to sampling and soil preparation (Aynekulu et al. 2011). SE is the standard error for the entire population ah is the area of the stratum h.
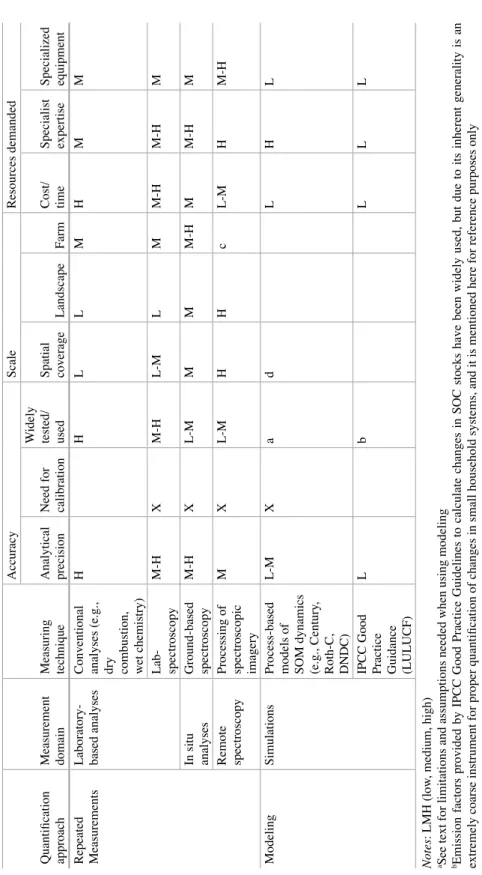
Quantification of Soil Carbon Stock Changes
- Repeated measurements
- Modeling
- Monitoring Frequency and Recommendations
A further classification is made on the basis of the measurement domain (where the analyzes take place). Here, we briefly describe some of the main weaknesses of models that can potentially be used to quantify SOC stock changes within the context of small household farming systems in tropical environments.
Appendix A: Methodology for Quantification of Soil Carbon Stocks and Carbon Stock Changes
N is the number of sampling units in the population, that is, the total area divided by the plot size. Determining the number of plots to be sampled in each stratum as a proportion of its area and the observed variance can certainly be an efficient approach.
Appendix B: Simplified Protocol for Taking and Processing Soil Samples, Adapted for the SAMPLES Project
If you use a shovel to reach the required depth, the monster is obtained by scraping the soil out of the walls. Also avoid cross-contamination between samples by doing this from the outside of the bag (squeeze gently with your fingers).
Yield Estimation of Food and Non-food Crops in Smallholder Production Systems
- Introduction
- Crop Productivity Estimation
- Crop Cuts
- Farmers’ Survey
- Estimating Crop Yield by Using Grain Weight (Test Weight)
- Whole Plot Harvest
- Sampling for Harvest Unit
- Expert Assessment
- Crop Cards
- Crop Modelling
- Allometric Models
- Remote Sensing
- Critical Analysis and Comparison of Yield Estimation Methods with Regards to Cost, Scale, and Accuracy
- Conclusion
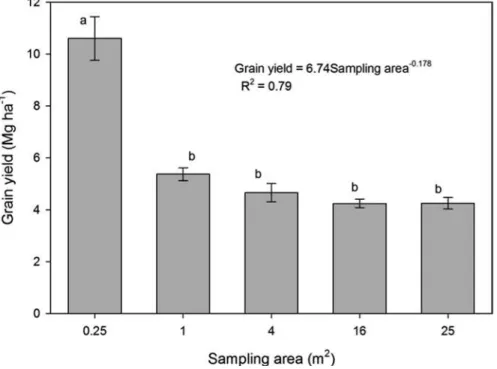
Standardization of yield assessment methods, especially in the context of the smallholder production system at different levels (field, farm to landscape). Yield estimation using a pre-estimated test weight is one of the easiest and fastest methods that can be used in many farm situations and conditions.
Scaling Point and Plot Measurements of Greenhouse Gas Fluxes, Balances,
Introduction?
Agricultural systems are a major source of greenhouse gas (GHG) emissions to the atmosphere, contributing about 30% to total anthropogenic emissions when land-use change is included (Vermeulen et al. 2012). Scale refers to the spatial or temporal dimension of a phenomenon (van Delden et al. 2011; Ewert 2004).
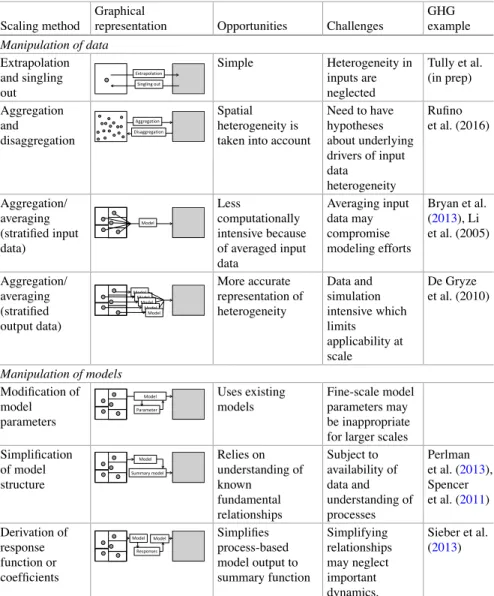
Scaling Methods
This has been successfully done for national-scale soil C monitoring in the United States, where an integrated data collection and biogeochemical process-based model (DAYCENT) estimates changes in soil C stocks (Spencer et al. 2011). In contrast, process-based ecosystem models are based on our current theoretical understanding of the physicochemical and biological processes underlying greenhouse gas emissions.
Using Empirical and Process-Based Models with Disaggregated Data
- Empirical Models
- Process-Based Models
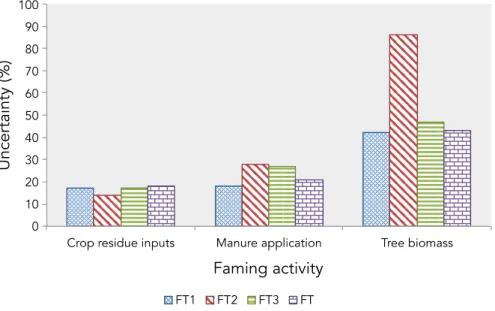
However, in many countries, these sources are thought to be significant contributors to total GHG budgets (Gerber et al. 2013). Del Prado etc. 2013) and to our knowledge none have been applied to the smaller conditions of developing tropical countries.
Conclusion
Food and Agriculture Organization of the United Nations (FAO), Rome Giltrap DL, Li C, Saggar S (2010) DNDC: a process-based model of greenhouse gas fluxes from. Pathak H, Li C, Wassmann R (2005) Greenhouse gas emissions from Indian rice fields: calibration and upscaling using the DNDC model.