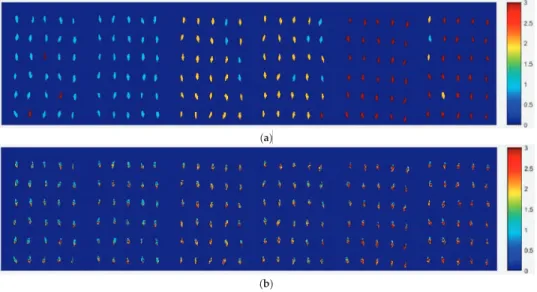
The first is the difference between the mutant and wild-type samples, that is, the difference between valine and glutamic acid. These findings suggest that CP-ANN models built on NIR data can detect the BRAF V600E mutation in CRC directly based on the fundamental difference between mutant and wild type, ie. differences between valine and glutamic acid, instead of paraffin, HE and nothing.
Detecting Zn(II) Ions in Live Cells with Near-Infrared Fluorescent Probes
Introduction
We find a significant decrease in the fluorescence background of the probes when the acetyl group is attached to the hydroxyl group on the hemicyanine platform. However, when present, Zn(II) ions coordinate with probe A and promote hydrolysis of the acetyl, which results in a significant increase in the fluorescence of the hemicyanine fluorophore both in solution and in living cells.
Experimental Section
The absorption and fluorescence spectra were obtained 10 minutes after addition of Zn(II) ions. The fluorescence images were obtained at 60x magnification and the laser energies were held constant for each set of images.
Results and Discussion
This difference can be attributed to the weaker binding of Zn(II) ions due to the replacement of one pyridine by pyrazine. This weaker coordination of the Zn(II) ion may be responsible for the dampened increase in fluorescence when pyrazine is present (probeB) in place of pyridine (probeA).

Conclusions
Design and synthesis of a squaraine-based near-infrared fluorescent probe for the ratiometric detection of Zn2+ ions. Dyes Pigm. A novel near-infrared fluorescent probe for sensitive detection of beta-galactosidase in living cells. Anal.
Insight into Rapid DNA-Specific Identification of Animal Origin Based on FTIR Analysis: A Case Study
Results and Discussion
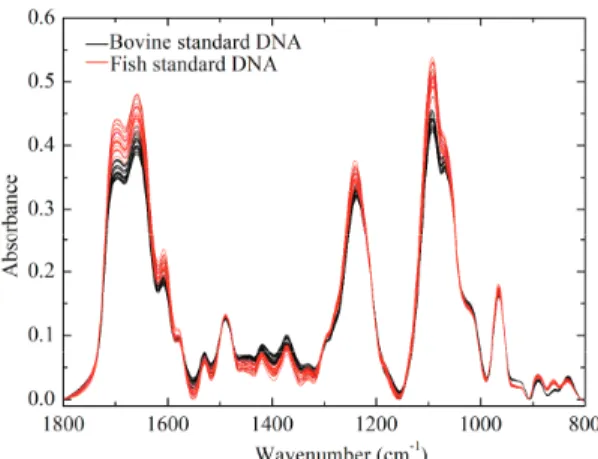
Initially, PCA was used to determine the resolution of FTIR spectra of bovine and fish standard DNA samples. The difference profile between bovine (minuend) and sheep (subtrahend) DNA samples is presented in Figure 8B.
Material and Methods
Fourier Transform Infrared Spectroscopy of DNA from the Chuxiong Population of Camellia reticulata Lindl. Analysis of the DNA Fourier transform-infrared microspectroscopic signature using an all-reflective objective. Microns.
On-The-Go VIS + SW − NIR Spectroscopy as a Reliable Monitoring Tool for Grape Composition
- Results
- Discussion
- Materials and Methods
- Conclusions
The spectral measurements (a total of 144 during the entire experiment) were performed on the east side of the canopy. Design of the spectral processing procedure required to analyze on-the-go spectral measurements of grape bunches under field conditions.
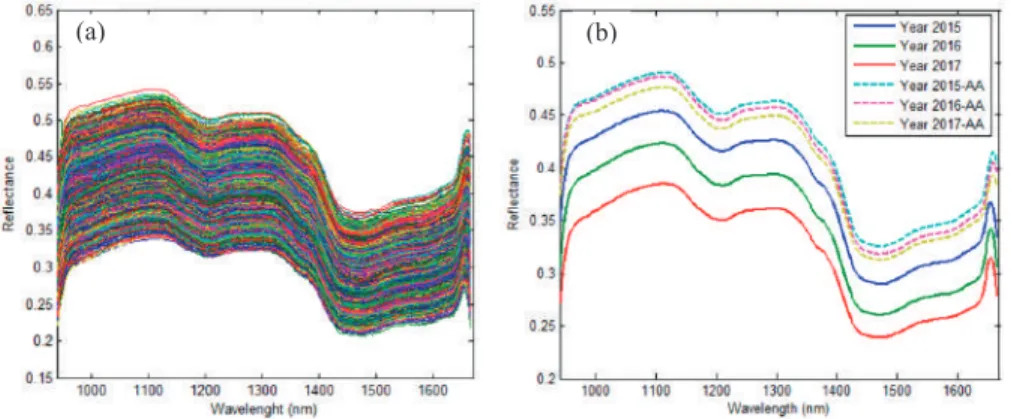
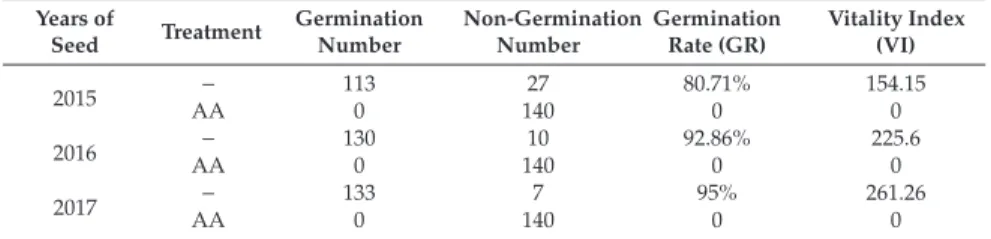
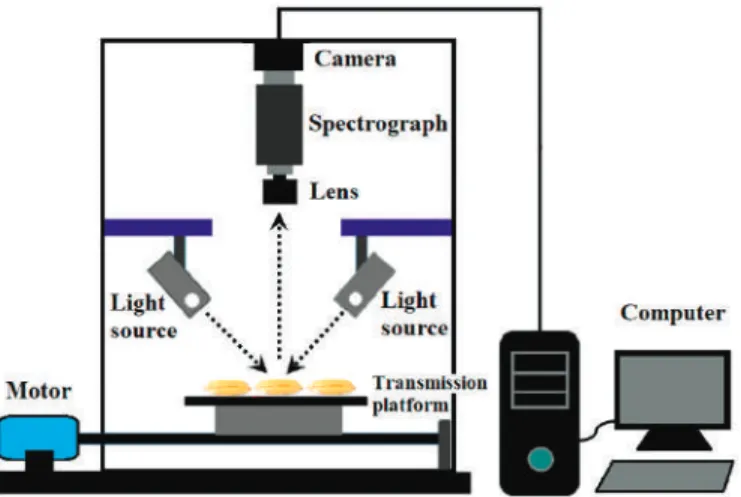
Rapid and Nondestructive Measurement of Rice Seed Vitality of Different Years Using Near-Infrared
Hyperspectral Imaging
Materials and Methods
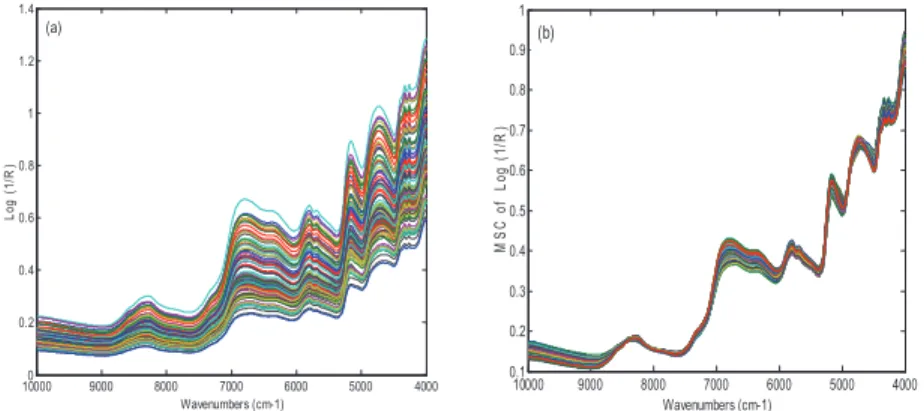
Based on the spectral data with different pre-processing methods – i.e. SG, SG-D1 and MSC – the performances of the three models above were analyzed and evaluated to classify the viability of seeds stored for different years. Regarding the detection of seed vitality of the three different years, better performance can be achieved by using pretreatment SG compared to the other two pretreatment methods.
Discrimination of Trichosanthis Fructus from
Different Geographical Origins Using Near Infrared Spectroscopy Coupled with Chemometric Techniques
SIMCA
SIMCA is a supervised data classification method based on PCA first proposed by Wold [36]. In SIMCA, PCA is performed for each class in the data set and the optimal number of PCs. The number of PCs retained for each class is important, as retaining too few components can distort the signal or information content of the model, while retaining too many PCs reduces the signal-to-noise ratio.
The optimal number of PCs is selected when adding another PC does not significantly improve the model's performance.
PLS-DA
SVM-DA
All this has caused changes in the types and content of components in Trichosanthis Fructus of different geographical origins. Effect of Germplasm Variation on Total Saponins and Adenosine Content in Trichosanthis Fructus. Lishizhen Med. Amino acid fingerprints of Trichosanthis Pericarpium from different cultivars and habitats by HPLC.Acta Chin.
Determination of content of quercetin and total flavonoids in Trichosanthis Pericarpium from different areas. Chin.
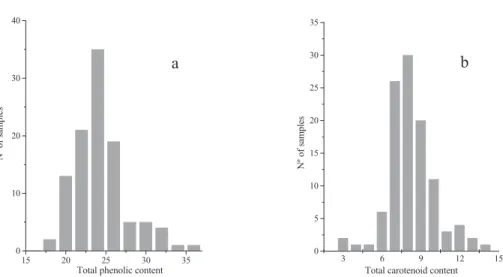
Quantification of Total Phenolic and Carotenoid Content in Blackberries (Rubus Fructicosus L.) Using
Multivariate Analysis
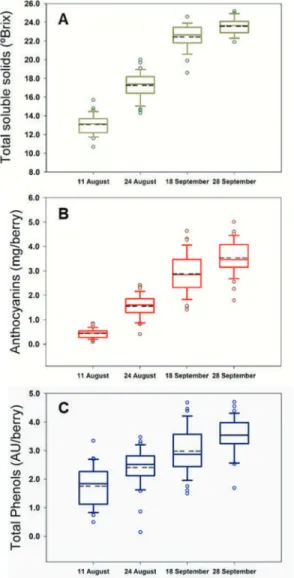
The Q2 values give an indication of the percentage variation in the variable Y that is accounted for by the variable X. Those wavelengths corresponding to the absorptions from the electronic vibrations assigned to chlorophyll (672 nm) and the stretching groups: C=O and O-H (1444 nm), C-O (1692 nm), N-H with C-O (2068 nm) and OH cellulose factor per second stretching of Figure (2268) b). Acknowledgments: We thank Nicholas Davies for his assistance in grammatical revision of the manuscript.
Usefulness of near-infrared spectroscopy and chemometrics in assessing the quality of Prošek.Croatian dessert wine.
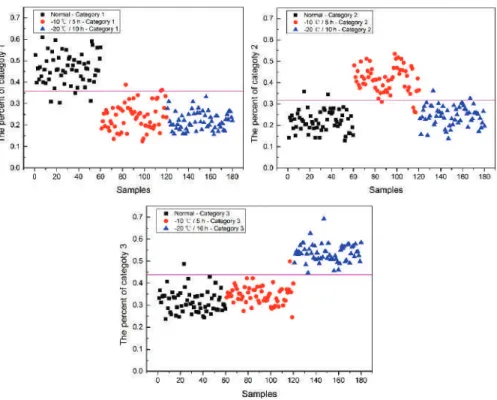
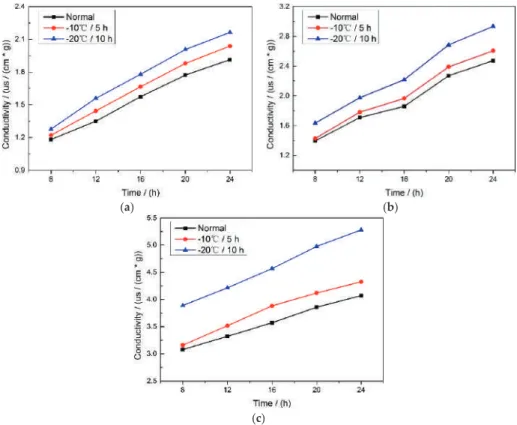
Classification of Frozen Corn Seeds Using Hyperspectral VIS/NIR Reflectance Imaging
Results and Discussions 1. Results of Conductivity Test
Using the same preprocessing method, the classification accuracies of the full band, SPA, PCA, and X-loading methods were ranked: the full band classification accuracy results are more than 80%. The last 60 corn seed samples had a higher percentage of Category 3 than the other corn seed samples because they were severely frost-damaged corn seed. With a threshold of 0.44 and all category 3 maize seeds correctly classified, maize seed sample number 23 and 117 were misclassified as category 3.
Method M2P: the spectrum of each pixel of the embryo images was classified, and each pixel of the corn seed corresponded to the classification value.
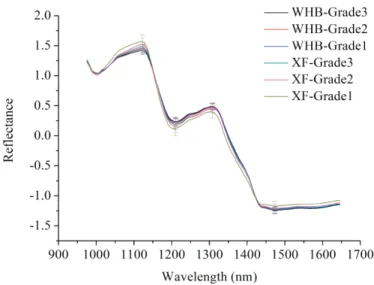
Identification of Maize Kernel Vigor under Different Accelerated Aging Times Using
The average spectral reflectance curves of corn kernels of two varieties at eight different aging times are shown in Figure 1. The derived second-order spectra showed more obvious differences of corn kernels between different aging times than raw spectra. It is possible to observe the spectral differences of corn kernels at different aging times at certain wavelengths.
Hyperspectral imaging technology combined with SVM models was used to identify the vigor of maize kernels after different aging times.

Variety Identification of Raisins Using Near-Infrared Hyperspectral Imaging
Results and Discussion 1. Spectral Profiles
All three models based on object spectra obtained acceptable results for the calibration set with accuracies ranging from 87%–99%. Accuracies based on models using pixel-by-pixel spectra to predict pixel-by-pixel spectra or object spectra were much lower than the same models using optimal wavelengths selected by PCA. The results of a set of model predictions using object spectra to predict pixel spectra were poor, with accuracies ranging from 48% to 63%.
Models using object-wise spectra to predict object-wise spectra achieved acceptable results, with all accuracies above 90%.
Materials and Methods 1. Sample Preparation
One of the advantages of hyperspectral imaging is that prediction maps can be created to visualize the distribution of physical and chemical characteristics. Detection of Sclerotinia stem rot on oilseed rape (Brassica napusL.) leaves using hyperspectral imaging. Sensors. Multi-waveband detection of germ damage in Canadian Western Red Spring wheat using visible/near-infrared hyperspectral imaging. Biosyst.
Identification of coffee bean varieties using hyperspectral imaging: Influence of preprocessing methods and pixel-wise spectra analysis. Science.
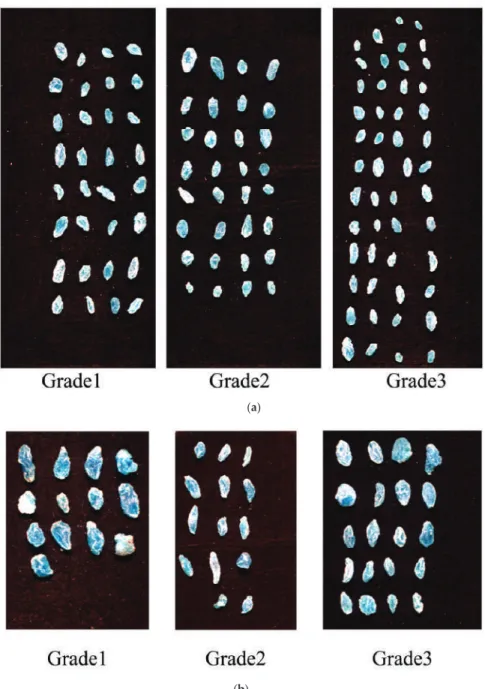
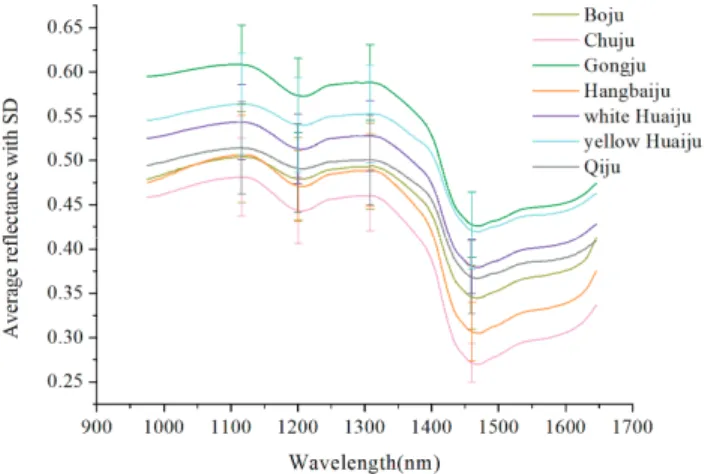
Discrimination of Chrysanthemum Varieties Using Hyperspectral Imaging Combined with a Deep
Near-infrared spectroscopy (NIRS), as a potential technology for rapid measurement, has been widely used in various fields, such as geographical origin discrimination of agricultural products [4], quality assessment of agricultural seeds [5], variety identification of Chinese herbal medicines [6]. In this study, the optimal discriminant model based on hyperspectral imaging was chosen to visualize the spatial distribution of chrysanthemum varieties. Maize kernel hardness classification by near infrared (NIR) hyperspectral imaging and multivariate data analysis.Anal.
Discrimination of CRISPR/Cas9-induced rice seed mutants using near-infrared hyperspectral imaging.Sci.
Optimized Prediction of Reducing Sugars and Dry Matter of Potato Frying by FT-NIR Spectroscopy on
Materials and Methods 1. Potatoes
Finally, since the robustness of the models is closely linked to the variability introduced, additional potato varieties adapted to the potato frying industry should be added to the current models. Non-destructive assessment of apricot fruit quality by portable visible-near-infrared spectroscopy.Lwt-Food Sci. Towards online prediction of dry matter content in whole unpeeled potatoes using near-infrared spectroscopy.Talanta.
Non-destructive determination of sugar content in potato tubers using visible and near-infrared spectroscopy.Jpn.
Determination of Adulteration Content in Extra Virgin Olive Oil Using FT-NIR Spectroscopy
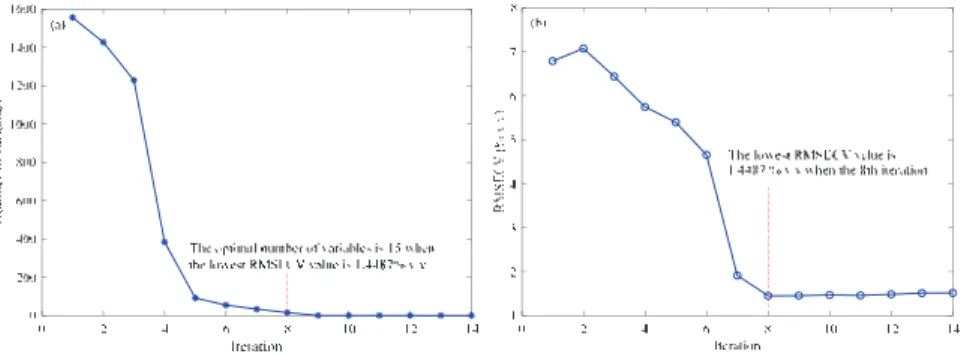
Figure 1 shows the evolution of variables and RMSECV values in each iteration of the submodels during the execution of the BOSS algorithm. Variable weights in the optimal submodel at the eighth iteration using the BOSS algorithm. Specifically, the submodels are obtained according to the weight of each variable using the BOSS algorithm.
Comparison of the variable importance in projection (VIP) and of the selectivity ratio (SR) methods for variable selection and interpretation.J.
Aquaphotomics—From Innovative Knowledge to Integrative Platform in Science and Technology
Introduction to Aquaphotomics
In other words, the molecular network of water changed when the composition of the water system was changed, and this was reflected in the spectral pattern of water. Changes in the spectrum of water accurately and sensitively reflect changes in water molecular species, hydrogen bonds, and charges of solute and solvent molecules. In this way, by knowing what each frequency means in terms of water structure, the absorption bands become like "letters" that can be used to describe the properties of water systems.
Through basic research, aquaphotomics gave new insight and a better understanding of the basic phenomena and the role of water.
![Figure 1. Water spectrum (double logarithmic plot), based on data from Segelstain [17].](https://thumb-ap.123doks.com/thumbv2/1libvncom/9201073.0/184.723.114.612.544.909/figure-water-spectrum-double-logarithmic-plot-based-segelstain.webp)
Water Spectrum as a Source of Information
When the first overtone of water (i.e. the aquaphotomic approach) was used to develop a quantification model for polystyrene particles in aqueous suspension, the measurements achieved high precision - even in the case of very low concentrations. Conventionally, only few symmetric and asymmetric stretching vibrational assignments of water molecules are known in the first overtone of water OH stretching vibrations (Figure 4). In the area of the first overtone of water, 12 water absorption bands corresponding to specific water molecular species were uncovered [5].
Two-dimensional correlation NIR spectroscopy and Gaussian fitting were adopted to investigate the variation of different aqueous species and sequences of changes in protein structure during gelation.

Aquaphotomics—Innovative Knowledge Leads to Innovative Applications
The applicability of the proposed concept was evaluated in water quality monitoring [65], food quality monitoring [66]. In this way, the dialysis efficiency can be evaluated in a simplified way by tracking the changes of the corresponding spectral pattern of the dialysis water. The mean values of the normalized absorbance values of the water matrix coordinates for each group are plotted on each wavelength axis [89].
It was confirmed that what is usually thought to be the first overtone of the C-H stretching mode is not.