JED No 222 October 20141 51
Monetary Transmission tlirough Interest Rate Channel in Vietnam Before and After the Crisis
TRAM T B I XUAN HUONG University of Economics HCMC - [email protected]
VO XUAN VINH
University of Economics HCMC - [email protected] NGUYEN PHUC CANH
University of Economics HCMC - [email protected]
ARTICLE INFO ABSTRACT Article history:
Received:
Feb 28,2014 Received in revised form Apr 17,2014 Accepted'
Sep, 30, 2014 Keywords.
monetary policy, monetary policy rates, market rate, transmission
The paper employs the VAR model to examine the impact of monetary policy on the economy through interest rate channel (!RC) and levels of transmission before and after the 2008 crisis. The results indicate that in the penod before the financial crisis, IRC exists in accordance with macroeconomic theory; however, the crisis period, m which increases In SBV monetary policy rates lead to increased inflation, has proved the existence of the cost channel of monetary transmission in Vietnam,
52 I TrSm Thj Xuan Huong, Vo Xuan Vinh & Nguyen Phiic Canh j 51 - 75
i. INTRODUCTION
1.1 Significance of the Study:
Monetary policy plays a crucial role in the economy. It affects macroeconomic variables through transmission channels, among which interest rate chaimel (IRC) is considered an important and traditional one for monetary policy. A study of monetary transmission through IRC as well as changes in the transmission process resulted from economic crisis could allow the SBV to make timely adjustments to its operating mechanisms in accordance with the reality.
In addition, the study contributes more empirical evidence to theoretical foundations on monetary transmission in such a small and open economy as Vietnam.
1.2 Subject Matter:
The study focuses on monetary policy and particularly IRC in monetary transmission in Vietnam between 2000 and July 2013. Furthermore, it clarifies the impact of the 2008 financial crisis on monetary transmission through IRC, including lending rate and deposit rate offered by Vietnam's commercial banks.
1.3 Research Objectives:
Based on the aforementioned issues, the study features the following objectives:
- Examining the existence of IRC in monetary transmission in Vietnam through lending rate and deposit rate offered by commercial banks, and
- Investigating the changes in monetary transmission through IRC before and after the crisis.
2. THEORETICAL BASES AND METHODOLOGY 2.1 Theoretical Bacliground:
Monetary policy refers to the actions taken by central banks to influence the money supply or interest rate of the economy (Lico Junior, 2008). With the aim of stabilizing price and promoting economic development, central banks employ such instruments of monetary policy as monetary policy rates, open market operations and required reserve ratio to exert influence on other economic variables. The process is termed as monetary transmission. Previous studies suggest that monetary transmission takes place through various channels, including interest rate chaimel, exchange rate channel, asset price channel, credit channel and expectation channel as the main ones (Mukheriee &
JED No.222 October 20141 53
Bhattacharya, 2011; Dabla-Norris & Floerkemeier, 2006; Mugume, 2011; Disyatat &
Vongsinsirikul, 2003; Ries, 2012; Honda, 2004; and others).
According to the Keynesian school of economics, IRC is the main transmission channel of monetary policy (Friedman, 1956), which is further confirmed by a study by Hannan & Liang (1993), demonstrating the existence of IRC in the U.S. The issue IS later discussed in such other studies as Taylor (1995) and Cecchetti (1995), substantiating the important role of IRC in monetary transmission. As explained in Keynesian theory, a change in monetary policy should lead to that in money supply, thereby changing the real interest rate and economic output (IS/LM model).
Increase in M ^>- Decrease in ir —* Increase in I —* Increase in Y Where:
M: money supply ir: real interest rate I: investment
Y: output
Although Keynes highlights the fact that firm's investment decisions is determined by real interest rates, decisions on consuming essential, durable goods by households and individuals are also affected by changes in real interest rates. Thus, the interest rate transmission channel of monetary policy is influenced by shocks related to firm's investment and personal consumption of essential durable goods in the private sector.
The importance in monetary transmission through IRC is related to real interest rate rather than nominal one since the former would affect decisions on corporate investment and personal consumption. In addition, interest rate in consideration is the long-term one because the short-term rate exerts little impact on the decisions on corporate investment and personal consumption of durable goods in the private sector, which depend on long-term cash flow and benefits. Then, why are short-term rates main targets of the central bank? This could be explained by the term strucmre of interest rates and sticky prices. Suppose the central bank wants to expand the money supply, It would reduce short-term rates (the short-term sticky prices always lead to changes in a long term only), and short-term nominal interest rate would decrease.
According to the theory of the term structure of interest rates, long-term interest rate IS the estimated future values of short-term ones; therefore, when the latter reduces, the
54 I Trim Thi Xuan Huong, Vo Xuan Vinh & Nguyin Phuc Canh | 51 - 75
former is expected to reduce accordingly (Buttiglone et al., 1997; Cook & Haln, 1989;
Evans & Marshall, 1998; Favero et al., 1996; Haldane & Read, 2000; Kuttner, 2001;
Lindberg et al., 1997; and other studies). Reduced long-term rates stimulate investment and consumption of durable goods, thereby increasing the aggregate demand and output.
However, a recent smdy by Mengesha & Holmes (2013) addresses an exception:
No evidence for the existence of IRC in Eritrea, an African low-income economy, is found. The reason is that the country's financial system has yet to develop, therefore the commercial banking system almost dominates all operations of the economy, allowing such a credit channel of commercial banks to be indispensable. In Eritrea, the main tool of monetary pohcy is required reserve ratio; Bank of Eritrea also employs treasury bills as an instrument. In addition, the rediscount rate is not used as a monetary policy instrument m Eritrea. Since the rediscount window is inoperative and both the lending and deposit rates are rigid, the interest rate channel is ineffective (Mengesha & Holmes, 2013). In some other countries such as Kenya, Uganda and Tanzania, the IRC does not play an important role in monetary transmission (Buigut, 2009), which also results from underdeveloped financial markets in these countries.
Ramlogan (2007) argues that monetary policy may affect various economic fields via interest rates and credit channels, and an effecfive transmission through IRC requires a developed financial market. In developed and highly competitive markets as in UK or the U.S., IRC is the most important channel (Engert et al., 1999; and Allen &
Gale, 2000, 2004), whereas in underdeveloped ones as in Trinidad Tibago, the credit channel is more important (Ramlogan, 2007). According to Romer & Romer (1990), the transmission through IRC requires two conditions:
First, all commercial banks lack ability to hedge against changes in their reserve capital caused by changes in monetary policy.
Second, no other type of asset would replace cash as the means of payment.
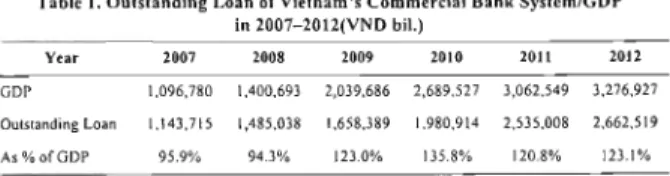
In Vietnam today, the stock market has yet to develop; its supply of capital to the economy is not significant enough. Meanwhile, the system of commercial banks plays a crucial role in facilitating fiows of capital while the outstanding loan compared to the GDP keeps growing over years (up to 123.1% by 2012) as illustrated in the following table:
JED No.222 October 20141 55
Table 1. Outstanding Loan of Vietnam's Commercial Bank System/GDP in 2007-2012(VND bii.)
Year 2007 2008 2009 2010 2011 2012
GDP 1,096,780 1,400,693 2,039,686 2,689,527 3,062,549 3,276,927 Outstanding Loan 1,143,715 1,485,038 1,658,389 1,980,914 2,535,008 2,662,519 As % of GDP 95.9% 94,3% 123.0% 135.8% 120,8% 123,1%
Source: ADB (2013), Vietnam Key Indicators.
In a d d i t i o n to that, V i e t n a m is an o p e n e c o n o m y w i t h h i g h d e m a n d for cash a n d annual g r o w t h of m o n e y s u p p l y is c o m m o n l y high e v e n t h o u g h it l e n d s to d e c r e a s e in 2011 a n d 2 0 1 2 .
Figure 1. Growth Rate of M2 in Vietnam in 2007 - 2012
50.00 45.00 40.00 55.00 30.00 i.-^.oo 20.00 15.00 10.00 5.00
Source: ADB (2013), Vietnam Key Indicators.
A c c o r d i n g l y , m a c r o e c o n o m i c c o n d i t i o n s s h o w t h a t I R C c a n e x i s t a n d act as an i m p o r t a n t t r a n s m i s s i o n c h a n n e l o f m o n e t a r y p o l i c y . O n s u c h b a s i s , t h e r e s e a r c h c o n c e r n s t h e t r a n s m i s s i o n c h a n n e l t h r o u g h m a r k e t rates ( l e n d i n g a n d b o r r o w i n g rates) offered b y c o m m e r c i a l b a n k s a n d fiirther e v a l u a t e s t h e i m p a c t of financial crisis on the t r a n s m i s s i o n t h r o u g h I R C , p h a s e d o v e r the t w o p e r i o d s : 2 0 0 0 - 2 0 0 7 (before t h e crisis) and 2 0 0 8 - 2 0 1 3 (after t h e crisis).
2.2 Data and Methodology:
56 I T r i n Thi Xuan Huong, Vo Xuan Vmh & Nguyen Phiic Canh | 51 - 75
Research model:
The VAR (Vector Autoregression) model introduced by Sims (1980) is widely applied by macroeconomists to quantify the dynamic response of a group of macroeconomic variables without demanding powerful conditions to idenfify macro shocks. VAR model then became one of the most common models to be apphed to time series data. VAR model is used to measure the dependence and linear correlations between various vanables of time series data, especially m measuring interacfions between macro variables of time series data since such macroeconomic data, according to Sims (1980), have the following characteristics:
- Macroeconomic factors often come up with autocorrelation; thus, values of previous periods tend to affect those of current ones. The autocorrelation usually makes macro variables flucmate and have some lag orders.
- Macro variables of^en interact in a network model, i.e. all variables interact with one another m the form of network; therefore, any macro variable can be affected by the others and vice versa.
A change in monetary policy influences market rate and subsequently, other variables in the economy; however, as responses of the variables to the policy-related shocks are different, it is important that levels as well as length of the responses be well clarified. Additionally, researchers may need to predict future variance of the studied variables to adequately demonstrate the impacts of shocks on the predicted future variance of the variable and offer control solutions. VAR model provides two tools for dealing with the issue: Impulse response flmction (IRF) helps measure the degree of response as well as lag order of the response of the smdied variable to shocks in other variables, and variance decomposition supports the analysis of contribution from factors to prediction of variation of variance of future studied variables.
To examine the transmission mechanism of monetary policy through IRC in Vietnam, the VAR (Vector AutoRegression) model applied by Bemanke & Blinder (1992), Sims (1980, 1992) and many others is employed m this study. Specifically, when the monetary pohcy produces impacts through the interest rate channel, such impacts will be transmitted from monetary policy rates to lending and borrowing rates.
VAR features the following form:
y, = B(L)y, + u, (})
JED No.222 October 20141 57
where: yi is a vector n x 1 of economic variables, including the following variables in order: VNIBOR (inter-bank average interest rate - SBV), LER (average lending rate of commercial banks - SBV) or DER (average deposit rate of commercial banks - SBV), CPI (consumer price index - IMF); B(L) is structure matrix of lagged variables to k; and Ut is vector n x 1 of errors.
However, policy rate and market rate often respond in the same direction, thereby being possibly comtegrated, Stationarity and cointegrafion are tested to figure out whether the data are suitable for VAR model. If the latter exists, VECM model is employed instead of VAR. According to Friedman (1956), an increase in policy rate will bring about that in market rate (including borrowing and lending rates of commercial banks) and transmission reduces investment and inflation accordingly. In brief, the expected relationship between monetary policy rates and market rates is positive and between these and the one with infiation is negative.
Data:
The data are collected from SBV (inter-bank average rate) and GSO (CPI) and IMF (average lending rate and average borrowing rate) from January 2000 to July 2013, Regarding policy interest rates, there are three types in Vietnam: inter-bank average rate (VNIBOR), refinancing rate and rediscount rate; however, the second and third types are not efficient while operations in inter-bank market is the main channel in implementing the monetary policy. Therefore, the first type is employed by the authors of this study in the context of Vietnam as a representative of monetary policy rates.
This practice is very common among many central banks in the world (Disyatat &
Vongsinsirikul, 2003).
Applying VAR model to the two periods (before and after the crisis), the authors collected monthly data and investigate the monetary transmission in Vietnam through lending and borrowing rates of commercial banks to inflation.
Data is described statistically in Table 2.
Table 2. Statistical Description of Data
Variable/Criterion VNIBOR LER DER CPI January 2000 - December 2007
Mean 6.730625 10.20292 6.308229 4.581431 Median 6.855000 10,20000 6 540000 4,501648
58 I Tram Thj Xuan Huong, Vo Xuan Vinh & Nguyen Phuc Canh | 51 - 75
Max Min Standard deviation Skewness Kurtosis Jarque-Bera P-value Obs.
8.740000 11 40000 7.680000 12.54776 5.180000 8.460000 3.540000 -2.739748 0.771388 0 902285 1271599 3.959221 -0.211485 -0.296374 -0.942552 -0.314421 2.574286 1.743131 2 901517 1.920458 1.440545 7.724278 14.25327 6.243411 0.486620 0.021023 0.000803 0.044082 96 96 96 96 January 2008 - July 2013
Mean Median Max Min Standard deviation Skewness Kurtosis Jarque-Bera P-value Obs.
9 912090 8.900000 17 57000 3 620000 3,385513 0.294703 2 268128 2.465140 0.291542 67
14.80551 14.60000 20.25000 10.07000 2.795319 0.135555 2-029339 2.835452 0.242264 67
10 47895 10.85000 17.16000 6.540000 2.635734 0.619814 3.006548 4.290009 0.117068 67
12.64978 10.52070 28.35694 -5.830000 7.662913 0.367557 2 364152 2.637276 0.267499 67 Source: Authors' calculations
T h e v a l u e s o f m o n e t a r y p o l i c y r a t e s , l e n d i n g r a t e , b o r r o w i n g r a t e a n d inflation after t h e crisis a r e all h i g h e r than t h o s e b e f o r e t h e c r i s i s .
D e s c r i p t i o n o f t h e test for t h e s t a t i o n a r i t y o f t h e d a t a is i l l u s t r a t e d in T a b l e 3.
JED No.222 October 2014] 59
T a b l e 3 . U n i t R o o t T e s t s on t h e D a t a s e t Dickey - Fuller unit root
(est (zero-order)
Dickey - Fuller unit root test (first-order) T - statistic P - value
January 2000 - December 2007
VNIBOR -3,004489 0.0380 LER -1.001428 0.7503 DER -2,089629 0.2493 CPI -0.426920 0.8991
Zero-order stationary -8 956079 0,0000 First-order stationary -8,844660 0,0000 First-order stationary -5,015976 0,0001 First-order stationary January 2 0 0 8 - J u l y 2013
VNIBOR -1.732664 0 4 1 0 4 LER -2,638637 0.0906 DER -2.974987 0.0426 CPI -i.480353 0,5374
-9-811286 0.0000 First-order stationary -5,416370 0.0000 First-order stationary Zero-order stationary -3 947427 0.0033 First-order stationary Source- Results collected from Eviews 6-
T h e r e s u l t s o f unit root tests s h o w that t h e v a r i a b l e s h a v e different o r d e r o f stationarity; t h e r e f o r e , the difference o f v a r i a b l e s t h a t are first-order s t a t i o n a r y is n e e d e d w h i l e o t h e r v a r i a b l e s that a r e z e r o - o r d e r s t a t i o n a r y a r e k e p t intact a n d V A R m o d e l is a p p l i e d . N e w s y m b o l s for t h e v a r i a b l e s a n d d a t a p r o c e s s i n g a r e p r e s e n t e d in T a b l e 4.
T a b l e 4 . D a t a P r o c e s s i n g f o r V A R M o d e l
Variable Conclusion Process New symbol
January 2000 - December 2007
VNIBOR Zero-order stationary Intact VNIBOR LER First-order stationary First-order difference DLER
DER First-order stationary First-order difference DDER CPI First-order stationary Firsi-order difference DCP!
Januaiy 2008 - July 2013
60 I Tr^m Thj Xuan Huong, Vo Xuan Vinh & Nguyen Phuc Canh | 51 - 75
VNIBOR LER DER CPI
First-order stationary First-order difference DVNIBOR First-order stationary First-order difference DLER
Zero-order staUonary Intact CDER First-order stationary First-order difference DCPI
Source: Authors' calculations from Eviews 6.
To determine the relationships between the variables before including them in the VAR model, Granger causality test is conducted with results presented in Table 5.
Table 5: Results of Granger Causality Tests HO,: VNIBOR does not Granger-
cause other variables
HO2: Variables do not Granger- cause DCPI
p-value p-value
January 2000 - December 2007 DLER
DDER DCPI January DLER DER DCPI
200s-
2.94829 6 25726 1.23021 - July 2013
0 87670 2.11642 1.31874
0 0249 0.0002 0 3045
0.5077 0.0787 0.2714
2.82251 1.55300
2.73097 1.19360
0.0301 0 1947
0.0365 0.3258
Source: Authors' calculations with Eviews 6.
The results of the Granger causality tests indicates that on the one hand, m the period before the crisis, VNIBOR exerts a significantiy strong impact on lending and borrowing rates but does not affect CPI. Of lending and borrowing rates, only the former affects inflation. On the other hand, after the crisis (2008 - July 2013), monetary policy rates affect the borrowing rate, whereas the latter does not affect inflation anymore. In the next section, VAR model is used for testing and clarifying this fact.
3. RESULTS AND DISCUSSION
3.1 VAR Model Applied to tbe Period Before the Crisis:
JED No.222 October 20141 61
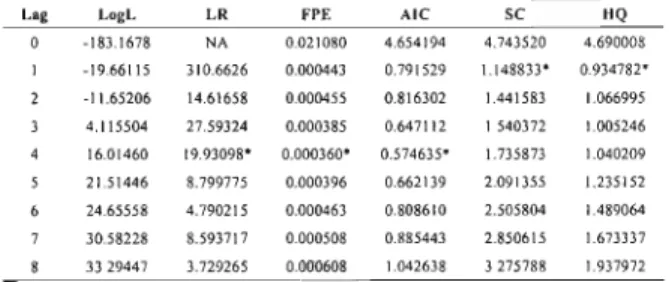
Lag order of monthly data from January 2000 to December 2007 is tested according to Lag Length Criteria prepared by Eviews 6 and the appropriate lag order of 4 is found.
Table 6. Selection of Lag Order Criteria for VAR Model with DLER
Lag 0 1 2 3 4 5 6 7 8
LogL -183.1678 -19.66115 -11.65206 4.115504 16.01460 21.51446 24.65558 30.58228 33 29447
L R NA 310.6626 14.61658 27.59324 19.93098*
8.799775 4.790215 8.593717 3.729265
FPE 0.021080 0.000443 0.000455 0.000385 0.000360*
0.000396 0.000463 0.000508 0.000608
* indicates lag order selected by the criterion
Lag 0 1 2 3 4 5 6 7 8
LogL -185.3672 -1.777916 3.921797 14.37728 24.96501 31.18298 42.19385 49.96637 57.27016
L R NA 348.8196 10.40198 18.29709 17 73446*
9.948744 16.79159 11.27014 10.04271
AIC 4.654194 0.791529 0.816302 0.647112 0.574635*
0.662139 0.808610 0.885443 1.042638
M o d e l w i t h D D E R FPE 0 022271 0.000283*
0.000308 0 000298 0.000288 0.000311 0.000299 0.000313 0.000334
AIC 4.709179 0 344448*
0.426955 0.390568 0.350875 0.420426 0.370154 0.400841 0.443246
SC 4.743520 1.148833*
1.441583 1 540372 1.735873 2.091355 2.505804 2.850615 3 275788
SC 4.798505 0.701752*
1.052237 1.283828 1.512113 1.849642 2.067348 2.366013 2.676396
HQ 4.690008 0.934782*
1.066995 1.005246 1.040209 1.235152 1.489064 1.673337 1.937972
HQ 4.744992 0 487701*
0.677649 0.748702 0.816448 0.993439 1.050607 1.188735 1 338580 Source. Authors' calculations employing Eviews 6
62 I Tram Thi Xuan Hu-ong, Vo Xuan Vmh & Nguyen Phiic Canh | 51 - 75
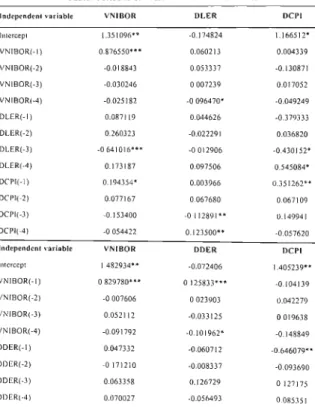
Model VAR (4) applied to lending rate and borrowing rate m following results:
Table 7. Results of VAR with DLER and DDER Independent variable
liitercepi VNlBOR(-l) V N l B 0 R ( - 2 ) VNlB0R{-3) V N l B 0 R ( - 4 ) DLER(-l) DLER(-2) DLER(-3) DLER(-4) DCPl(-I) DCPl(-2) DCPl(-3) DCPI(-4) Independent variable Intercept V N l B O R ( - l ) V N l B 0 R ( - 2 ) V N l B 0 R ( - 3 ) V N l B 0 R ( - 4 ) D D E R ( - l ) D D E R ( - 2 ) D D E R ( - 3 ) D D E R ( - 4 )
VNIBOR
1.351096**
0.876550***
-0.018843 -0.030246 -0.025182 0.087119 0.260323 -0 641016***
0.173187 0.194354*
0.077167 -0.153400 -0 054422 VNIBOR 1 482934**
0 829780***
-0 007606 0.052112 -0.091792 0.047332 -0 171210 0.063358 0.070027
DLER
-0.174824 0.060213 0.053337 0 007239 -0 096470*
0.044626 -0.022291 -0 012905 0.097506 0.003966 0.067680 -0 112891**
0.123500**
DDER -0.072406 0 125833***
0 023903 -0.033125 -0.101962*
-0.060712 -0.008337 0.126729 -0.056493
DCPI
1.166512*
0.004339
•0.130871 0.017052 -0.049249 -0.379333 0.036820 -0.430152*
0.545084*
0.351262**
0.067109 0.149941 -0.057620 DCPI
1.405239**
-0.104139 0.042279 0 019638 -0.148849 -0.646079**
-0.093690 0 127175 0.085351
JED No 222 October 2014| 6 3
DCPl(-l) DCPl(-2) DCPl(-3) DCPl(-4)
0137060 0 149926 -0 125429 -0.084651
-0 034447 0.008361 0.100865*
-0 028436
0.306412**
0.112880 0.096483 -0.012423
*, **, and *** denote significance at 10%, 5%, and 1% respectively Source: Results from Eviews 6.
T h e results yieWed b y V A R t n o d e l s u g g e s t that a v e r a g e i n t e r - b a n k rate h a s ititpact on b o r r o w i n g a n d l e n d i n g r a t e s , w h e r e a s b o r r o w i n g rate affects inflation. A stability test for t h e t w o m o d e l s s h o w s t h a t t h e y satisfy t h e stability c o n d i t i o n .
T a b l e 8. A R R o o t T e s t s
Root of VAR Model with DLER Modulus
0.832843 0.637952 - 0.4238981 0.637952 H-0.4238981
-0.757095 0 . 0 2 7 7 1 9 - 0 7522621 0.027719 + 0.7522621 -0.406720 • 0.6298491 -0.406720 -I- 0.6298491 0 601209-0.1826881 0.601209 + 0.1826881
-0 390302 -0.133328
0.832843 0.765946 0.765946 0.757095 0.752773 0.752773 0.749754 0.749754 0.628353 0.628353 0.390302 0.133328
Root ot VAR Model with DDER Modulus
0.766866 0.657885 - 0.206016]
0 657885 + 0 2060161
0.766866 0.689388 0.689388
64 [ Trdm Thi Xuan Hirong, Vo Xuan Vinh & Nguyin Philc Canh | 51 - 75
-0.388646-0 5421451 -0.388646 + 0.5421451 0.508407 - 0.4262891 0.508407 + 0 4262891 -0.435167-0 3718951 -0.435167 + 0 3718951 -0.048309 - 0.4548461 -0.048309 + 0.4548461
-0.279729
0.667058 0.667058 0.663475 0.663475 0.572430 0 572430 0.457404 0.457404 0.279729 No root lies outside the unit circle, VAR model satisfies the stability condition Source: Results from Eviews 6
T h e L M T e s t o n V A R m o d e l indicates that t h e m o d e l n o l o n g e r reveals a u t o c o r r e l a t i o n , t h e r e f o r e it is c o n s i d e r e d a p p r o p r i a t e .
Table 9. LM Tests on VAR Model Model with DLER Lags
1 2 3
LM-Stat 6.318360 7.681186 3 916581 4.121039 10.07112 9.849230 4.845651 11.69143 9.207662 11.21679 6.336638
Prob 0.7077 0.5666 0.9168 0.9033 0.3448 0.3628 0.8476 0.2313 0.4183 0.2611 0.7058
JED No.222 October 20141 65
12 9.477654 0.3944
Model with DDER
Lags LM-Stat Prob
9 436887 10.37316 13.48707 8.144409 12.47927 19.31205 8.576477 10 80499 8.053794 4.451709 5.263013 4.969552
0.3980 0.3211 0.1418 0 5197 0.1876 0 0227 0 4773 0.2893 0.5287 0.8793 0.8108 0.8370 Source: Results from Eviews 6.
A p p l y i n g t h e i m p u l s e r e s p o n s e function to test m o n e t a r y t r a n s m i s s i o n t h r o u g h I R C to inflation y i e l d s r e s u l t s for D L E R a n d D D E R , illustrated in F i g u r e s 2 a n d 3 respectively.
66 I Trim Thj Xuan Huong, Vo Xuan Vinh & Nguyen Phuc Canh | 51 - 75
Figure 2. Impulse Response Function for VAR with DLER
Response to CtiolBSl<y One S.D. Innovations ± 2 S.E.
Response of DL6R lo VNIBOR Ro.pon.o ot DLER to DLER
7^.
2 3 A. S 6 7 8 9 1C
Source' IRF Results from Eviews 6.
The results of impulse response function suggest that lending rate responds positively to the shock caused by increases in monetary policy rates (namely VNIBOR) and with the lag of one month, which reflects the role played by IRC in monetary transmission in Vietnam before the crisis. In contrast, inflation has an immediate response to the shock caused by a higher lending rate and a two-month lagged response to the monetary policy rates. Thus, it can be concluded that in Vietnam, IRC exists in the period before the crisis through lending rate. An increase in
JED No.222 October 20141 67
monetary policy rates will boost lending rate and control inflation, and the transmission from policy rates to lending rate experiences a lag length of one month and a two-month lag to inflation. The transmission process, however, ends after a lapse of five months.
Figure 3. Impulse Response Function for VAR with DDER
3 O h o l s s k y O n s •-D. I n n o v s U o n s ± 2 S . E
yy^
--'"
— - - C >
to VNIBOR
r ^ a 10
Source- IRF Results from Eviews 6.
Through borrowing rate channel, monetary transmission transpires faster, and response of inflation is similar to that to the lending rate channel. Yet, the process would be faster and end more quickly when response from CPI stops in the fourth month.
Accordingly, before the crisis, IRC exists in both lending and borrowing rates, whereas the response of borrowing rate takes place and ceases faster than that from lending rate. To examine IRC after the crisis, VAR is applied to the dataset from January 2008 to December 2010, the results of which is presented in the next section.
68 I Tram Thi Xuan Huong, V6 Xuan Vinh & Nguyen Phuc Canh [ 51 - 75
3.2 VAR Model Applied to the Period after the Crisis:
A test of lag criteria reveals that a lag order of 2 is appropriate.
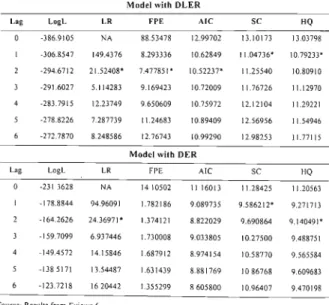
Table 10. Selection of Lag Criteria for VAR Model with DLER
Lag 0 1 2 3 4 5 6
L o g L -386.9105 -306.8547 -294.6712 -291.6027 -283.7915 -278.8226 -272.7870
LR NA 149.4376 21.52408*
5.114283 12.23749 7.287739 8.248586
FPE
88.53478 8.293336 7.477851*
9.169423 9.650609 11.24683 12.76743
AIC
12.99702 10.62849 10.52237*
10.72009 10.75972 10.89409 10.99290
SC 13.10173 11.04736*
11.25540 11.76726 12.12104 12.56956 12.98253
HQ
13.03798 10.79233*
10.80910 11.12970 11.29221 11.54946 11.77115 Model with D E R
Lag 0 1 2 3 4 5 6
LogL -231 3628 -178.8844 -164.2626 -159.7099 -149.4572 -138 5171 -123.7218
LR NA 94.96091 24.36971*
6.937446 14.15846 13.54487 16 20442
FPE 14 10502 1.782186 1.374121 1.730008 1.687912 1.631439 1.355299
AIC 11 16013 9.089735 8.822029 9.033805 8.974154 8.881769 8 605800
SC 11.28425 9.586212*
9.690864 10.27500 10.58770 10 86768 10.96407
HQ
11.20563 9.271713 9.140491*
9.488751 9.565584 9.609683 9.470198 Source: Results from Eviews 6.
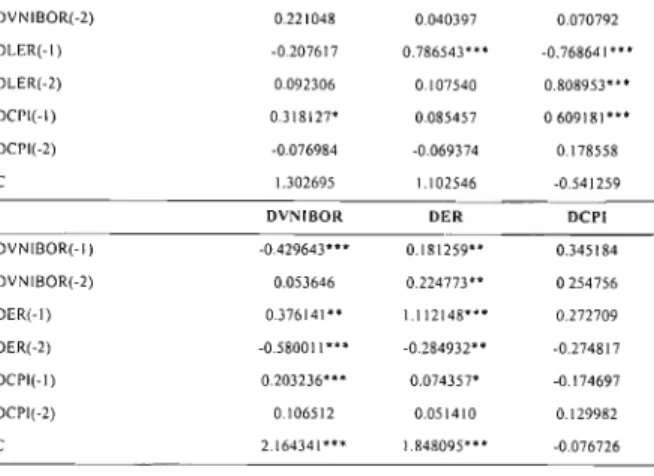
VAR(2) is designed for DLER and DER in the period 2008-2013 with the results illustrated in Table 11.
Table 11. Results of VAR Model for DLER and DER Independent variable
DVNIBOR{-I)
JED No.222 October 20141 69
DVNIB0R(-2) DLER(-l) DLER(-2) DCPl(-l) DCPl(-2) C
0.221048 -0.207617 0.092306 0.318127*
-0.076984 1.302695
0.040397 0.786543***
0.107540 0.085457 -0.069374 1.102546
0.070792 -0.768641***
0.808953***
0 609181***
0.178558 -0.541259
DVNIBOR DER DCPI
DVNlBOR(-l) DVNlB0R(-2) DER(-l) DER(-2) DCPI(-l) DCP](-2) C
-0.429643**' 0.053646 0 . 3 7 6 1 4 1 "
-0.580011**"
0.203236***
0.106512 2.164341***
0.181259**
0.224773**
1.112148***
-0.284932**
0.074357*
0.051410 1.848095***
0.345184 0 254756 0.272709 -0.274817 -0.174697 0.129982 -0.076726
*, **, and •** denote significance at 10%, 5%, and 1% respectively Source: Results from Eviews 6.
The results of the AR root tests for stability of the model shows that both models satisfy stability requirement.
Table 12. Tests of the Models' Stability
Root of VAR with DLER Modulus
0.927041 0.847907 -0.610904 0.356204 -0.181967-0.2154151 -0.181967 + 0.2154151
0.927041 0.847907 0.610904 0.356204 0.281985 0.281985 No root lies outside the unit circle, this VAR model satisfies the stability condition
70 1 Trjm Thi Xuan Huong, Vo Xuan Vmh & Nguyin Phuc Canh [ 5 1 - 7 5
Root ofVAR with DLER 0.808123-0.3006601 0.808123+0 3006601 -0 397010-0.2174441 -0.397010 + 0.2174441
-0 449757 0.135340
0 862241 0.862241 0 452658 0.452658 0.449757 0.135340 No root lies outside the unit circle, this VAR model saosfies the stability condition Source- Results from Eviews 6.
T h e L M test o n a u t o c o r r e l a t i o n s u g g e s t s that e a c h V A R m o d e l is appropriate b e c a u s e n o further a u t o c o n ' e l a t i o n ts found.
T a b l e 13. L M T e s t s for V A R M o d e l M o d e l w i t h D L E R
LM-Stat Prob
14 15657 8 764308 6 932171 14.61168 9.131839 9.864631 12.62929 12 75983
0.1169 0.4593 0.6442 0.1022 0.4252 0.3616 0.1801 0.1738 M o d e l w i t h D E R Lags
11.36865 11.29732
0.2513 0.2559
JED No.222 October 2014| 7 1
5.665168 8.880593 7.967176 7.414719 7.309952 4.334793
0 7729 0.4484 0.5375 0 5940 0 6049 0 8880 Source. Results from Eviews 6.
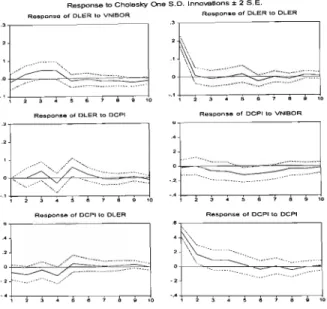
Impulse response function is applied successively to VAR with DLER and DER, the results are presented in Figure 4 and 5 respectively.
Figure 4. Results of Impulse Response Function for VAR with DLER
ResiXHiBaloCholeskyOnsS 0 lnnovBtions±ZS E
Ass
• ^
\::::
.''
« . . . ™ . . . = L m . o m
^ V'
l . . . ^ . . « Q
-—
n.OLIR
Source: Results from Eviews 6.
The results obtained from the period 2008-2013 are different from those from 2000-2007. In this period, lending rate responds vigorously to shocks of increases in monetary policy rates and tends not to cease, whereas inflation responds positively to monetary policy rates but negatively to lending rate in a short term. In other words.
72 I Trim Thi Xuan Huong. Vo Xuan Vinh & Nguygn Phuc Canh | 51 - 75
shock-generating increases in monetary policy rates lead to short-term increases in market rates and falls in inflation rate. This reflects a short-term existence of IRC during the crisis. Long-term increases in inflation along with increases in monetaiy policy rates might be subject to the cost channel in monetary transmission. Regarding borrowing rates offered by commercial banks, the impulse respond function produces the following results.
Figure 5. Results of Impulse Response Function for VAR with DER
Source: Results from Eviews 6
The IRC reflected in borrowing rates in the period 2008-2013 also reveals some results partly similar to and partly different from result produced by the IRC in the lending rate channel, which implies that inflation positively responds to shock- generating increases in monetary policy rates and gradually descends until a cessation in the sixth term. On the other hand, borrowing rate forcefully responds to shock in monetary policy rates but fades in a long mn.
In sum, IRC changed quite dramatically after the crisis in comparison with that before the crisis. It also accompanies cost channel in monetary transmission (increased mierest rate leads to increased inflation).
JED No.222 October 2014| 73
4. CONCLUSION AND POLICY RECOMMENDATION 4.1 Conclusion:
The VAR model shows that:
- Before the crisis, IRC exists in accordance with the theory in the context of Vietnam through both lending and borrowing rates by commercial banks Inflation decreases when monetary policy rates increase. Monetary transmission though IRC takes place quickly and ceases after around five months.
After the crisis, monetary policy rates are no longer transmitted significantly through lending and borrowing rates as theoretically suggested When shock- generating increases in monetary policy rates take place, both lending and borrowing rates increase, whereas inflation also even increases instead of decreasing. Hence, increased monetary policy rates results in increased inflation, which indicates that the cost channel in monetary policy exists in the period 2008-2013 Study by Tillmann (2008) concerning the new-Keynesian Phillips curve suggests that higher interest rates increase the marginal cost of production and inflation in Britain, Other smdies also confirm that monetary policy affects demand side of the economy by changing the real rates thereby affecting investment and consumption in all sectors; while Barth &
Ramey (2001) considers the effect on the supply side or cost channel of transmission mechanism. By such, the authors recommend an expansion of this research in the future to clarify the cost channel in monetary transmission in Vietnam.
4.2 Policy Recommendation:
From the above research results, in order that monetary policy in Vietnam can be well implemented to achieve the set goals especially in the current period, these following issues should be taken into account:
Interest rate policy affects borrowing and lending rates of commercial bank system after the crisis although it is not transmitted as vigorously as it was before and comes up with a certain lag. Therefore, the SBV, in regulating and changing interest rate policy, should anticipate the impact of monetary policy shocks on market rates and depositors and borrowers. During the crisis when increased policy rates causes market rates and production cost to rise, the SBV, instead of raising interest rates, should stabilize monetary policy rates, which will yield better effects.
However, in the present context, interest rates tend to drop for credit growth; SBV should frequently control the market rates when setting borrowing rate ceiling to
74 I Trim Thi Xuan Huong, Vo Xuan Vinh & Nguyen Phuc Canh | 51 - 75
m i n i m i z e t h e risk of reflation. B e t w e e n 2 0 1 1 a n d 2 0 1 3 , i n t e r e s t rates w e r e lowered lo help firms a c c e s s b a n k loans. In s u c h c o n d i t i o n s , t h e S B V s h o u l d h a v e controlled lending a n d b o r r o w i n g rates in c o m p l i a n c e w i t h m o n e t a r y p o l i c y to a v o i d adverse responses and g u a r a n t e e a d r o p in t h e s e rates as well as finus' i n p u t c o s t s , thereby stimulating p r o d u c t i o n in the e c o n o m y *
R e f e r e n c e s
Allen, F. & D. Gale (2000), Comparing Financial Systems. The MIT Press.
Allen, F. & D. Gale (2004), "Comparative Financial Systems: A Discussion", in Bhattacharya S., A, Boot & A. Thakor (2004) (eds.). Credit. Intermediation, and llie Macroeconomy Models and Perspectives. Oxford University Press, Oxford, New York, 699-770.
Baith, M.J & V A Ramey (2001),'The Cost Channel of Monetary Transmission", m Bemanke, B, &
K Rogoff (Eds.), NBER Macroeconomics Annual, 16: 199-240.
Bemanke, B.S. & A.S. Blinder (1992), "The Federal Funds Rate and the Channels of Monetary Transmission", American Economic Review, 82: 901-921.
Buigut, S (2009), "Monetaiy Policy Transmission Mechanism: Implications for the Proposed East African Community (EAC) Monetary Union" available ai
<http://www.csae.ox.ac,uk/conferences/2009-EDiA/papers/300-Buigut pdf, remeved on October 2i,2013>
Buniglone, L., P, DelGiovane & 0 , Tristani (1997), "Monetary Policy Actions and the Term Structure of Interest Rates. A Cross-Country Analysis", in Angeloni, I. & R Rovelli (ed.), Monetary Policy and Interest Rates, New York, St Martm Press.
Ceccheiti, S. (1995), "'Dislinguishing Theories of the Monetary Transmission Mechanism. Review", Federal Reserve Bank oJ St Louis, 77: 83-97.
Cook, T & T. Hahn (1989), "The Effect of Changes in the Federal Funds Rate Target on Market Interest Rates in the 1970s", Journal of Monetary Economics. 24, 331-351.
Dabla-Noms, E. & H Floerkemeier (2006), "Transmission Mechanisms of Monetary Policy in Armenia- Evidence from VAR Analysis", IMF Working Paper (WP/06/248), Issue Washington, DC.
Disyatat. ^ , ? Vongsinsirikul (2003), "Monetary Policy and the Transmission Mechanism m Thaihnd", Journal of A.-iian Economics. 14: 389-418.
Engert, W., F.L. Non & J. Selody (1999), "RestmcUiring the Canadian Financial System: Explanations and Implications", in The Monetary and Regulatory Implications of Changes in the Banking Industry, Basle' Bank for Intemat. Settlements, ISBN 9291310964, 142-167.
Evans. C. & D Marshall (1998), "Monetary Policy and the Term Stmcture of Nominal Interest Rates:
Evidence and Theory", Carnegie-Rochester Conference Series on Public Policy. 49: 53-111.
Favero, C , F. iacone & M Pifferi (1996),"Monetary Policy, Forward Rates and Long Rates. Does Germany Differ from the Unites States''", CEPR Working Paper No. 1456.
JED No.222 October 20141 75
Friedman, M. (1956), "The Quality Theory of Money. A Restatement", m Friedman, M. (1956).
Studies in the Quantity Theory of Money. Chicago University Press, Chicago.
Haidane. A. & V. Read (2000), "Monetary Policy Surprises and the Yield Curve", Working Paper No,l06. Bank of England
Hannan, T.H. & J.N. Liang (1993), "Inferring Market Power from Time-series Data. The Case of the Banking Firm", International Journal of Industrial Organization, 11(2)- 205-218.
Honda, Y. (2004), "Bank Capital Regulations and the Transmission Mechanism", Journal of Policy Modeling Vol.26 (6): 675-688.
K-Uttncr, K. (2001), "Monetary Policy Surprises and Interest Rates: Evidence from the Fed Funds Future Market". Journal of Monetary Economics. 47: 523-544.
Lico Junior, R dc Paula (2008), Dictionaiy of Financial and Business Terms, V ed., McGraw-Hill.
Lindberg, H., K. Mitlid & P. Scllin (1997), "Monetary Tactics with an Inflation Target, The Swedish Case", BIS Conference Papers - Implementation and Tactics of Monetary Policy Bank for International Seltlemenls. Basle. 3: 231-249.
Mengesha , L. & M. Holmes (2013), "Monetary Policy and its Transmission Mechanisms in Eritrea", Journal of Policy Modeling, 35(5): 766-780.
Mugume, A. (2011), "Monetaiy Transmission Mechanisms in Uganda", The Bank of Uganda Journal, 4(1): 3-57
Mukherjec. S. &, R. Bhattacharya (2011), "Inflation Targeting and Monetary Policy Transmission Mechanisms in Emerging Market Economies", IMF Working Paper (WP/11/229)
Ramlogan, C (2007), "Mechanism of Monetary Policy in Small Developing Countries: An Application XoTx'mxdad andloh^go", Journal of Developing Areas. 41- 79-91
Ries, W. (2012), "Do Credit Channel and Interest Rate Channel Play Important Role in Monetary Transmission Mechanism in Indonesia''' A Structural Vector Autoregression Mode", Procedia - Social and Behavioral Sciences, 65' 557-563.
Romer, C. & D. Romer (1990), "New Evidence on the Monetary Transmission Mechanism", Brookings Papers on Economic Activity. (1). 149-198.
Sims, C. (1980), "Macrococonomics and Ke?L\\Xy", Econometrica. 48: 1-48.
Sims, C, (1992), "inteipreting the Macroeconomic Time-Series Facts- The Effects of Monetary Policy", European Economic Review. 36: 975-1011.
Taylor, J. (1995), "The Monetary Transmission Mechanism: An Empirical Framework", Jowni.^/o/
Economic Perspectives, 9(4): 11-26.
Tillmann. P. (2008), "Do Interest Rates Drive Inflation Dynamics? An Analysis of the Cost Channel oi Monexary lr&nsvn\ss\on". Journal of Economic Dynamics & Control. 32. 2723-2744