Professor Steve Sparks is a volcanologist at the University of Bristol and joint leader of the Global Volcano Model (GVM). See www.cambridge.org/volcano for Appendix B which includes a brief discussion of the global distribution of volcanic risk and hazard and individual volcanism profiles for all countries and regions.
Introduction
Background
Volcanic disturbances can provide early warning to scientists at volcanic observatories if there is a good monitoring network (Phillipson et al., 2013) [Chapters 15 and 18]. If the research had been done first, an outbreak might have been expected (e.g. Lara et al. 2013).
Volcanoes in space and time
The estimates are based on a statistical analysis of data from VOTW4.22 and the Large Magnitude Explosive Volcanic Eruptions database (LaMEVE) version 2 (http://www.bgs.ac.uk/vogripa/) (Crosweller et al., 2012) ). The analysis method takes into account the decline of event reporting back in time (Deligne et al., 2010).
Volcanic hazards and their impacts
Pyroclastic density currents are responsible for a third of all historical volcanic fatalities (Auker et al. 2013). Lightning strikes occur during explosive eruptions in volcanic ash clouds and have resulted in a number of fatalities (Auker et al., 2013).
Monitoring and forecasting .1 Monitoring
Forecasting and early warning
Short-term forecasting and recognition of the highly dynamic nature of risk is essential for rapid response measures such as evacuation. Long-term predictions of the probability of volcanic activity over a period of time (eg, 100 years) can be extremely useful for mitigation measures such as land-use planning.
Assessing volcanic hazards and risk
- Hazards assessments and maps
- Exposure and vulnerability
- Volcanic risk
- A new global assessment of volcanic threat
- Distribution of volcanic threat between countries
The measure can also be calculated by region to give a broader picture of the global distribution of volcanic hazard (see Chapter 23). This measure is independent of the size of the country, so the number of volcanoes and the number of exposed population are not included in the calculation.
Volcanic emergencies and disaster risk reduction
Such methods can also be used retrospectively to examine decision-making in the past, for example the controversial evacuations in Guadeloupe (Hincks et al., 2014) in 1976, which in fact could have been justified. Tourists often come to volcanic areas because of the volcanoes (Bird et al., 2010) and need appropriate information about the potential hazards, impacts and appropriate response to warnings.
The way forward
Those volcanoes shown to be poorly known with major knowledge gaps regarding
Probabilistic assessment of hazard and risk that fully characterises uncertainty is becoming mandatory to inform robust decision-making. Assessments and forecasts are typically
Global databases can serve as references for local scientists, providing analogue data and distributions of likely eruption parameters. Creation and maintenance of global databases
Forensic assessments of volcanic hazards, their impact and risk drivers are needed during and after eruptions. Such studies are essential to improve knowledge of hazards and
Risks from volcanic ash fall associated with a particular volcano or region can be characterised by detailed probabilistic modelling, taking into account the range of physical
All of these measures can help minimize losses, increase societal resilience and ensure long-term success. Funding for the purchase of equipment should be complemented by support for scientific monitoring, training and development of personnel and long-term maintenance of equipment.
Volcanoes identified as high-risk should ideally be monitored by a combination of complementary multi-parameter techniques, including volcano-seismic networks, ground
A major advance for risk mitigation would be if all active volcanoes had at least one dedicated volcano seismic station with continuous telemetry at a designated responsible institution (volcano observatory) combined with a plan for the use of satellite services.
Technological innovation should strive towards reducing costs of instrumentation and making application of state-of-the-art science as easy as possible so more volcanoes can be
Exchange visits, workshops, summer schools and international research collaboration are good ways to share experience and expertise in volcano monitoring, appraisal
Free and easy access to the most advanced science and data will greatly enhance the ability to manage and reduce volcanic risk. Access to knowledge is globally very uneven
Index-based methods to characterise hazard, exposure, threat and monitoring capacity used in this study are straightforward, and are intended to provide a basic broad
Characterization of the Quaternary eruption record: analysis of the Large Magnitude Explosive Volcanic Eruptions (LaMEVE) database. Eyewitness accounts of the 25 June 1997 pyroclastic flows and surges at Soufrière Hills Volcano, Montserrat, and implications for disaster mitigation.
Newhall and R. Solidum
Despite considerable uncertainty, the outbreak was correctly predicted and more than 85,000 were evacuated on 14 June. Warnings and evacuations before the outbreaks were clearly cost-effective; lahar warnings and evacuations were also cost effective.
Indonesia
Pallister and Surono
Good decision-making depends not only on good leadership, but also on the skills of scientists, good communication and coordination between stakeholders, public communication and the capacity of the community to respond. All of these factors were in place before the 2010 outbreak and contributed to saving thousands of lives. The impacts of Merapi eruptions on the human and cultural environment, livelihoods and property provide a lesson that in densely populated areas around a volcano there is a need for regular review of hazard mitigation strategy, including spatial planning, mandatory disaster training , emergency planning and regular evacuation drills.
2002: a major eruption in the midst of a complex humanitarian emergency
W. Webley
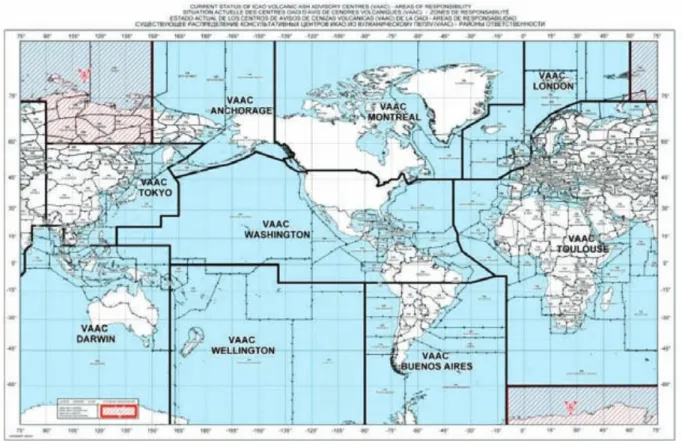
They provide volcanic ash advice to the aviation community for their area of responsibility. International task forces, task forces and meetings have been formed to address issues related to volcanic ash in the atmosphere. In addition, ICAO has established the International Volcanic Ash Working Group (IVATF) as a focal point and coordinating body for work on volcanic ash at global and regional levels.
Jolly
The role of VOs is critical in reducing the risk of volcanoes, both on the ground and in the air.
Potter and G. Leonard
Poland
Gottsmann
Global Volcano Research and Monitoring Institutions Database and analysis of monitoring in Latin America
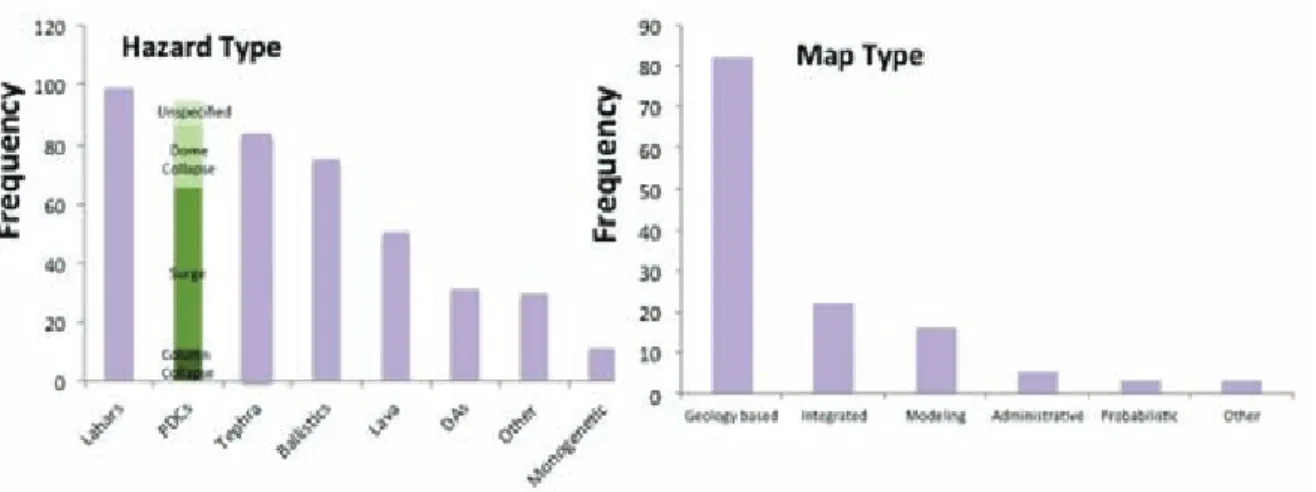
Some hazard maps are based solely on the distribution of previously erupted products, others take into account estimated recurrence intervals of past events, or use computer models of volcanic processes to determine potential future magnitude of impact. Hazard maps can be categorized into five main types, which, in order of decreasing frequency, Driven by the needs of today's stakeholders, there is also a need for future research efforts to advance the science that will assist in the production of a new generation of robust, fully quantitative, accountable and defensible hazard maps.
Volcano, Montserrat
Aspinall and G. Wadge
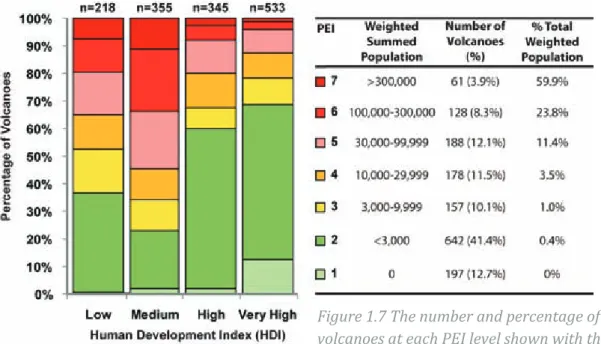
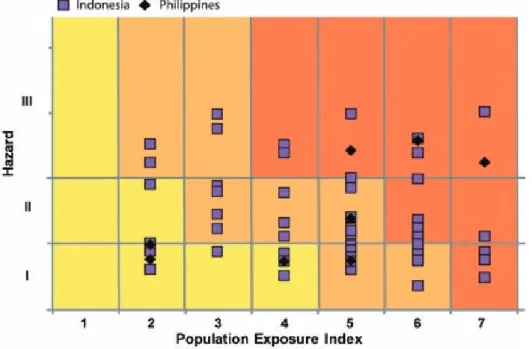
The warming of the background colors is representative of increasing risk through Risk Levels I-III. The absence of thorough eruptive histories for most of the world's volcanoes and thus the absence of VHI is a knowledge gap that needs to be addressed. The second criterion takes into account the proportion of the population in a country that is exposed to the volcanic threat, without taking into account the number of volcanoes.

Marti
To improve scientific communication during volcanic crises, comparisons between communication protocols and procedures adopted by different volcanic observatories and scientific advisory boards are recommended to identify problems and best practices at all levels of communication: scientist to scientist, scientist to technician, scientist to citizen protect the scientist to the general public. It is necessary to incorporate the experience of managing and communicating about other natural disasters and to define common communication protocols based on clear and effective ways of presenting probabilities and associated uncertainties. Although each cultural and socio-economic situation will have different communication requirements, comparison between different experiences will help improve each individual communication approach and thus reduce uncertainty in outbreak prediction communication.
Pallister
Oddsson
Introduction
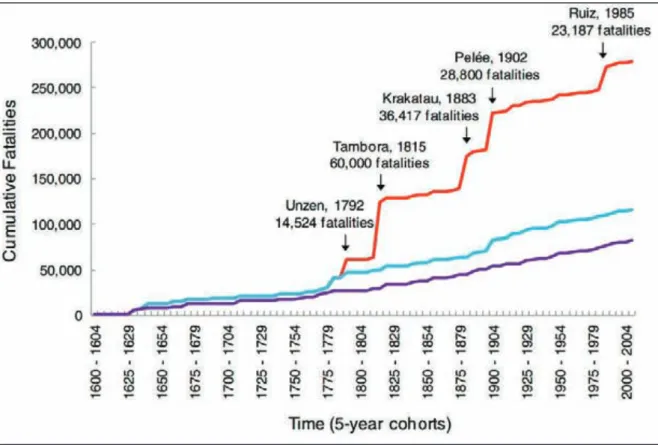
The risk from volcanic eruptions and their accompanying hazards is often underestimated beyond areas in the immediate vicinity of a volcano. Although known historical losses of human life from volcanic eruptions (since AD 1600 recorded around 280,000 deaths, Auker et al. 2013)) are modest compared to other major natural hazards, volcanic eruptions can be catastrophic for vulnerable communities. Recently, the economic impact of volcanic eruptions has become more apparent on a local, regional and global scale.
Background on volcanoes and volcanic eruptions
- Causes of volcanism
- Magma chambers
- Types of volcanoes
- Styles of eruption
Stratovolcanoes, such as Fuji (Japan) and Colima (Mexico), are typically steep-sided and are mixtures of lava and pyroclastic deposits (Figure 2.6c). Calderas are large volcanic craters (1 to more than 50 km in diameter) that are mostly formed by large volcanic eruptions (Figure 2.6e). Explosions can occur as a result of violent release of volcanic gases dissolved in the magma under pressure (Figure 2.8a, b) and by interaction of hot eruption.
Volcanoes in space and time
- Volcano inventory
- Rates of eruption
- Examples of volcanic activity
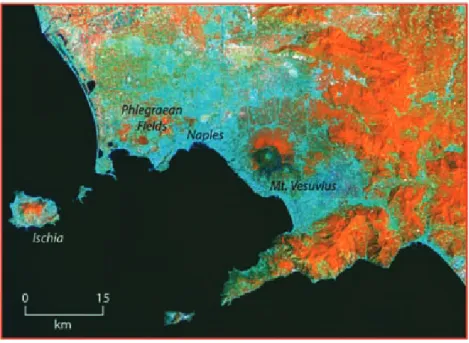
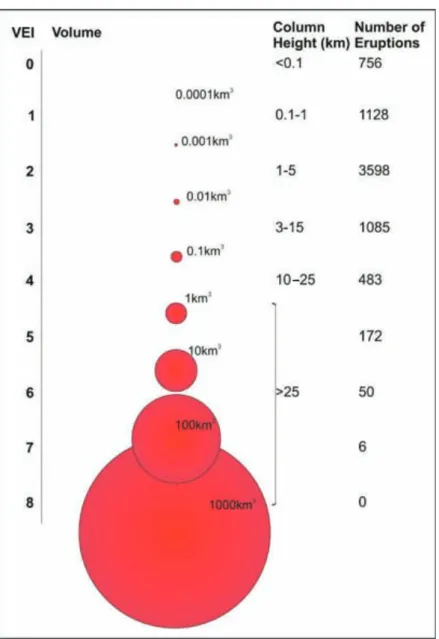
Up to M 6.5 the data define a comparable decrease in the mean return period with magnitude to that seen in the earthquake data. However, for M ≥6.5 the mean return periods become larger than this empirical law and the drop becomes steeper for larger sizes. Naples is one of the cities in the world with the highest volcanic risk [Chapter 6].

Volcanic hazards and their impacts
- Ballistics
- Volcanic ash and tephra
- Pyroclastic flows, surges and volcanic blasts
- Lahars and floods
- Debris avalanches, landslides and tsunamis
- Lava
- Volcanic earthquakes
- Environmental and secondary effects on communities
- Fatalities
The Roman city of Pompeii was destroyed by pyroclastic density currents and buried by their deposits in the eruption of Mount Vesuvius in AD 79. There is about a 1 in 3 chance that an eruption of this magnitude will occur in the twenty-first century. For example, in the 1991 outbreak in Pinatubo (Philippines) about 500 indigenous Aeta children died of measles in evacuation camps because their parents did not trust Western-trained lowland doctors and refused help [Chapter 7]. Figure 2.15 a) Distribution of victims according to fatal causes, for all fatal incidents; b) Distribution of victims among the causes of fatality, with the five biggest disasters omitted; by Auker et al.
Monitoring and forecasting volcanic eruptions
- Monitoring
- Volcanic unrest
- Forecasting and early warning
- Volcano observatories
- Volcano observatories and aviation safety
- Global monitoring capacity
- Low-cost systems for monitoring volcanoes in repose
The range and sophistication of the detection systems has increased dramatically in the last few decades (Sparks et al., 2012). In some cases, VT earthquakes can track the migration of earthquakes to the surface (Toda et al., 2002), allowing predictions of the onset of an eruption. Resonance generates characteristic long periods (low frequencies), which can be modeled to understand the geometry of the tube.
Assessing volcanic hazards and risk
- Hazards maps
- Probabilistic hazard and risk assessment
- Event trees
- Quantification and representations of volcanic risk
- Global and regional assessment
- Distribution of volcanic threat between countries
Social vulnerability is defined (Adger, 2006) as "the propensity of a society to suffer damage in the event that a given hazard occurs". Societal risk is calculated based on the probability (F) of exceeding a given number of fatalities (N) at a certain time. A very difficult issue is the assessment of the probability that an outbreak has ended.

Volcanic emergencies and disaster risk reduction
- Role of scientists
- Effective communication and relationships
- International collaboration
- Risk management
After the controversial management of the 1976 eruption (a large-scale evacuation of the capital with no subsequent major eruption), a major disaster risk reduction effort began in the area around La Soufrière. One of the main functions of a volcano observatory is to provide early warning to communities and authorities. For example, there is evidence that uncertainties can be better understood and there is more acceptance of risk reduction actions taken in the face of uncertainty.
The way forward
The hazard level of many volcanoes is highly uncertain, mostly reflecting the paucity of geological knowledge and in many cases a low frequency or absence of historical eruptions
Probabilistic assessment of hazard and risk that fully characterises uncertainty is becoming mandatory to inform robust decision-making. Deterministic approaches cannot fully
Risks from volcanic ashfall associated with a particular volcano or region can be characterised by detailed probabilistic modelling, taking into account the range of physical
All of these measures can help minimize losses, increase societal resilience and ensure long-term success. For dormant volcanoes, there are two proposed responses, namely the implementation of low-cost systems for monitoring and increased awareness of volcanic hazards and risk among vulnerable populations.
Volcanoes identified as high risk should ideally be monitored by a combination of complementary multi-parameter techniques, including volcano-seismic networks, ground
Efforts should be made to increase the coping capacity to address a wide range of hazards, especially relatively infrequent events such as large volcanic eruptions. Many countries are improving their own disaster preparedness as suggested in the Hyogo Framework for Action. On the other hand, some volcanic emergencies cross borders and there may be hazards and associated risks on a regional or global scale.
Exchange visits, workshops, Summer Schools, and international research collaboration are good ways to share experience and expertise in volcano monitoring, appraisal
In addition, in the last decade, many countries have also helped developing countries where the risk associated with natural disasters is high. A key challenge for all donor country projects is to ensure that they are needs-based, sustainable and well anchored in the development plans of the host countries. Much effort and expense has been invested in both ground-based and satellite data, but the volcano community is still far from fully exploiting this data.
Index-based methods to characterise hazard, exposure, risk and monitoring capacity used in this study are straightforward, intended to provide a basic broad overview of volcanic
As the spatial, temporal and spectral resolution of satellite data continues to improve, satellite and ground data simply need to be achieved in near real time and integrated by observatories. For applications beyond minute-by-minute monitoring, WOVOdat, the GVM Task Force for Volcano Deformation, and several other initiatives are developing searchable archives of useful derivatives of raw ground and satellite data for monitoring.
Evaluation of the impact of the 2010 pyroclastic density flows at Merapi volcano from high-resolution satellite imagery, field surveys and numerical simulations. Review of evidence for the potential health effects of volcanic ash on the UK population and ROI. Global volcanic unrest in the 21st century: an analysis of the first decade. of volcanic activity: revision of New Zealand's volcanic alert level system.
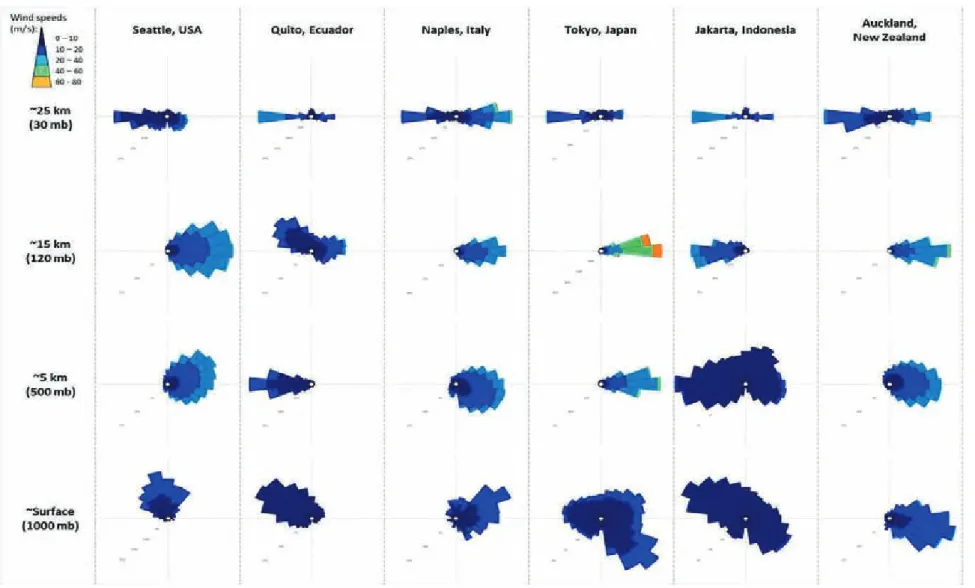
Volcanic ash fall hazard and risk
Quantifying ash fall hazard
Thus, the height of the eruption column and the time of year greatly influence where the ash is dispersed. In the following sections, we present probabilistic ash fall hazard modeling approaches at global and local scales, as a demonstration of the range of methods available for this type of analysis. For the UNISDR 2015 Global Assessment Report (Jenkins et al., 2014b) and as part of the Global Volcano Model, we extended the existing methodology of Jenkins et al. 2012a) to perform a first global probabilistic assessment of ash fall hazard.