NOxis emitted in the flue gas from semiconductor factories as a by-product of combustion to combat PFCs. In this paper, the basic properties of a thermal switch that controls the heat flow by turning on/off the ionic wind were discussed.
Conclusions
This article examines the operating characteristic of a typical home-design plasma ignition system. The current study may provide a good understanding of plasma-assisted ignition in gas turbines and a meaningful reference for developing high performance ignition systems.
Introduction
Moreover, in terms of numerical simulation, the plasma ignition core is usually replaced by a spherical heat source and ignores the effects of jet flow and active species, which further limits the understanding of the plasma ignition mechanism and the design of advanced plasma ignition systems in practice. First, the discharge and jet flow characteristics of the plasma igniter are optically measured in air to obtain the actual shape of the original core.
Experiment Setup and Numerical Strategy 1. Experiment Setup
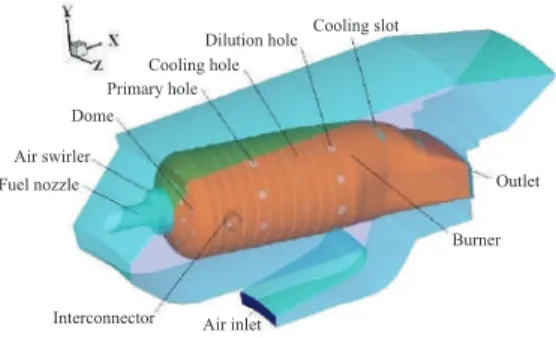
During numerical simulation, mass flow inlet limits are used for the inlet of air (0.19875 kg/s) and C12H23 (0.00600 kg/s) which are the actual values of one operating condition of a gas turbine. This means that it is feasible to numerically study the ignition process of a gas turbine burner using the proposed simple computational domain and numerical approach.
Results Analysis and Discussion
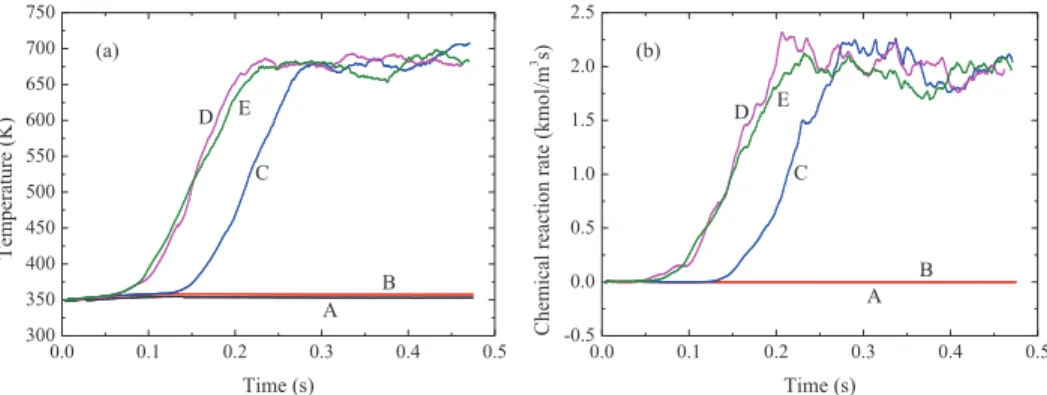
Motivated by this reason, this section will discuss the effects of plasma jet length (varying from 4 mm to 20 mm) on the ignition process of a burner. On this basis, Figure 13 compares the time-varying average temperature and chemical reaction rate of the burner with different plasma stream flow lengths.

Conclusions
Numerical study of the ignition behavior of a core after discharge in a turbulent cross-stratified flow. Proc. Critical initiation radius measurements and unsteady propagation of n-decane/air premixed flames. Proc.
Control Strategy for Power Conversion Systems in Plasma Generators with High Power Quality and
- Conventional Control Algorithm of DC-AC Inverters for Plasma Generators
- Proposed Control Algorithm of DC-AC Inverters for Plasma Generators 1. Principle and Characteristics of the Proposed Control Algorithm
- Simulation and Experimental Results
- Conclusions
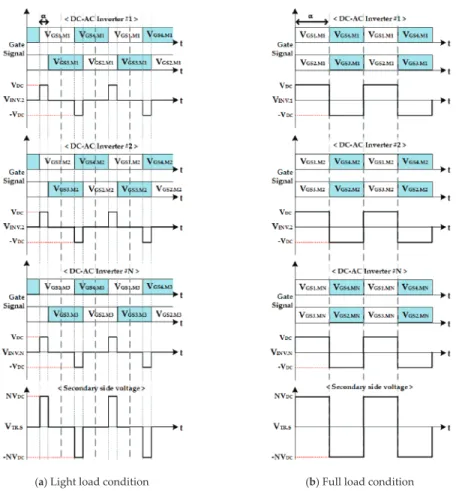
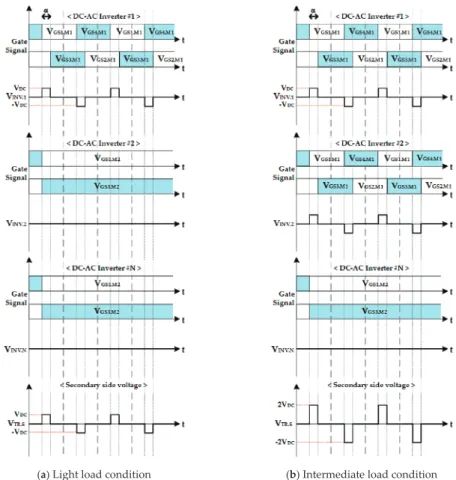
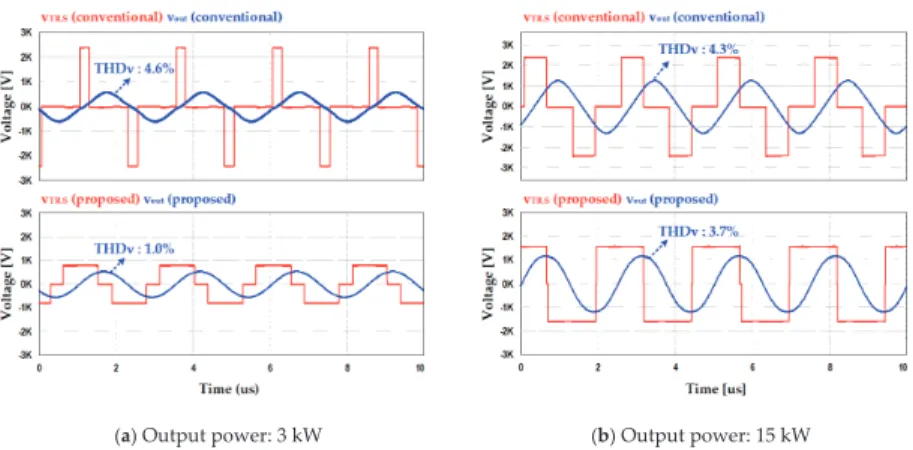
Figure 2 shows waveforms of the DC-AC converters applied in the conventional control method. Therefore, the quality of the output voltage (vout) was higher for the proposed control method.

Gasification of Waste Cooking Oil to Syngas by Thermal Arc Plasma
Materials and Methods
A schematic of the experimental setup is shown in Figure 1, which includes a plasma torch (1), a chemical reactor (2), a plasma-forming gas supply system (3), an electrical circuit (4), a waste cooking oil inlet with preheating (5), and a generator gas sampling and analysis line (6). The electrodes of the plasma torch were made of copper, and a hafnium cathode was used as the electron emitter. An electromagnetic coil was also used, which further increased the rotation of the arc and thus extended the life of the anode.
A constant 10 bar pressure was maintained in the WCO supply line to ensure a stable flow rate at the nozzle capacity limits. The measurement of the tar content in the producer gas and the condensate was also carried out.

Results
Therefore, the effect of the steam-to-waste cooking ratio on the efficiency of the gasification process was determined. The effect of the S/WCO ratio on the producer gas concentrations is shown in Figure 2. The effect of the S/WCO ratio on the quality of the produced syngas and the H2/CO ratio is shown in Figure 3.
The effect of S/WCO ratio on carbon conversion efficiency is shown in Figure 4. The effect of S/WCO ratio on gasification process efficiency in terms of energy conversion efficiency (ECE) and specific energy requirements (SER) is shown in Figure 5.

Plasma–Chemical Hybrid NO x Removal in Flue Gas from Semiconductor Manufacturing Industries Using
Principle
This section describes the principle behind the removal of NOx using a combined process consisting of a dry plasma process using non-thermal plasma and a wet chemical process with a wet scrubber. The non-thermal plasma causes some of the oxygen in the air to change to ozone (which is an oxidizing agent) and oxygen radical (O).
Experimental Apparatus and Method
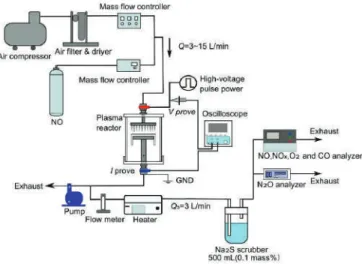
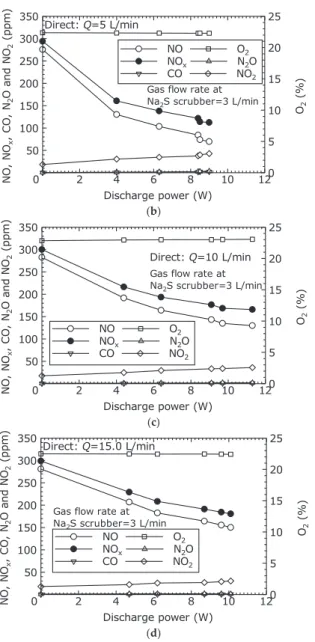
To ensure that the pressure in the plasma reactor remained at atmospheric pressure during the experiment, the pressure upstream of the reactor was monitored. A schematic diagram of the experimental setup for the indirect plasma oxidation method is shown in Figure 3. The total flow rate of the air flowing through the reactor and mixing with the exhaust gas was changed to 3, 5, 10 and 15 l/min.
Figure 4 shows typical waveforms of voltage, current, and product of voltage and current as measured by an oscilloscope. To evaluate the combined dry plasma process and wet chemical process using a wet scrubber, NOx concentrations at different discharge powers are measured in this study.
Results and Discussion
To evaluate the NOx removal performance of the combined dry plasma and wet chemical processes by the direct oxidation method, the NOx removal efficiency and NOx removal energy efficiency at different flow rates are shown in Figure 7. The NOx removal energy efficiency was calculated as the total flow rate versus the amount of NOx removal. Figure 7 shows that as the total flow rate increased, the NOx removal efficiency decreased and the NOx removal energy efficiency increased.
To evaluate the NOx removal characteristics of the dry plasma and wet chemical processes with the direct oxidation method, the NOx removal efficiency and NOx removal energy efficiency at different flow rates is shown in Figure 10. Figure 10 shows that as the flow rate increased, the NOx removal efficiency decreased and the NOx.
Development of an Electrostatic Precipitator with Porous Carbon Electrodes to Collect Carbon Particles
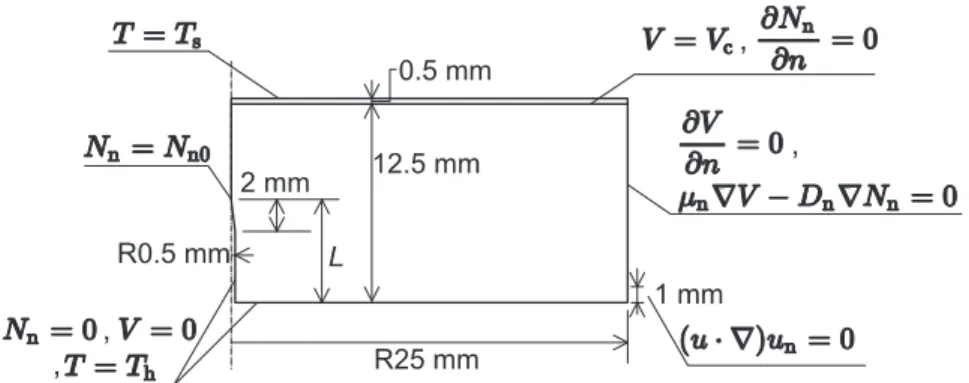
Calculation of the Corona Discharge Model 1. Calculation Model
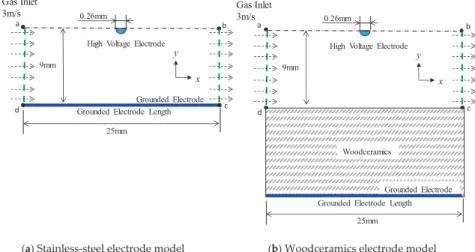
The electric potential at the bottom of each electrode was 0 V. The overall grid size was 0.4 mm or less, and the grid above the grounded electrode was further divided into 0.08 mm in width or less. In the case of wood ceramics, the gas flow rate was set to zero, the other parameters of the wood ceramics are shown. The diffusion constant of wood ceramics was calculated using the Einstein equation for Brownian motion as follows:. a) Stainless steel electrode model (b).
The electric field on the surface of the wood-ceramic electrode was about 10% smaller than that on the surface of the stainless steel electrode. The underside of the wood ceramic was grounded so that the potential at the surface of the wood ceramic was approximately 480 V due to the current flowing in the wood ceramic. a) Stainless steel electrode (b) Wood ceramic electrode Figure 3.
Experimental Methods 1. Woodceramics
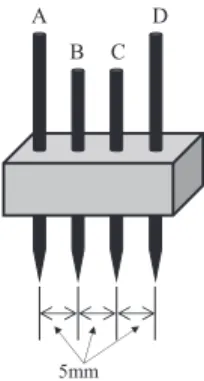
These results shed light on the particle aggregation process; particle load and migration rate are reduced when using a wood-ceramic electrode, unlike a stainless steel electrode, due to the reduced electric field. The electrical resistance of the wood and stainless ceramic electrodes were measured according to the Japanese Industrial Standard (JIS K7194 Test method for the resistance of conductive plastics with a four-point probe set) using the measuring probe shown in Figure 7. Instead of Nin, the average particle concentration measured downstream of the electrostatic precipitator without an applied voltage was used.
The corona discharge electrode structures with the wood-ceramic grounded electrode and the stainless-steel grounded electrode are shown in Figure 10. Our experimental results showed that, with the use of the wood-ceramic electrode, the particle collection efficiency improved in all particle size ranges, while the reentrainment phenomenon decreased.
Fundamental Evaluation of Thermal Switch Based on Ionic Wind
Materials and Methods 1. Experimental Methods
Heat transfer took place between the upper surfaces of the aluminum block and the copper plate. The temperature on the upper surface of the copper plate was measured with a thermographic camera. However, the magnitudes of the corona discharge currents are significantly smaller than in the experiment.
In the present study, energy efficiency (η) can be defined as the ratio of the increased heat flow rate (ΔQ) to the input discharge power Pc(=Ic×Vc) (see equation (25)). Due to a small temperature increase in the gap, the heat flow from the heating surface decreased, while the heat received by the upper surface of the gap increased.
Collection Characteristic of Nanoparticles Emitted from a Diesel Engine with Residual Fuel Oil and
Experimental Setup
The temperature of the exhaust gas was between 130◦C and 150◦C, and the gas temperature inside the ESP was between 70 and 80◦C.
62 䞉12[
Results and Discussion
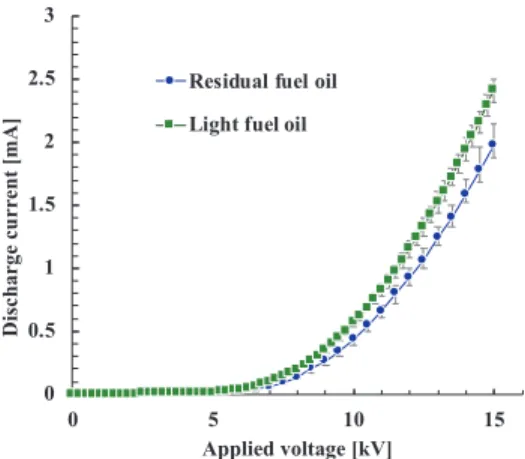
The relationship between the applied voltage and the discharge current in the exhaust, when residual and light fuel oil was used, is shown in Figure 3. The NOx concentration in the exhaust gas, using residual fuel oil, was 149 ppm, and the concentration with light fuel oil was 120 ppm. Thus, the influence of the polarity of the applied voltage in the exhaust gas, when residual fuel oil is used, was investigated.
On the other hand, the nanoparticle concentration did not increase in the exhaust gas when light fuel oil was used. These results indicate that the increased nanoparticle concentration in the exhaust gas, with the use of residual fuel oil, may be due to ion-induced and binary homogeneous nucleation.
High Reduction Efficiencies of Adsorbed NO x in Pilot-Scale Aftertreatment Using Nonthermal Plasma
Operating Principle of NO x Reduction in Aftertreatment
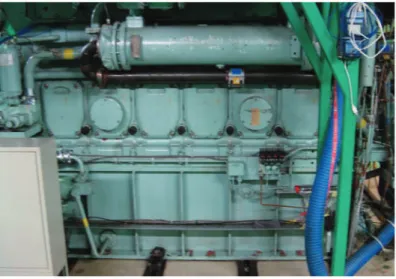
The switching of the different processes is achieved by changing the exhaust paths and by making use of the engine's waste heat recovery. Figure 1 shows process diagrams of the PM and NOx simultaneous reduction system for a marine diesel engine. Since the aim of the present study is to investigate the NOx reduction efficiency in a larger number of cycles compared to our previous study [2], the experimental design and processes are the same.
The system mainly consists of the marine diesel engine, diesel particulate filters (DPFs), an adsorption chamber and NTP reactors. In the adsorption process, the exhaust gas flow rate determines the flow rate, which is measured by pitot tubes.
Experimental Apparatus
Figure 3 shows a schematic of the aftertreatment experimental setup for a marine diesel engine. The adsorption chamber is optimally designed based on our laboratory experiment results [25] and previous pilot experiments [2,3]. Energy efficiency of NTP treatment showing how to efficiently treat mass NOx.
In the desorption process of cycle 19, the NOx concentrations upstream and downstream of the NTP generator are 5610 and 1620 ppm, respectively. However, the present study is carried out in the steady state of the adsorption and desorption of NOx, in which the adsorption performance decreases.