This chapter discusses social media use and community resilience development during the COVID-19 pandemic in Singapore. Yet there is little or no discussion of the use of social media to sense community resilience during the COVID-19 pandemic.
Methods
Data Collection
Data Pre-Processing
Data Analysis
Results
Information Gathering, Dissemination, and Exchange During the COVID-19 Pandemic
These topics became the second most discussed topic during the Stronger Measure phase for a few days. As a result, topic 21 (holiday and leisure activities) became the most discussed topic for a few days during the tightened circuit breaker period (Table 11.2).
Promotion of Connectedness and Collaborative Problem Solving
Results 155 shown in Table 11.5 and Figure 11.4, during the circuit breaker tightening phase, although there was a prevalence of the first person plural pronoun (“we”), the first person singular pronouns took person ('I') also increased a lot compared to other periods. But during the initial phase of the circuit breaker and the safe reopening phase, the number of first person plural pronouns ('we') was significantly higher than the first person singular pronoun ('I').
Regional-Specific Community Resilience
The first strand considers community resilience as a social-ecological system that is strongly influenced by geographic locations. The second strand considers community resilience as a social entity that is influenced by personal development, social connections and mental health.
Conclusion
URLhttps://www.moh.gov.sg/news-highlights/details/tighter-measures-to-minimise-further-spread-of-covid-19. URLhttps://www.moh.gov.sg/news-highlights/details/circuit-breaker-to-minimise-further-spread- of-covid-19.
Introduction
Professional surveying and space science bodies are acutely aware of the impact the novel coronavirus COVID-19 is having on members and supporting partners. This chapter discusses the role of the Space Studies and Sciences Institute (SSSI), Australia during the COVID-19 pandemic.
Serving Surveying and Spatial Science Professionals
Member Services: Adjust member processes to accommodate COVID-19 restrictions, such as removing the need for face-to-face communication. Results from the COVID-19 member survey are discussed along with how the Institute is responding to member feedback.
COVID-19 Member Survey
- Advocacy
- Continuing Professional Development
- Member Connect
- Job Prospects
- Member Services
- Economic Sensitivity
164 Role of the professional body in a pandemic Surveying and spatial sciences in public policy and more recently facilitating online panel discussions. Although it was not the gala dinner that members are used to, it still provided an opportunity to congratulate those who have contributed extensively to the four pillars of the profession: academia, government, research and the private sector.
Moving Back to Normality
Conclusion
URL https://sssi.org.au/knowledge-hub/news/launch-of-action-plan-for-australia-s-export-servi. URL https://www.mckinsey.com/featured-insights/future-of-work/from-surviving-to-thriving-reimagining- the-post-covid-19-return#.
Taylor & Francis
Introduction
One unique aspect of the OSM database is the ability for anyone to access the entire history of contributions and edit the data in the database. This chapter will analyze and understand how OSM was used in the early months of the COVID-19 pandemic.
Background and Related Work
Methodology and Research Approach
Applications or services related to COVID-19 using OSM data (such as points of interest, road networks, data of buildings such as hospitals or medical facilities); Initiatives or applications aimed at collecting new OSM data that are immediately relevant to the response or management of the COVID-19 pandemic;.
Use of OSM Data for COVID-19
To determine whether OSM tiles were used in relation to COVID-19 response, we compared tile usage statistics between two heavily affected regions (Lombardy in Italy and Wuhan in China) with their relatively unaffected counterparts in the same countries (Sicily and Beijing). Purple vertical area is the control period where orange vertical area shows a 3-week period affected by COVID-19.
Collection of OSM Data for COVID-19
An example is a dataset from the Municipality of Bologna[84], which was imported into OSM by the Italian community through a documented procedure [85] based on a collaborative uMap project [82] (see Figure 13.6). Finally, given the high use of OSM data in Italy from emergency agencies such as Red Cross, Civil Protection and firefighters, the Italian community also decided to focus the mapping efforts during COVID-19 times on significant imports prepared or started in the past but not yet completed, e.g.
Academic Research with OSM During the COVID-19 Response
180 use cases of OpenStreetMap data During the COVID-19 Pandemic than 524 million COVID-19 tweets and used OSM's Nominatim service to geocode and return the geocode toponyms contained in the tweets [92]. If one were to share data representing the home locations of people infected with COVID-19, the privacy of their location would be compromised.
Conclusions and Future Work
In Mooney and Juh´asz [97], the authors note that many web-based maps created during the early stages of the COVID-19 pandemic appear different or even contradictory. Daily surveillance of COVID-19 using the prospective space-time scan statistic in the United States.
Introduction
Local government bodies (LGBs) in India have taken several measures to reduce the spread of the virus. Features such as temporal analysis helped to understand the spread of the disease in time.
Literature Review
The latest technical features of GIS such as location intelligence and live tracking have made it possible to potentially map COVID-19 and understand the spread of the outbreak. To curb the spread of the outbreak, disinfection of public places such as public buildings, major and minor roads with sodium hypochlorite (NaClO) solution is undertaken by the municipal authorities of many Indian cities.
Methodology and Materials
- Data Preparation
- The Network Dataset
- Building the VRP Route
Road network data has an attribute called StreetName for street names that have been matched to Google Earth imagery. The Road Length attribute includes the length of roads that are calculated using the geometry calculation tool.
Results and Discussion
From below Table 1, comparison between the previous route and the optimal route based on predetermined attributes is analyzed. The mileage, the time taken to drive the fire engine, the cost of fuel used by the public officials and the labor cost are compared with the previously chosen route and the optimal route taken later.
Conclusion
With the COVID-19, it has become clear that the significant social and economic benefits of the urbanization and globalization era can be accompanied by a globalized threat and risk. Governments urgently explored short- and long-term actions on how to sustain a resilient economic and social activity while keeping their people safe, but also on defining policies that will help them deal with the post-COVID-19 challenges.
Introduction
This chapter provides insight into the above issues and draws attention to the benefits of a clear and inclusive strategy and of an appropriate formalization framework. 196 Formalizing Informal Settlements to Empower Citizens Support governments to identify and empower the most vulnerable and those most exposed to the pandemic.
The Need for Geospatial Data and Tools to Improve Decision-making
The World Bank reports that the COVID-19 pandemic has plunged the global economy into its deepest recession since World War II. There is an urgent need for governments to now integrate such tools to improve pandemic preparedness measures.
Measures Taken by Governments to Manage the Pandemic
How to Formalize Informal Building to Empower Residents 199 and the complex dynamics of the industry and a general aversion to risk had already made the provision of formal, affordable housing suitable for all a problematic process. Governments should seriously consider new appropriate ways and tools to administer and manage land [12], and formalize existing informal structures to allow those residents access to credit, improve their living conditions, and implement sanitary and safety improvements in such structures necessary.
How to Formalize Informal Construction in Order to Empower Residents against COVID-19
Benefits of an expedient formalization of informal settlements could contribute to economic recovery by providing property rights, registering them in the cadastral systems and integrating them into local economies. Tools for Legal Integration and Regeneration of Informal Development in Greece: A Research Study in the Municipality of Keratea.
Introduction
This article reviews existing COVID-19 emergency management tools and applications currently in use by various countries and jurisdictions and identifies and compares their key capabilities and functionalities. 204 Spatially Enabled COVID-19: A Review of Applications and Systems One of the early contributions of the geospatial industry was the development of smartphone applications to assist in contact tracing.
Tracing Apps
Another application where geospatial technology played a key role was the identification and proximity of individuals to essential services. By adopting such a decentralized protocol, contact tracing applications will generate and broadcast short-lived pseudo-random values via Bluetooth.
Map-Based Dashboard
The most famous COVID-19 dashboard (see Figure 16.3) has been created and maintained by Johns Hopkins University since late January 2020. Map-based dashboard 207 Johns Hopkins University's COVID-19 dashboard. Figure 16.5 illustrates the COVID-19 dashboards created by India (top left), Brazil (top right), Australia (bottom left) and WHO (bottom right) using various web tools.
Conclusion
COVID-19 Data Repository by the Center for Systems Science and Engineering (CSSE) at Johns Hopkins University. The COVID-19 cases are predicted by wavelet and neural network with an average RMSEIQR of 0.974 for all countries.
Introduction
The importance of the periods of COVID-19 is assessed for each country and the most important periods are selected as time series forecast lags and temporal neighborhood steps of the spatiotemporal analysis. Based on their findings during the first 2 months, COVID-19 has spread worldwide with different conditions and symptoms [10].
Materials and Methods
- Wavelet transforms
- Neural networks
- Hot/Cold spot analysis
He had extracted space-time clusters and critical sites of the disease based on Mann-Kendall and Getis-Ord Gi∗statistic [9]. The wavelet function is defined as Eq. 17.1) The basic functions of the CWT are scaled and shifted versions of a function called the time-localized mother wave Ψ(t).
Results of Proposed Model
- Identification of significant periods using CWT
- Extraction of effective features using DWT
- Prediction model based on a neural network
- Extraction of hot/cold spot patterns
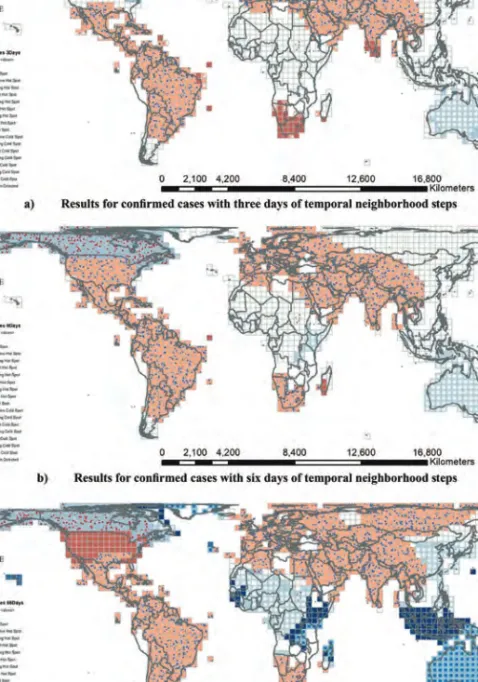
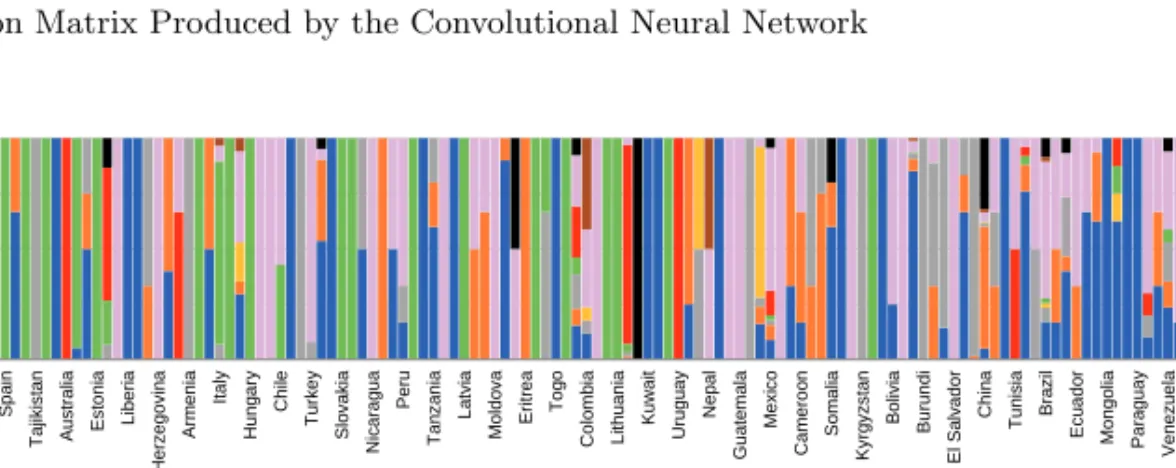
These plots show the spread of the disease, its peaks, sudden increases and forecast results in each country. Hot/cold spots of confirmed cases of COVID-19 in countries of the world with one-day neighbors up to 21 March 2020 are shown in Figure 17.6.
Discussion
224 COVID-19 Spatiotemporal Hotspots and Prediction In the COVID-19 prediction for each country, the performance of the proposed model was investigated in different situations based on test and train RMSE, and the DWT and CWT mother wavelet functions were determined as well as an optimal network was built. The results indicate that the performance of the prediction was adequate for almost all countries.
Conclusion
Effective environmental and social factors in COVID-19 and the impact of neighboring countries will also be extracted, which are recommended for further study in this area. This chapter looks at the spatial distribution and mobility patterns of essential and non-essential workers before and during the COVID-19 pandemic in London and compares them with the rest of the UK.
The 2020 Pandemic in Britain
Also, the amount of travel time saved by working from home during the pandemic is roughly the same proportion – 80% – as the split between essential and non-essential workers. In the financial quarter – the 'square mile' or the City – which is the traditional heart of the metropolis, half a million people usually work largely in financial and legal services and related activities, but most were absent, working from home, for the last 6 months since the pandemic started.
Defining Essential Workers
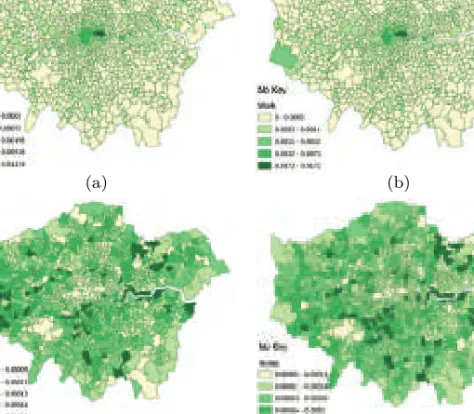
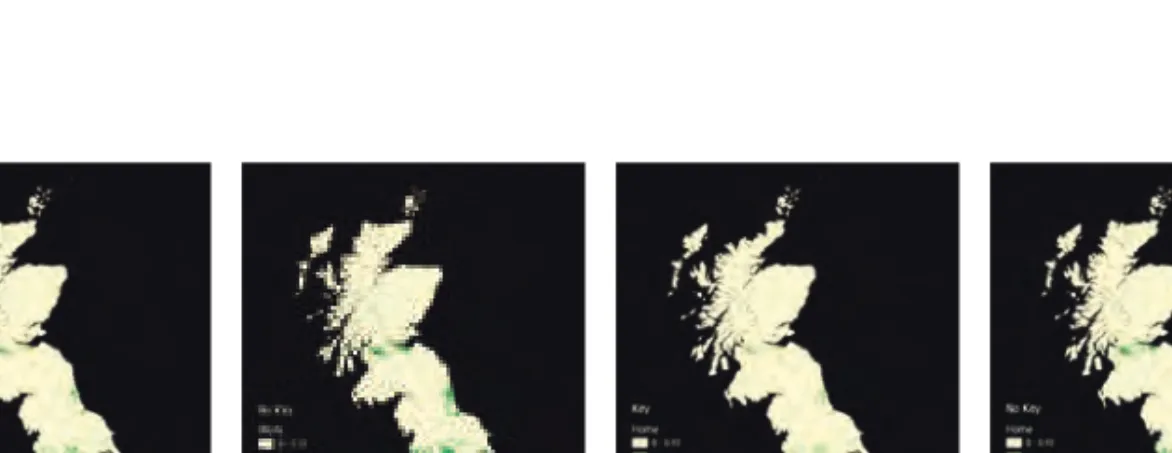
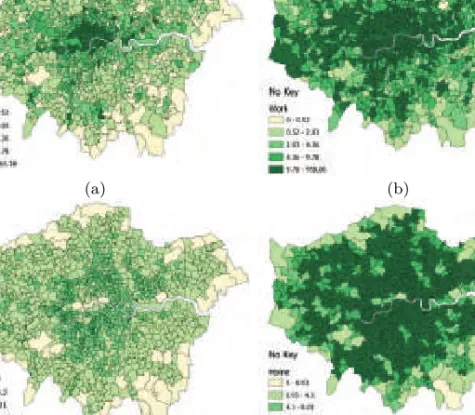
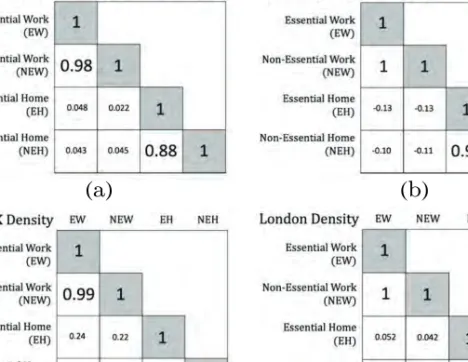
UK: Essential and non-essential employment densities at work (a and b) and at home (residence c and d). London: essential and non-essential employment densities in the workplace (a and b) and at home (residence c and d).
The Movement Patterns of Essential and Non-Essential Workers
The Movement Patterns of Essential and Non-Essential Workers 239 only very slightly less than the non-essentials. First we will look at the total journey in the essential and non-essential sectors, and these are defined as T(es) =P.
Drilling Down Into Individual Locations in London
The other four activities – retail, jobs, transport use and grocery shopping – all show a large drop when the lockdown occurred and then a gradual recovery, but only in the case of grocery shopping has this recovered almost to baseline – the old normal. In Richmond the decline is similar to that in the UK and Newham, but the decline in the City of London is much more fragmented due to a gap in weekend data collection, while in the three other cases the impact of the weekend is very strong compared to the day of the week. uttered.
Conclusions and Next Steps: A More Integrated Analysis
We analyze the implementation and use of global UNGGIM frameworks in the geospatial response to COVID-19. Through regional meetings and consultations carried out in the context of the pandemic, we have been able to verify that countries, more or less, have knowledge of geospatial methods and tools to cope with critical situations such as the COVID-19 pandemic.
Introduction
In addition, we analyze the role and implementation of global UNGGIM frameworks in the geospatial response to COVID-19. A country-level geospatial response to COVID-19 can be supported by robust global guidelines provided by the United Nations Committee of Experts on Global Geospatial Information Management (UNGGIM [6]).
Overview On the Regional Geospatial Response to COVID-19
Viewer of vulnerability levels in Colombia Source: National Administrative Department of Statistics of the Republic of Colombia, 2020. The second is the "Solidarity Plan", headed by the Economic Advisory Council led by the Ministry of the Presidency and integrated by several institutions.
Gaps and Challenges
Conclusions
Gis-based spatial modeling of covid-19 incidence in the continental United States. Science of The Total Environment, page. This chapter illustrates the state of the art of providing COVID-19 information using selected EU countries as examples.
Introduction
Infectious diseases such as COVID-19 spread from person to person and thus in space and time. The integrated display and analysis of COVID-19 data from various sources reveals a wide range of difficulties, such as timely reporting, ambiguous definitions of cases and deaths, to name a few.
Spatiotemporal Spread of Infectious Diseases
The Nomenclature of Territorial Units for Statistics (NUTS) provides a breakdown of the economic territory of the European Union into territorial units. At the EU level, NUTS serves as a reference for the collection, development and coordination of regional statistics of the European Union, for socio-economic analyzes of regions and for the formulation of EU regional policies.
COVID-19 Pandemic Data Using the NUTS System .1 EU Level
- National and Sub-National Level
The current NUTS nomenclature divides the territory of the European Union into 104 regions at NUTS 1 level, 281 regions at NUTS 2 level and 1,348 regions at NUTS 3 level. This fact became very evident again in the initial phase of the COVID-19 outbreak, when political decisions were taken mainly by national member governments.
Shortcuts and Challenges of COVID-19 Data Provision
Only in Hubei province can medical professionals classify a suspected case of COVID-19 as a clinically confirmed case, without the need for laboratory confirmation. Similarly, for example, one country's daily figures for COVID-19 deaths may only include deaths in hospitals, while other countries include deaths in nursing homes [23].
Discussion
- The Data Problem
- Public Health Data and Statistical Information
- Public Health Data and Spatial Data Infrastructures
- Integration of Public Health Data, Statistical Data and Basic Geospatial Data
At the beginning of this century, there was a similar situation regarding the Spatial Data Infrastructure (SDI) of EU member states. INSPIRE is based on national data infrastructures established and managed by the member states of the European Union.
Conclusions
Since 2016, “the global integration of spatial, statistical and other related information” has been explicitly on the agenda of the UN Committee of Experts on Global Spatial Data Management [34,35]. Directive 2007/2/EC of the European Parliament and of the Council of 14 March 2007 on the establishment of an Infrastructure for Spatial Information in the European Community (INSPIRE).
Introduction
268 Practicing Online Higher Education Facilitated by ICT in China The practice of online higher education officially started on March 1, 2020 when the spring semester began. Therefore, the chapter focuses on the current practice of online higher education facilitated by ICT to illustrate the crucial elements for maintaining performance in the context of the COVID-19 pandemic in China.
Literature Review
- ICTs and Online Accessibility
- Experience Learned from Flipped Classroom and MOOC
- MOOC
- Learning Behavior Change
270 Practicing Online Higher Education Facilitated by ICT in China innovative educations that transform students' learning behavior bring out the valuable experience of online higher education. During the time when the teaching is in the classroom, the learning behavior of the students is easy to predict, observe, explain and evaluate (POEE), while online teaching is the opposite.
Practice of Online Higher Education in China .1 Background
- Online Learning Environment in Practice
- Case Study
To evaluate student performance, the chapter provided a survey at the end of the semester. The purpose of the study was to test significant elements that influence student performance in their learning experience.
Conclusion
274 Implementation of ICT-Enabled Online Higher Education in China The mean score in both groups was homogeneous, with no obvious variance. Further, a correlation analysis is performed between the Z-scores obtained by the Mann-Kendall test and the number of cases of COVID-19.
Introduction
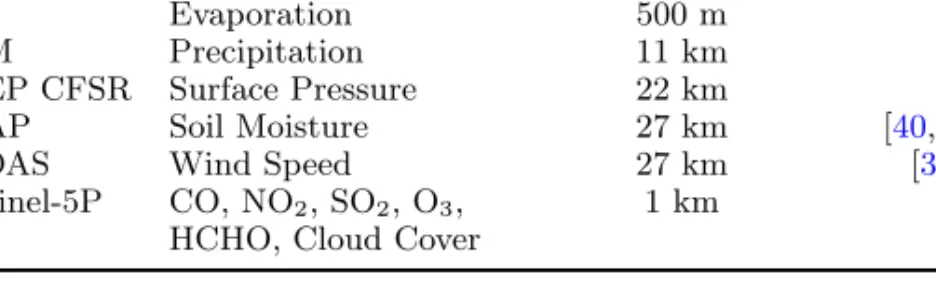
This chapter reports on a national survey of COVID-19 using remote sensing (RS) indicators in Iran. -series analysis is performed on RS indicators (n=12) including wind speed, temperature, evaporation, carbon monoxide (CO), nitrogen dioxide (NO2), sulfur dioxide (SO2), ozone (O3), formaldehyde (HCHO), cloud cover, precipitation, air pressure and soil moisture (SM) to identify remotely sensed products that may contribute to COVID-19 transmission.
Materials and Methods
- Study Area
- Disease Dataset
- Remotely Sensed Data
- Methodology
Finally, correlation between Z-values and the number of COVID-19 cases was calculated to identify the most effective indicators. Correlation analysis was examined between Z-score of each indicator and the number of COVID-19 cases.
Results and Discussion
According to the results, no strong correlation was observed between SM and the number of COVID-19 cases. This suggests that there is no correlation between the mentioned indicators and the number of COVID-19 cases in Iran.
Conclusion
Association between short-term exposure to air pollution and covid-19 infection: evidence from China. Science of the Whole Environment, p. Effects of temperature fluctuations and humidity on death due to covid-19 in Wuhan, China. Science of the Whole Environment, p.
Background
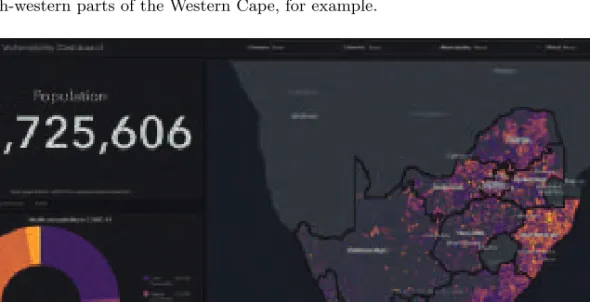
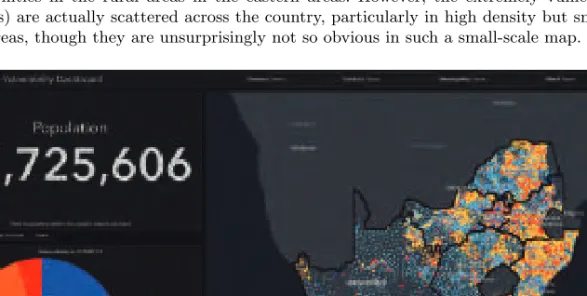
This chapter presents the “COVID-19 Vulnerability Dashboard” for South Africa developed by the CSIR for the National Disaster Management Center (NDMC). The following section provides some background on South Africa and the context for the development of the COVID-19 Vulnerability Dashboard.
Government Structures in South Africa
As more data becomes available, updated versions of the COVID-19 Vulnerability Indicators will be released and shared to improve their usability and accuracy. It consists of three main components: the COVID-19 Vulnerability Index, the COVID-19 Transmission Potential Indicator and the COVID-19 Health Susceptibility Indicator.
The Green Book
Many South Africans, even among the poorest, have two family homes, one in a traditional rural area and one close to the labor market, so there is also a lot of inter-provincial travel – increasing the COVID-19 risks.
SARS-CoV-2 and COVID-19 in South Africa
294 COVID-19 Vulnerability in South Africa level 1, near normal (but with a curfew), to level 5, with drastic measures such as confining everyone at home (except for essential services and goods), closing most businesses and full bans on the sale of alcohol and tobacco products [25-27]. On the other hand, some consider the actual deaths from COVID-19 to be much higher.
The COVID-19 Vulnerability Dashboard .1 Background
- The Dashboard Platform
- Overview of the COVID-19 Vulnerability Dashboard
- COVID-19 Vulnerability Index
- COVID-19 Transmission Potential Indicator
- COVID-19 Health Susceptibility Indicator
Limitations and considerations used: The COVID-19 vulnerability indicators are not based on epidemiological models. With the COVID-19 pandemic in South Africa, many industry departments faced similar questions at the start of the outbreak.
Challenges .1 Data Sources
- Quality
A key issue with the latter is the structure of the death certificate and whether COVID-19 is recorded as the immediate cause, an underlying cause, a significant condition contributing to death, or not at all [50]. While South Africa has a set of standards for addresses [51], it is not yet widespread and the forms for COVID-19 do not take it into account.
Conclusions and the Way Forward
We would like to thank CSIR for funding the development of the COVID-19 Vulnerability Dashboard. Disaster Management Act: Regulations to deal with, prevent and combat the spread of the COVID-19 coronavirus: amendment, 20 April 2020.
Introduction
306 Rapid development of location-based apps The first confirmed COVID-19 case in South Korea was registered on January 19, 2020 – a resident of Wuhan visited South Korea [4]. The NSDI elements and policy/legal and institutional factors that contributed to the success of the COVID-19 related applications and systems are further described in Section 24.4.
Location-based Apps
- Emergency Broadcasting Service
- CoronaMap
- Corona Now
- Now and Here
- CoBaek Plus
- Masks Stock App
- Self-Quarantine
In South Korea, the data on COVID-19 patients is considered public data (i.e., the data collected from confirmed patients). According to an article published by Hankyoreh Press3, Dong-Hoon Lee said on his Facebook page, “The coding and the user interface (UI) is still confused.
Real-time Data Processing Systems
- Integrated Information Support System for Infectious Disease Control
- Smart City Data Hub
- Epidemiological Investigation Support System (EISS)
Since then, more than 150 apps have been developed to help the public purchase face masks.8 The number of data calls related to mask distribution through the API cloud reached 570 million (about 9.64 million per hour) from March 11 to 31 . 2020 [12]. 314 Rapid Development of Location-based Apps takes steps with the launch of the “Integrated Information Support System for Infectious Disease Control” in 2013 [23] to bring together various disease-related reporting and management systems [24].
COVID-19 Response Success Factors
- National Spatial Data Infrastructure
- Open Data Policy
- Institutional Arrangements
- Fundamental and Specific Dataset
A robust NSDI governance model supported by a central coordinating body (NSDI Board) and supportive institutional networks has been an influential factor in the development of COVID-19 applications and services based on effective collaboration and data sharing. SPACE N spurred the development of new and innovative technologies, datasets, and platforms that have since become vital components of South Korea's geospatial data market, enabling applications for COVID-19.
Conclusion
In summary, hundreds of COVID-19 apps have been developed since the first outbreak to date (September 2020). Additionally, with so many apps available, a platform with a regularly updated list of COVID-19 apps is needed to avoid similar services.