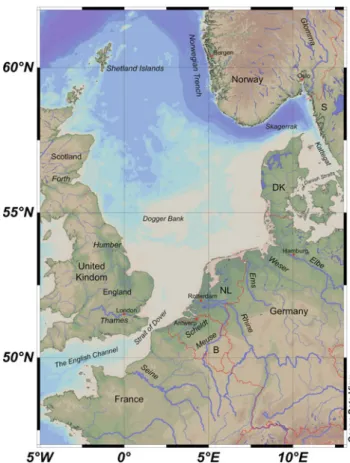
In general, the salinity of Baltic Sea water is much lower than that of the North Sea. The coast of the North Sea displays a great variety of landscapes, some of the largest in the world. The images in Fig.1.2 show the diverse character of the different parts of the North Sea coast.
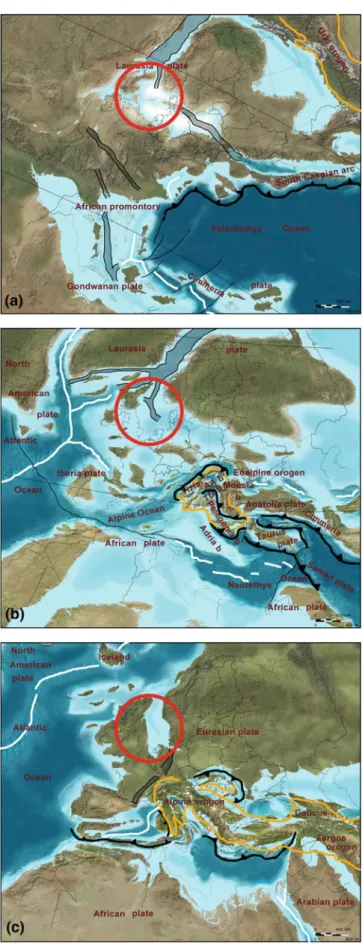
The main land areas in the North Sea region used for agriculture are introduced in section 1.7. Nature conservation in the North Sea is based on the designation of EU protected areas. During the Jurassic [200–145 Ma], the North Sea area was still in the subtropical climate belt.
Beginning in the Middle Pleistocene [* 1 Ma] glacial and interglacial types of sedimentary processes dominated the North Sea basin. Human settlements in the southern coastal area of the North Sea can be traced back to 3 ka.
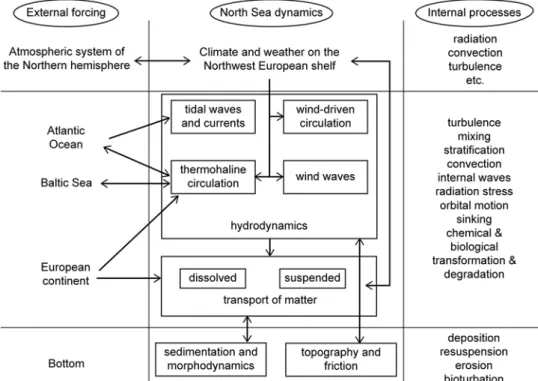
Hydrography — Description of North Sea Physics
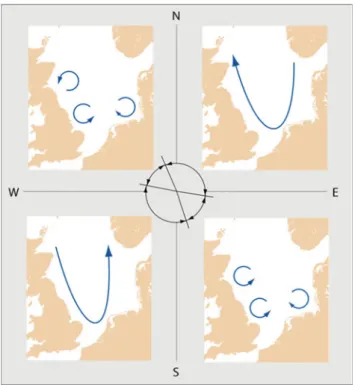
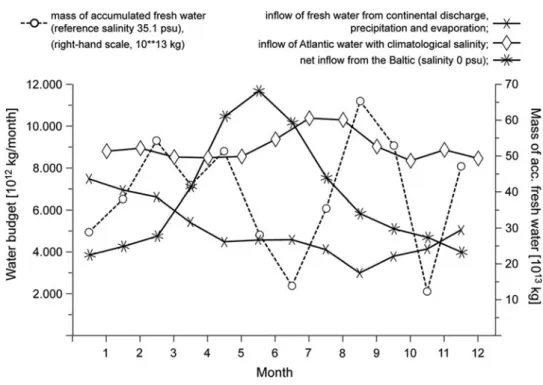
The ridge, Dogger Bank–Jyske Rev, divides the North Sea into a southern and a northern basin. The substances carried by the respective currents enter the North Sea (salt, nutrients) or the Atlantic Ocean (fresh water, pollutants). The frequency distribution of wind direction and speed determines the main current patterns in the North Sea (see Section 1.4.3).
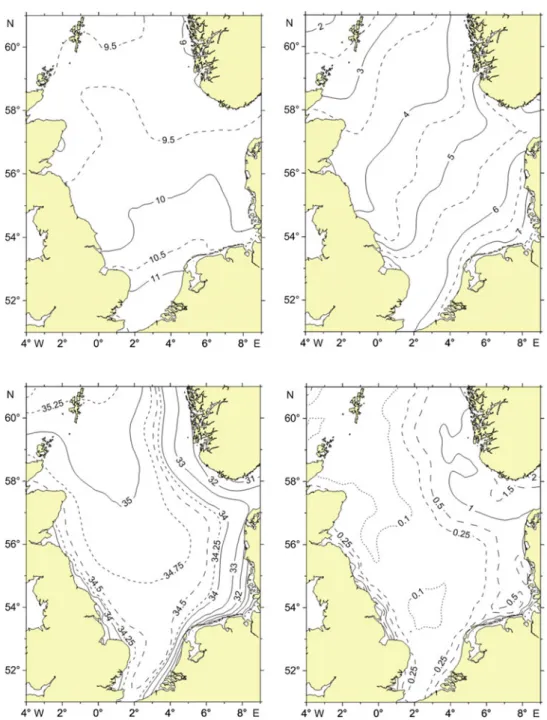
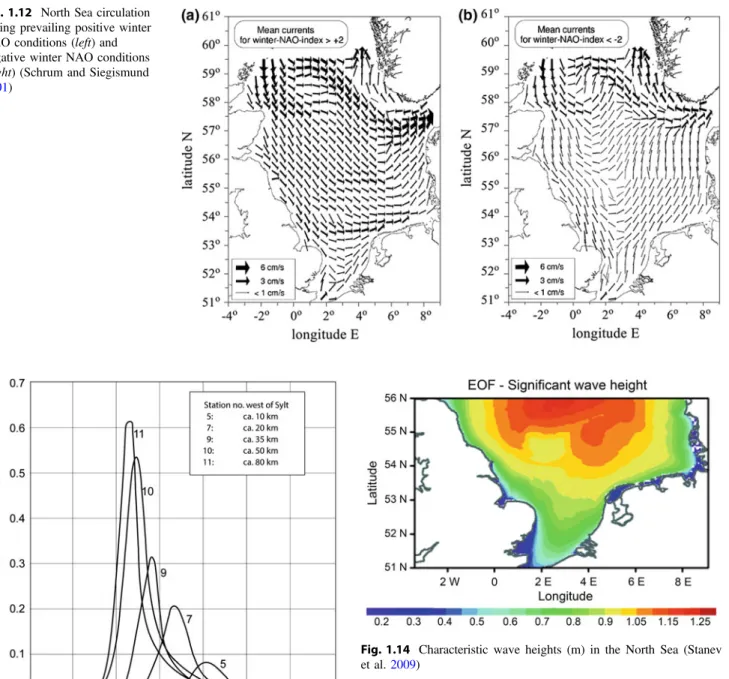
The thermodynamic state of the North Sea is characterized by the 4-dimensional distributions of temperature and. The strong seasonal variation in sea surface temperature is the most obvious low-frequency periodic feature in the North Sea. The wind-induced circulation is clearly the dominant permanent regime, which characterizes the mean current system of the North Sea.
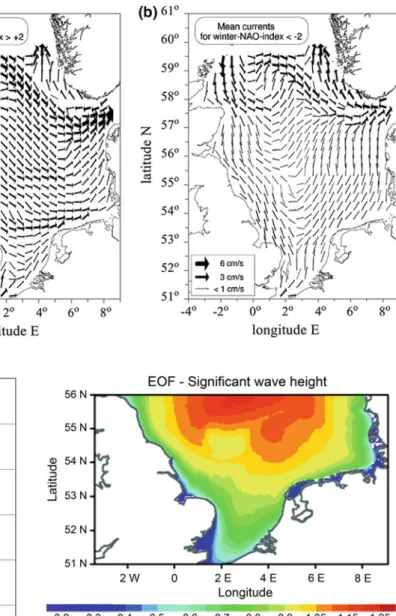
Storm surges are the greatest potential natural hazard for coastal communities in the North Sea region. The specific geometry of the North Sea basin implies natural periods and therefore resonance in the semi-diurnal spectral range (Fig.1.15).
Current Atmospheric Climate
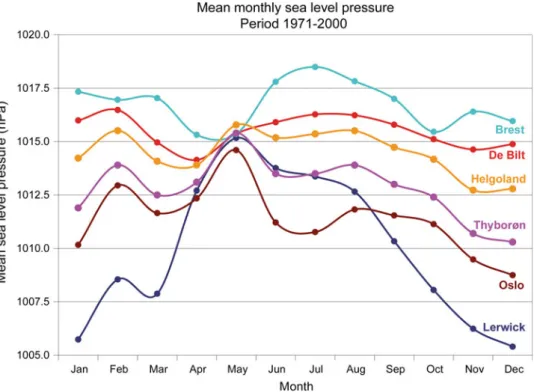
The circulation in the North Sea region is strongly influenced by the North Atlantic Oscillation (NAO). The graphic shows a decrease in geostrophic wind speed from northwest to southeast and a wind speed of 10.5–11.5 m s−1 in the central part of the North Sea. Figure 1.24 shows the annual frequencies of wind force observed from ships during the period 1971–2000.
Due to the orography, the wind comes most often from the south only in the sea areas between the Shetland Islands and the Norwegian coast (Viking, Utsira north); west of the southern Norwegian coast (Utsira south) the winds from the northwest predominate. Table 1.1 shows the annual frequency of the different sea breeze types for each coastline during the period 1 January to 31 December 2012. The annual air temperatures from the ERA-40 reanalysis are roughly 7.0–8.0 °C in the coastal areas of Norway and Sweden and 12–13 °C in the western English Channel.
The annual cycle of mean air temperature at land stations in the North Sea region is shown in Figure 1.26. Heating in summer is lowest in the extreme north-western area (Lerwick in the Shetland Islands), where the highest average monthly temperature is only 12 °C (August). The highest winter temperatures are in Brest, in the western part of northwestern France, due to the influence of the North Atlantic current.
In the inflow area between Scotland and the Shetland Islands it is about 0.4 °C in July (Michaelsen et al.2000). Spring is the driest season except in the western English Channel and the region around the Shetland Islands. In winter there is a clear correlation between precipitation amount in the northern North Sea region and the NAO.
Annual cycles for some land stations in the North Sea region are shown in Figure 1.30. Changes in day length throughout the year show a predictable pattern with the duration of solar radiation in the North Sea region being highest in summer and lowest in winter. From May to August, the duration of solar radiation in the northern and western parts of the North Sea and the English Channel is about 20-50 hours less than in the southern and eastern parts.
In the North Sea region, average annual global irradiance increases from north to south with the highest annual average irradiance of 130–140 W m−2 in the English Channel, for results obtained from observations of the MVIRI instruments on the geostationary Meteosat -satellites for the period compared Fig. S1.5.11 in the E-Supplement). A comparison of the mean annual cycle in cloud cover derived from the CLARA dataset and ERA-40 over the German Bight for the period 1982–2002 shows an underestimation in the reanalysis data, which is smallest in winter and highest in the summer is (Bülow et al.2014).
Marine and Coastal Ecosystems
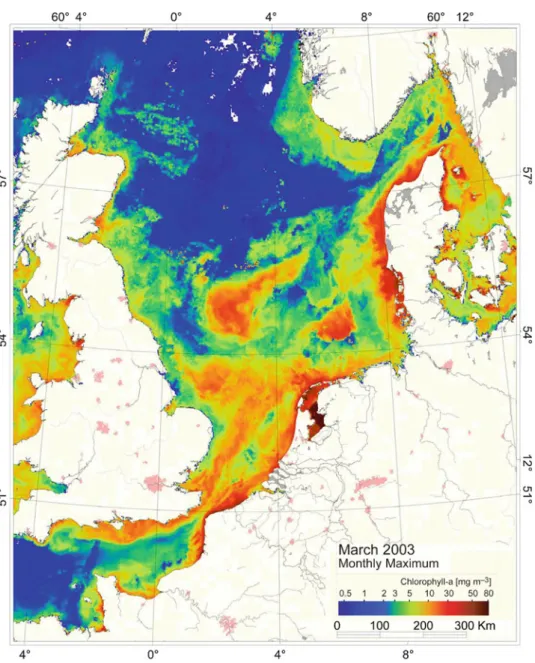
The spring phytoplankton bloom is initiated in the southern regions of the North Sea (south of the Dogger Bank) in late winter/early spring, developing later in the northern North Sea (Colebrook and Robinson 1965). An average winter nitrate concentration in the central North Sea was estimated at about 8 μmol l−1 (Brockmann and Wegner 1996). The atmosphere, the Atlantic current and some rivers contribute to the total nutrient load in the North Sea.
Atmospheric nitrogen input to the North Sea is estimated at 300–600 kt (Richardson and Bo Pederson1998). Annual new production from the input of nitrogen to the North Sea is roughly 15.6 million t C (Richardson and Bo Pederson 1998). Estimates of annual primary production in the North Sea are highest in coastal areas, and decrease northwards from the southern to the northern North Sea (see Table 1.4).
The annual production of secondary producers (formation of heterotrophic biomass) is estimated to be 2–20 g C m−2, with a higher production in the northern North Sea than in the Southern Bight (Fransz et al. 1991). Estimates of annual secondary and higher production for the North Sea are given in Table 1.5. More than 200 fish species live in the North Sea and their total annual productivity is estimated at 1.8 g C m−2 (Daan et al.1990).
In general, the number of demersal fish and their size composition in the North Sea have decreased since the beginning of the 20th century (Pope and Macer 1996). The sedimentary environment of the North Sea contains up to 5000 species of macrobenthic and meiobenthic invertebrates (Heip and Craeymeersch 1995). Sewage runoff, leaching from agricultural land and nitrogen deposition in the atmosphere are responsible for the high input of nutrients to the North Sea (Druon et al. 2004).
The amounts of most pollutants reaching the North Sea have decreased significantly since about 1985 (OSPAR2010; Laane et al.2013). Some of the persistent organic pollutants entering the North Sea are biologically amplified through the marine food web. Two examples of imported species are the American comb jellyfish Mnemiopsis leidyi which was first observed in the North Sea in 2006 (Faasse and Bayha 2006) and the Pacific oyster Crassostrea gigantea which was introduced in the 1980s on selected plots in the Wadden Sea that are used for shellfish farming (Drinkwaard 1998). .
Terrestrial Coastal Range Vegetation
Forests are an important nature type in the coastal vegetation in the North Sea region. Bellamy DJ, Edwards P, Hirons MJD, Jones DJ, Evans PR (1973) Resources of the North Sea and some interactions. Blackford JC and Gilbert FJ (2007) pH variability and CO2-induced acidification in the North Sea.
Daan R, Mulder M (1996) On the short-term and long-term impact of drilling activities in the Dutch sector of the North Sea. Janssen F, Schrum C, Backhaus J (1999) A climatological dataset for temperature and salinity in the North Sea and the Baltic Sea. Konradi PB (2000) Biostratigraphy and setting of the Holocene marine transgression in the Heligoland Channel, North Sea.
Nitrogen and carbon cycling in the North Sea and exchange with the North Atlantic - a model study Part II. Morphology of the southern North Sea coast from Cape Blanc-Nez (F) to Den Helder (NL). Luyten PJ, Jones JE, Proctor R (2003) A numerical study of the long- and short-term temperature variability and thermal circulation in the North Sea.
Meyer EMI, Pohlmann T, Weisse R (2011) Thermodynamic variability and change in the North Sea derived from a multidecadal pass. Pätsch J, Kühn W (2008) Nitrogen and carbon cycling in the North Sea and exchange with the North Atlantic - a model study. Pohlmann T (1996) Calculation of the development of vertical thermal stratification in the North Sea with a three-dimensional baroclinic circulation model.
Rehm P, Rachor E (2007) Benthic macrofaunal assemblages of the submerged Pleistocene Elbe valley in the southern North Sea. Richardson K, Visser AW, Bo Pedersen F (2000) Subsurface phytoplankton blooms stimulate pelagic production in the North Sea. Schiettecatte LS, Thomas H, Bozec Y, Borges AV (2007) High temporal coverage of carbon dioxide measurements in the southern gulf of the North Sea.