137
© Inter-American Development Bank 2016
M. Grazzi and C. Pietrobelli (eds.), Firm Innovation and Productivity in Latin America and the Caribbean, DOI 10.1057/978-1-349-58151-1_5
CHAPTER 5
The authors thank Rita Almeida, Gustavo Crespi, Matteo Grazzi, Carmen Pagés, Siobhan Pangerl, Carlo Pietrobelli, Graciana Rucci, Adam Szirmai, and Hong Tan for their valuable suggestions and com- ments, and Angela Zorro for her excellent research assistance. All errors are the sole responsibility of the authors.
One of the most urgent challenges faced by economies in Latin America and the Caribbean (LAC) is to increase the pace of their productivity growth, which is slow not only compared with developed countries but also with other developing and emerging economies (IDB 2013; OECD 2014). Sluggish productivity growth appears to be the main cause of the widening income gap between developed and LAC economies (IDB 2013; Pagés 2010; Daude and Fernández-Arias 2010).
As discussed in Chap. 1, increasing productivity in the region requires strategies that reallocate resources from less productive firms to more productive ones. Recent research, for example, recommends eliminating distortionary policies that artificially create incentives to invest in firms
On-the-Job Training in Latin America and the Caribbean: Recent Evidence
Carolina González-Velosa, David Rosas, and Roberto Flores
C. González-Velosa • D. Rosas Inter-American Development Bank
e-mail: [email protected] • [email protected] R. Flores
e-mail: [email protected]
with low formality and productivity levels (e.g. IDB 2013; Pagés 2010;
OECD 2014). However, efforts should also be made to increase within- firm efficiency through policies that improve production technologies and managerial processes and facilitate plant-level innovation. In this regard, a central issue concerns developing strategies that strengthen skill forma- tion in the workforce. New evidence shows that a major obstacle faced by many firms in the region is the lack of adequate skills in the labor force. Enterprises have difficulties filling their vacancies and many indi- viduals, especially younger people, cannot find jobs because of a mismatch between the skills learned in school and the skills demanded by the market (Bassi et al. 2012; Mourshad et al. 2011).
Thus, there is a clear need to reform the educational system to facilitate the transition of young people to the labor market. However, the agenda for change should not stop there, as human capital formation does not end with school. Approximately one-quarter of the human capital that individ- uals accumulate during their lives is achieved after the schooling process is completed (Heckman et al. 1998). Among the set of post- schooling invest- ments, on-the-job training (OJT) can play an essential role. Employer- provided training is especially crucial to developing and updating skills in a context in which preferences and technologies change rapidly (Almeida et al. 2012). Through OJT, workers can be more productive, adapt more easily to technological change, make more efficient use of capital and machinery, and have a positive effect on the performance of their peers.
However, despite the potential of this type of investment, very little is known about OJT practices in LAC. Not only is there little evidence about the returns on OJT, but there is scant information on its basic char- acteristics, such as the frequency, content, and beneficiaries (Hunneus et al. 2011). This study aims to contribute to this literature by analyz- ing two business surveys, which, to our knowledge, are the only ones in LAC with comparable cross-country data on OJT practices: the Survey on Productivity and Human Resources Training in Establishments (EPFE by its Spanish acronym) and the World Bank Enterprise Surveys (WBES).
Both surveys use a broad definition of OJT, encompassing all types of training offered by firms to their active workers.
Our contribution to the literature is threefold. First, we characterize OJT practices in the region by describing the basic characteristics of these invest- ments. Both the EPFE and the WBES draw their samples from firms in registered directories, which restricts our analysis to the formal sector of the economy. Second, by examining correlates and determinants of the training
decision, we provide suggestive evidence of the role of different market fail- ures and constraints affecting OJT investments in LAC. Third, we provide additional evidence of the productivity effects of OJT practices in the region.
The rest of the chapter is organized as follows. We review the existing lit- erature and then discuss the data and present stylized facts that characterize OJT in LAC. We present an analysis of the determinants of training invest- ments among firms in the region, and then provide estimates of the wage and productivity effects of OJT. Finally, we make some concluding remarks.
E
xistingL
itEraturEThe literature on the impact of employer-provided training goes back to the seminal work of Becker (1964). This body of work states that, in a relatively flexible labor market, financing training and its effect on wages depends on the type of skills taught. General training enhances skills that are relevant not only to the firm in which the worker is employed but also to other firms. Since workers can increase productivity elsewhere, the market rewards this training with higher wages. In contrast, a worker’s wage does not increase with training in specific skills, since such skills only increase productivity in the firm where he or she currently works.
Given that a worker with general skills may leave for another job at any time, the firm has no incentive to pay for training for these skills. Any pro- ductivity gains that the firm may benefit from will be offset by the higher wages that have to be paid to retain the worker. Therefore, general training is financed by workers indirectly through lower wages during the training period. Firms, on the other hand, have incentives to finance specific train- ing as they may reap the benefits through larger productivity gains.1
Thus, in flexible labor markets, the rents from general training will be appropriated by the worker via higher wages, leaving firms with no incen- tive to invest in this kind of training. This appropriation problem may lead to investment in general skills training below the socially desirable level.
This problem is the first of several market failures that could limit the deci- sion to invest in OJT. Table 5.1 briefly enumerates market failures that affect OJT. A second market failure comes from credit constraints, which could limit the investments of employers who have difficulty accessing credit to finance OJT, even if such investments are profitable in the long run (see Chap. 8). Also, information problems can occur if employers do not have important information about key aspects of OJT, such as training techniques, training providers, benefits, and costs.
In addition to these three market failures, which limit the supply of employer-provided training, there are also failures that affect demand for OJT (Table 5.1). The first is barriers to technological adoption. Training demand is derived demand in that training requirements depend on pro- duction decisions. If a firm does not adopt innovative technologies that require more skilled personnel (for whatever reason), it will not need to invest in training. Thus, OJT investments are affected by a variety of mar- ket failures (credit, information, and externalities) that constrain adoption of more skill-intensive technologies and production systems. Similar con- siderations apply to possible constraints to the adoption of sound mana- gerial practices. For example, credit constraints, lack of information, or labor regulations could limit a firm’s ability to invest in modern mana- gerial practices (e.g. performance incentives, profit sharing, analysis and feedback, mentoring, and employee participation in decision-making).2
Motivated by this framework, many researchers have tried to estimate the effects of employer-provided training. Most of the literature focuses on estimating private returns: studies that use firm data look at the effects on productivity, while studies that use employee data estimate wage effects.
Very few studies directly compare results between general and specific train- ing, given the difficulty of empirically observing the degree of specificity.
Table 5.1 Market failures that affect OJT Restrictions to
training supply Appropriation
problems Firms do not have incentives to provide general (portable) skills training because they do not appropriate the rents of this training.
Credit constraints Firms have limited resources or credit to finance training, even if it is profitable in the long run.
Information asymmetries and uncertainty
Firms have incomplete information or uncertainty about key aspects related to the benefits, costs, techniques, and providers of OJT.
Restrictions to
training demand Limits to the adoption of skill-intensive production technologies
Firms face barriers that limit the adoption of skill-intensive technologies, thereby reducing human capital requirements and, therefore, the demand for training (e.g., credit constraints, information asymmetries, lack of insurance, and externalities).
Limits to the adoption of modern managerial practices
Credit constraints, lack of information, and labor regulations limit innovation in managerial practices and the adoption of high-performance workplace incentives that increase the productivity of training.
Source: Authorsʼ elaboration
The current literature faces two important methodological chal- lenges. First is the difficulty of measuring OJT. The definition of OJT can incorporate both formal training programs and informal learning-by- doing. Moreover, aspects such as duration or costs are difficult to calcu- late. Second, OJT can be associated with productivity and wages without reflecting a causal relationship. Other factors, such as the level of techno- logical development or management skills, can make firms more produc- tive. These same factors could be facilitating investment in OJT, creating a positive association between OJT and productivity that does not reflect a causal relationship. Likewise, the decision to invest in training a particular worker may be determined by attributes of the worker that impact pro- ductivity, such as, for example, educational attainment.
The vast majority of this literature uses data from developed coun- tries and, despite the differences in the nature of the data and meth- odologies, studies generally show that OJT increases firm productivity and worker wages. However, there is no consensus on the magnitude of these effects. In order to address the endogeneity of the OJT deci- sion, many studies use fixed effects or dynamic panel-data models which in most cases find large, positive impacts (e.g. Bartel 1994; Almeida and Carneiro 2008). A meta- analysis by Haelermans and Borghans (2012) reported that the average effect on wage returns of workers who received OJT is 2.6 % per course. Fewer studies exploit exogenous changes in the decision to estimate the effects of training and, in con- trast, find relatively small impacts (e.g. Leuven and Oosterbeek 2004, 2008). However, as discussed by Bassanini et al. (2005), it is unclear whether the results from this group of studies are generalizable given that samples are small and specific.
In developing countries, the evidence is much scarcer, largely due to limitations on the availability and quality of data. Applying matching tech- niques on data from manufacturing firms in Kenya and Zambia, Rosholm et al. (2007) found very large positive effects: the average effect of receiv- ing training in the year leading up to the survey was a 20 % increase in wages. Ibarrarán et al. (2009) estimated the impact of training with instru- mental variables constructed from segments of firms with similar charac- teristics and, in general, found that training increased productivity. Finally, Rodríguez and Urzúa (2011) used data from administrative records to measure the impact on Chilean workers who received training as a result of the Chilean government’s tax exemption program. They found that, in most cases, participation in the subsidy program had no positive impact on either the wages or the employment of participants. Only programs of
longer duration produced marginal impacts, slightly above zero, but this type of course is only offered in 1 % of cases. The authors also found no evidence of the effects of the program on hiring new workers.
Given the gaps in this literature, it is not surprising that there is practi- cally no evidence regarding the social returns on OJT in LAC (Almeida et al. 2012). In fact, when it comes to social returns, even the literature for developed countries is lacking (Bassanini et al. 2005). This poses an important challenge for policy design.
D
ataWe use the only two business surveys that, to the best of our knowledge, have cross-country comparable information on OJT in LAC. The first one is the WBES which has information about OJT for 12 countries in the region and longitudinal data for an important subset of countries.
The second one is the EPFE, which has been used in various coun- tries in LAC with the support of the Inter-American Development Bank (IDB). This cross-sectional survey includes detailed questions about OJT that are not included in the WBES or other traditional business surveys, such as the components of OJT, its beneficiaries, and the sources of fund- ing for training. At the time of writing, EPFE cross-sectional data was available for the Bahamas, Colombia, Honduras, Panama, and Uruguay from surveys collected between 2011 and 2013.3 In every country except Colombia, surveys were representative at the national level. In Colombia, sampling was designed to make the survey representative at the sectoral level for three specific sectors: manufacturing, commerce, and services.
Due to space limitations, the tables and graphs in this chapter refer only to the figures corresponding to the manufacturing sector. We discuss the results for the other sectors in the endnotes.
OJt
inLaC: P
raCtiCEs, P
OLiCiEs,
anDD
EtErminantsIncidence and Intensity
Table 5.2 shows that, in almost all the sampled countries in LAC, at least a quarter of the surveyed firms offer some type of formal training to their full-time workers in a given year, and in many countries this share exceeds 50 %.4 However, training levels vary widely from country to country. As we discuss later in this chapter, this cross-country variation is likely associ- ated with factors such as the size and technology level of the firms.
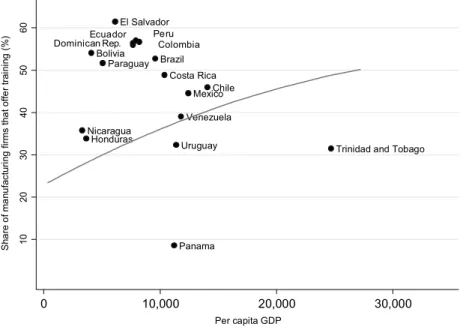
Because of the lack of information about the social returns on train- ing, it is not possible to know if there is under-investment in OJT in LAC. However, we can see that the levels of OJT in the region are rela- tively high compared to countries with similar income levels. Figure 5.1 illustrates this point. The line shows the average incidence of training in a Table 5.2 Incidence and intensity of on-the-job training in LAC (sorted by incidence)
Country Reference
year Incidence: proportion of firms that offer training
(%)
Intensity: proportion of workers trained in manufacturing firms
that offer training (%)
El Salvador 2010 60.4 54.1
Argentina 2010 58.1 61.2
Peru 2010 57.0 62.0
Colombia 2010 56.7 78.8
Ecuador 2010 56.4 65.0
Dominican
Republic 2010 55.9 46.1
Bolivia 2010 54.1 43.8
Barbados 2010 53.1 n.a.
Brazil 2009 52.7 67.3
Paraguay 2010 51.7 61.0
Costa Rica 2010 48.9 71.0
Bahamas 2010 46.9 n.a.
Chile 2010 45.9 49.2
Mexico 2010 45.1 62.6
Guatemala 2010 43.6 67.7
Venezuela 2010 39.0 74.5
Nicaragua 2010 35.2 59.2
St. Kitts & Nevis 2010 35.0 n.a.
Saint Lucia 2010 34.2 n.a.
Honduras 2010 33.8 58.0
Uruguay 2010 32.3 38.1
Trinidad and
Tobago 2010 31.5 42.1
Jamaica 2010 26.1 41.8
Dominica 2010 22.4 n.a.
Panama 2010 8.6 67.6
Source: Authors’ elaboration based on WBES data
Notes: Calculation of the proportion of firms that train is based on the question: “During the [reference]
fiscal year, did this establishment offer formal training programs for its full-time permanent employees?”
Calculation of the proportion of workers trained in manufacturing firms is based on the question: “With respect to formal training programs for the [reference] fiscal year, what percentage of full-time permanent workers received formal training?” n.a. = not applicable
set of 107 non-LAC countries. The points, which represent the incidence of OJT in LAC countries, are mostly located above the line. Thus, the incidence of OJT in LAC is generally higher than in other countries with similar per capita income. The only exceptions are Trinidad and Tobago, Uruguay, and Panama.
However, measures of incidence do not differentiate between firms that train many workers and those that train a few. For this reason, we also consider intensity indicators, which measure the proportion of workers trained. Because of the design of the WBES, this indicator can only be calculated for the manufacturing sector, where firms that pro- vide OJT programs typically train between 38 and 78 % of their work- ers (Table 5.2). The intensity of OJT can also be measured in terms of training duration. These figures, available only for the EPFE surveys conducted in Honduras and Uruguay, show that firms typically invest between 17 and 41 hours per year in training their workers. This is not
Bolivia Brazil
Chile Costa Rica
Honduras
Mexico Nicaragua
Panama Paraguay
El Salvador
Trinidad and Tobago Uruguay
Venezuela
102030405060Share of manufacturing firms that offer training (%)
0 10,000 20,000 30,000
Per capita GDP Dominican Rep.Ecuador PeruColombia
Fig. 5.1 Incidence of training in LAC and the rest of the world
Source: Authors’ calculations based on WBES data
Notes: The line shows the average incidence of training in a set of 107 non-LAC countries
very different from the levels seen in Europe.5 However, this type of cross-country comparison should be considered with caution because of the differences in measurement and definitions.
Beneficiaries of OJT: High- vs Low-Skilled Workers
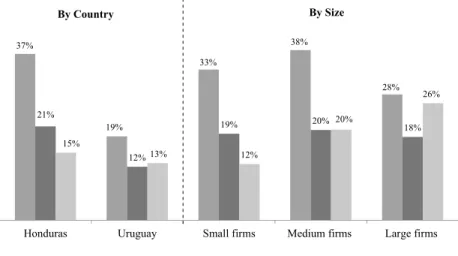
Evidence from developed countries consistently shows that high-skilled workers are not only more likely to be trained, but the training they receive is also more intensive (e.g. Bassanini et al. 2005; Bishop 1996; Heckman 2000; Frazis et al. 2000). This coincides with previous findings for LAC from Hunneus et al. (2011) and with the new findings we obtain from the EPFE, which show that low skilled workers in Honduras and Uruguay receive relatively shorter training.6 Moreover, the share of workers that receives training is higher for skilled than for low skilled workers, especially in Honduras and in small firms (Fig. 5.2).
If OJT is differentially targeted to the higher skilled workers, these investments will only help to amplify the skill gaps in the workforce.
Fig. 5.2 Share of workers that received training by occupational category
Source: Authors’ elaboration based on the EPFE
Notes: Small firms, 1 to 20 employees; medium firms, 21 to 100 employees; large firms, over 100 employees
This is why some governments implement policies to stimulate training for workers with lower education levels. However, the literature that uses European data casts doubt on the cost-effectiveness of these efforts given how difficult it is to stimulate OJT for less skilled workers if the returns on these investments are very low (Bassanini et al. 2005). Recent evidence from Chile also points in this direction. A revision of the franquicia tribu- taria, a tax deduction for OJT, shows that firms mostly use it to train the more educated workers even though the value of the deduction declines with the worker’s skill level (Ministry of Labor of Chile 2011). This high- lights the importance of complementary efforts outside the workplace to increase the skills of the workforce, such as those aimed at building a life- long training system.
Contents of OJT: General vs Specific
Results from the EPFE show that, when deciding the content of train- ing, firms in LAC give priority to the technical skills that are relevant in the workers’ current jobs and not to general skills.7 This result is robust to restricting the sample for different countries or firm sizes (Fig. 5.3) and is consistent with Bassi et al. (2012) on Chile, Argentina, and Brazil.
This result is worth emphasizing for two reasons. First, as discussed earlier, even though training in specific skills can have a positive effect on productivity, it will likely have little impact on wages. This should be taken into account in the design of policies that target distributional goals.
Second, recent evidence for LAC shows that socio-emotional or behav- ioral skills are the most highly valued by employers and the most difficult to find in the labor market (Bassi et al. 2012).8 However, the fraction of firms that give priority to behavioral skills is much lower than the propor- tion that prioritizes specific skills. This is consistent with the results of the study by Bassi et al. (2012) in Argentina, Chile, and Brazil, which showed that even firms that have the greatest difficulties in fulfilling their require- ments for socio-emotional skills tended to offer more training in specific skills.
The tendency to give more training in specific skills may result from a firm’s lack of capacity (e.g. methodologies and technologies) to teach general skills. It may also reflect the disincentives that arise due to a lack of appropriation given that, as discussed below, most of the OJT in the region is financed by the employer.
Financing OJT
Results from the EPFE show that, to finance OJT, firms typically allocate a fraction of their operating costs, ranging from 2 to 4 %, depending on the firm size. Moreover, since training usually takes place during working hours, firms generally also bear the extra costs in worker productivity as a result of hours missed.9 Data from EPFE suggests that in LAC, OJT is mostly financed by the employers. Table 5.7 (in the Appendix) shows that, regardless of firm size or country, at least 70 % of firms finance OJT with their own funds. Only a small percentage expects employees to use their personal funds or use public financing. However, due to the characteristics of the data, indirect financing by the employees through wage reductions cannot be ruled out.
Interestingly, in LAC, using public resources to finance OJT is no more frequent among small firms than among large- and medium-sized ones (see Table 5.7 in the Appendix). This result is consistent with the findings Fig. 5.3 Proportion of firms that train by prioritized skill
Source: Authorsʼ calculations based on the EPFE
Notes: Figures calculated only for firms that train. Because respondents had the option of choosing more than one skill, the sum of the percentages in each category is not 100 %. Data for Colombia shown in this figure are calculated with the sample of firms in the manufacturing sector. Firms in the commerce and services sectors in Colombia display the same pattern, with the majority prioritizing training in specific skills. The option “does not prioritize” was not included. Due to special confidentiality protocols by the statistics office in Colombia, the authors of this study were unable to aggregate the data from Colombia with that of other countries to build the indicators by firm size
for other regions (Almeida et al. 2012) and also resonates with the lit- erature on R&D incentives, which has documented that firms are more likely to apply for R&D tax credits if they are large and have the capacity for innovation.10 To the extent that small firms face fewer credit restric- tions and higher net returns, the subsidies might finance investments that would have happened anyway. Evidence of similar deadweight losses have also been documented in the literature that analyzes the effectiveness of incentives for R&D and innovation.11
In addition to subsidies and tax incentives (e.g. Chile and Uruguay), governments in LAC participate in the training market by directly provid- ing free or low-cost training through public training institutes (e.g. SENA in Colombia or SENAI in Brazil). The evidence from the EPFE suggests that the role of these institutions in providing OJT is not significant:
regardless of country and size, the share of firms that exclusively use exter- nal providers to deliver training is no greater than one-third. Moreover, the majority of firms that offered training with an external provider relied on a private institution (see Table 5.7 in the Appendix).
Results from the WBES also show that only a minority of firms in the region use public funding for their training initiatives. In this sur- vey, respondents were asked: “During the last 3 years, did this establish- ment receive any public support (financial or otherwise) for training?”
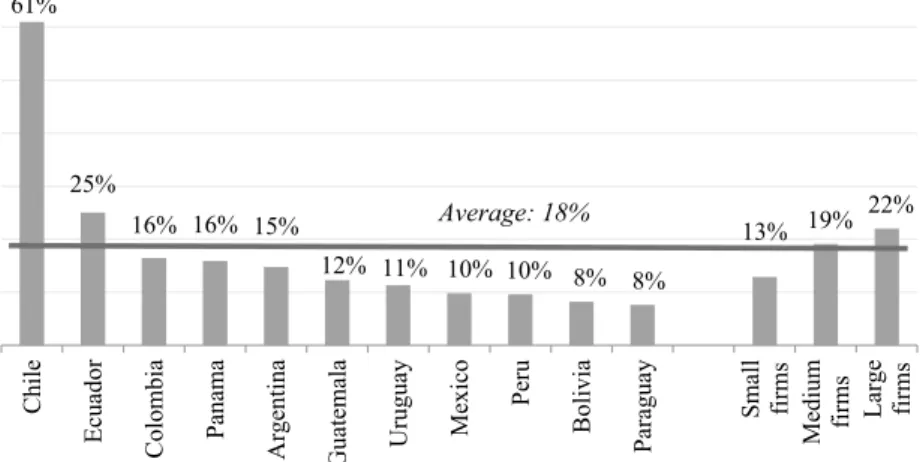
Despite the lack of specificity of the question, which could refer to any type of government support (e.g. public subsidies, technical support, or direct provision of training), of all the firms that trained, the percent- age of firms that received public support was on average 18 (Fig. 5.4).
Moreover, in 6 of the 11 countries, this percentage was less than 15.
Chile is one exception, where over 60 % of firms received public sup- port. This is likely due to the high level of coverage of the franquicia tributaria.12 Importantly, small firms use public support for training less than large enterprises, at only 13 % receiving any kind of public support compared to 22 % for large firms.
The low utilization of public instruments to promote OJT in LAC may be due to insufficient coverage. It may also reflect a lack of relevance, if these instruments do not target the market failures or barriers that firms face in the training decision. Unfortunately, the empirical literature does not shed light on this issue. As discussed previously, little is known about the market failures faced by employers in their decision to train, posing an important challenge in the design of policy instruments, whose relevance can only be assessed in terms of the ability to alleviate barriers to training
investments. Recent reviews of the literature on employer-provided train- ing in the international context have reached a similar conclusion (Almeida et al. 2012; Bassanini et al. 2005).
Determinants of OJT in LAC
Below we provide suggestive evidence on the key factors that affect the decision to train in LAC. The market failures enumerated in Table 5.1 guide our conclusions, including restrictions that affect both supply and demand for training. Three pieces of evidence suggest that restrictions on demand might play a key role in OJT decisions in the region.
First, results from the EPFE show that the main reason employers do not train is that they do not believe it is necessary. Table 5.3 shows that, regardless of the country or firm size, the most frequent reason firms do not train in Bahamas, Honduras, and Colombia is that it is not neces- sary.13 This finding resonates with previous evidence for Brazil and Central America.14 While this result may be interpreted as evidence of lack of demand, it may also indicate that there is imperfect information about the returns on training. The next most cited reason for not offering training is the high cost (Table 5.3).
61%
25%
16% 16% 15%
12% 11% 10% 10% 8% 8% 13% 19% 22%
Chile Ecuador Colombia Panama Argentina Guatemala Uruguay Mexico Peru Bolivia Paraguay Small firms
Medium firms Large firms
Average: 18%
Fig. 5.4 Percentage of firms offering OJT that received public support
Source: Authorsʼ calculations based on WBES data
Notes: Small firms, 1 to 20 employees; medium firms, 21 to 100 employees; large firms, over 100 employees
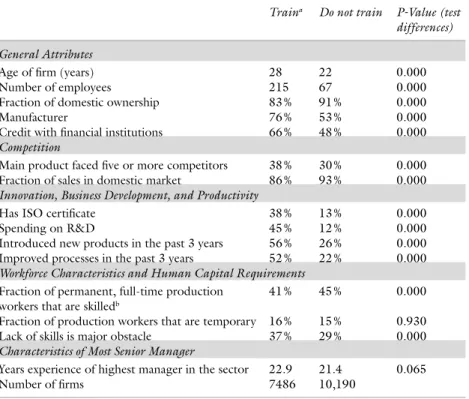
Second, firms that do not train claim to have fewer difficulties meeting their human capital requirements. This is shown by the EPFE data, which includes a question on whether human capital constraints are a major obstacle to firm productivity. Regardless of the country or firm size, the share of firms identifying human capital constraints as a major obstacle is higher among firms that train.15 A similar conclusion emerges from an analysis of WBES data.16 Table 5.4 shows that among firms that train, about one in three (37 %) state that an inadequately educated workforce is a “major” or “very severe” obstacle. For firms that do not train, this proportion falls to just over one in four (29 %).
Accordingly, limitations on human capital are a greater obstacle for the firms that train than for those that do not. This is likely associated with large differences in the production process, workforce characteristics, and personnel between these two groups of firms (Table 5.4). Firms that train are, on average, larger and older, have a higher probability of being in the manufacturing sector, and a higher probability of obtaining credit from financial institutions (see Chap. 8). They also have more links with foreign markets and face a greater number of competitors (see Chap. 9). There are Table 5.3 Percentage of firms that do not train by reason not to provide training
Bahamas Honduras Colombia Less than 50
employees 50 + employees Training was not useful;
waste of time 6.7 8.3 10.0 8.2 9.5
High cost 16.4 30.3 26.0 28.8 35.6
Does not know / has not found training institutions
5.8 25.5 5.8 24.1 20.0
Trained staff can leave
the firm 2.3 7.7 10.7 7.2 10.1
Not possible to measure
the benefits of training 3.9 4.0 n.a 4.1 1.5
No need to provide training; staff is sufficiently well trained
72.8 62.4 34.5 63.0 67.3
Source: Authorsʼ calculations based on EPFE
Notes: Each percentage measures the proportion of firms that did not train that chose each option as one of the two main reasons for not training. n.a. = not applicable
also differences with respect to practices of innovation and business devel- opment: firms that train also spend more on R&D and are more likely to have introduced new products and new or improved processes in recent years (see Chap. 2). Differences in the characteristics of the workforce are also present, such as the fraction of skilled workers and the experi- ence of the most senior manager. Interestingly, there are no significant differences regarding the share of temporary workers, an attribute that in theory could affect the incentives to train if more temporary workers lead to a greater appropriation problem.17
Table 5.4 Characteristics of firms that train vs. firms that do not train
Traina Do not train P-Value (test differences) General Attributes
Age of firm (years) 28 22 0.000
Number of employees 215 67 0.000
Fraction of domestic ownership 83 % 91 % 0.000
Manufacturer 76 % 53 % 0.000
Credit with financial institutions 66 % 48 % 0.000
Competition
Main product faced five or more competitors 38 % 30 % 0.000 Fraction of sales in domestic market 86 % 93 % 0.000 Innovation, Business Development, and Productivity
Has ISO certificate 38 % 13 % 0.000
Spending on R&D 45 % 12 % 0.000
Introduced new products in the past 3 years 56 % 26 % 0.000 Improved processes in the past 3 years 52 % 22 % 0.000 Workforce Characteristics and Human Capital Requirements
Fraction of permanent, full-time production
workers that are skilledb 41 % 45 % 0.000
Fraction of production workers that are temporary 16 % 15 % 0.930
Lack of skills is major obstacle 37 % 29 % 0.000
Characteristics of Most Senior Manager
Years experience of highest manager in the sector 22.9 21.4 0.065
Number of firms 7486 10,190
Source: Authorsʼ calculations based on WBES data
Notes: aThe variable that indicates whether the firm trained or not is constructed from the question: “Over fiscal year X, did this establishment have formal training programs for its permanent, full-time employees?”
where X is the reference year of the survey (2006 or 2010) bThis indicator is built from a question in the WBES survey that asked: “How many permanent, full-time production workers are skilled? How many are unskilled?”
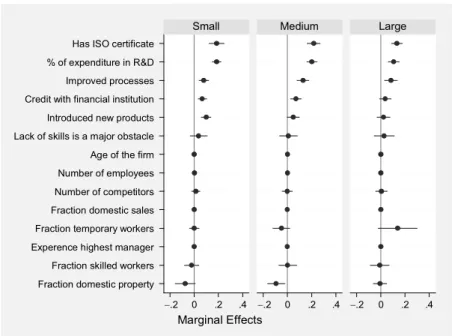
Finally, the third result shows that the most important determinants of the training decision are the variables that measure innovation. To docu- ment this, we use WBES data for 11 LAC countries collected in 2006 and 2010 to estimate a probit model of the decision to train. We use a rich set of covariates that measure the characteristics of the firm and of the work- ers.18 We also include dummy variables to control for country, year, and economic sector (manufacturing vs services). Separate estimates are made for the three subgroups of firms: small (less than 20 permanent employ- ees), medium (over 20 to 100), and large (over 100).
The results are shown in Fig. 5.5. The location of the circles on the horizontal axis shows the marginal effects on the probability of training when the covariates are set at their average value. In the case of dummy
Has ISO certificate
% of expenditure in R&D Improved processes
Introduced new products Lack of skills is a major obstacle Age of the firm Number of employees Number of competitors Fraction domestic sales Fraction temporary workers Experence highest manager Fraction skilled workers Fraction domestic property
−.2 0 .2 .4 −.2 0 .2 .4 −.2 0 .2 .4
Small Medium Large
Marginal Effects Credit with financial institution
Fig. 5.5 Determinants of the decision to train in LAC
Source: Authorsʼ calculations based on WBES data
Notes: This figure shows the results of probit models estimated with WBES data. The training variable is constructed from the question: “Over fiscal year X, did this establishment have formal training programs for its permanent, full-time employees?” where X is the reference year of the survey (2006 or 2010).
Country dummy variables are also included
variables, the marginal effects measure the effect of changing the variable from 0 to 1. Horizontal bars show the 95 % confidence intervals. The fig- ure shows that, regardless of firm size, the most important determinants of the decision to train are those that measure innovation and technological development. For example, for small firms, the probability of training is associated with an increase of 18 percentage points if the firm has a quality certificate, 19 percentage points if R&D expenditures increase by 1 %, and 10 percentage points if the firm has changed or improved its production processes in recent years. Interestingly, we find no difference in the mar- ginal effects of the variables that measure innovations in products versus innovations in processes, even though the literature has stated that these may have differential effects on skill demand and on employment. Recent evidence for LAC has shown that product innovation may be more com- plementary to skilled than to unskilled labor (Crespi and E. Tacsir 2012).
Having credit with a commercial bank is also a significant determinant of training for small and medium firms (7 and 6 percentage points, respec- tively), suggesting liquidity constraints on OJT investments. Interestingly, the measures of the degree of competition (i.e. the number of competitors faced by the main product or product line in the market and the fraction of domestic sales) are not associated with training either, even though firms in more competitive markets could have greater incentives and need to invest in the human capital of their workers.
It is important to emphasize that the characteristics of the workforce, such as the proportion of skilled workers, do not seem to be associated with the decision to train. The same applies to the share of workers with a tempo- rary contract, which is not statistically significant in any of the three models, even though this is a measure of turnover, which could lower a firm’s incen- tives to provide training in general skills because of the appropriation prob- lem. The study by Almeida and Aterido (2010) on small firms in developing countries also failed to find significant effects of worker turnover on OJT.
In summary, the three results presented in this section highlight the importance of the demand for skilled workers in the decision to train. The subset of firms that do not train may have fewer requirements for skilled workers, which could be associated with a lower degree of technological development. These results are consistent with the studies by Bassanini et al. (2005) for European countries and by Almeida and Aterido (2010) for developing countries.19 However, due to the available data, we can only examine correlations between the decision to train and the firms’ attri- butes, and no causal interpretation should be given due to endogeneity.
Nonetheless, even with these caveats, interesting conclusions emerge.
First, the results highlight the importance of information problems that could be generating a misperception about the returns on OJT among firms in the region. Second, given that the demand for skilled workers seems to be playing a key role in the decision to train, public policies that attempt to create incentives for OJT mainly through subsidies may be insufficient. More comprehensive policies that not only facilitate the pro- vision of training, but also aim to alleviate the constraints on technological adoption, may be required.
r
Eturns OnOJt
amOngm
anufaCturingf
irmsinLaC
As we noted earlier in this chapter, few studies provide empirical evidence about the productivity effects of OJT in LAC, probably due to the absence of adequate data. In this section, we make an effort to contribute to this literature. We take advantage of a longitudinal sample of manufacturing firms in 11 LAC countries for which OJT information was collected in 2006 and 2010. Using this data, we estimate the effect of OJT on total factor productivity (TFP).20 Our empirical model is motivated by a simple conceptual framework. We assume a Cobb–Douglas production function to describe the technology of firm i:
Yi =A K Ei iα iβ (5.1) where Yi is output, Ai is an efficiency parameter, Ki measures the capi- tal stock, and Ei is a measure of effective work. Following Dearden et al.
(2000) and Zwick (2006), we define effective work as the weighted sum of trained, LCi, and untrained, LNi, labor:
Ei =γLCi+LNi (5.2)
where γ is greater than zero if the training has a positive impact on produc- tivity. Substituting equation 5.2 in equation 5.1, and defining H L
i Lci
i
= as the proportion of workers in which the firms make human capital invest- ments by training, gives:
Yi =A Ki iα
(
1+(
γ −1)
Hi)
βLiβ (5.3)Taking logs from equation 5.3 and with some algebra, we obtain the empirical model21:
yit =βh ith +βl itl +βk itk +xit +ai+εit (5.4) where yit is the logarithm of output, hit measures the intensity or incidence of training, lit is the log of hours worked by permanent and temporary employees, and kit is the logarithm of the value of the assets.22 The term ai is a fixed effect that measures time-invariant firm characteristics such as structural efficiency, administrative quality, and industrial relations, and εit
is a time-varying error term. The subscript t denotes the years 2006 and 2010, for which longitudinal data were collected.
The objective is to estimate the parameter βh. In this effort, we face two methodological challenges. First, time-invariant attributes of the firm, ai, can have an impact on both productivity and training. For example, greater managerial capacity may lead to higher levels of productivity and increase OJT investments. Second, training, input allocation, and produc- tion decisions are affected simultaneously by unobservable productivity and demand shocks that vary over time, such as changes in work legisla- tion or the introduction of a new product.
We therefore estimate equation 5.1 in two stages. In the first stage, the impact on the productivity of the production factors of capital and labor is calculated using the Levinsohn and Petrin (2003) technique. By using the cost of intermediate inputs to approximate unobservable pro- ductivity shocks, this technique, under certain assumptions, addresses the problem of endogeneity of the capital and labor inputs.23 In the second stage, we estimate the impact of training on productivity using a methodology that combines firm-level fixed effects with a broad set of time-varying controls. The dependent variable is the measure of TFP, vit, obtained as the residual of the production function estimated in the first stage with the Levinsohn and Petrin algorithm. The equation to estimate is described by:
vit =βh ith +βx itx +δi +αt+µit (5.5) where the term δi corresponds to a vector of firm-level fixed effects. With these fixed effects we can control for time-invariant unobserved factors that may be simultaneously correlated with productivity and training.
The term αt is a year dummy that controls for confounding aggregate-level factors that may have simultaneously affected productivity and training, such as the national business cycle.
However, even including this set of controls, the estimate of βh would be biased if the error term μit contains firm-specific time-varying shocks that simultaneously affect productivity and the decision to train. The lack of appropriate data to construct instrumental variables prevents us from implementing this identification strategy. Hence, in addition to using fixed effects, the estimate includes a series of exogenous variables at the firm level that vary over time. These variables, denoted as xit in equa- tion 5.2, are constructed from interactions between the dummy indicat- ing the year and a rich set of predetermined 2006 variables, including the number of employees, economic subsector, existence of quality cer- tificates, product and process innovation, expenditures in R&D, propor- tion of sales in the domestic market, existence of credit in the formal financial sector, an indicator of private and foreign ownership, share of skilled workers, share of temporary workers who are skilled, and the pro- portion of temporary employees. With this rich set of controls, we try to capture productivity shocks that can be associated with the training decisions.
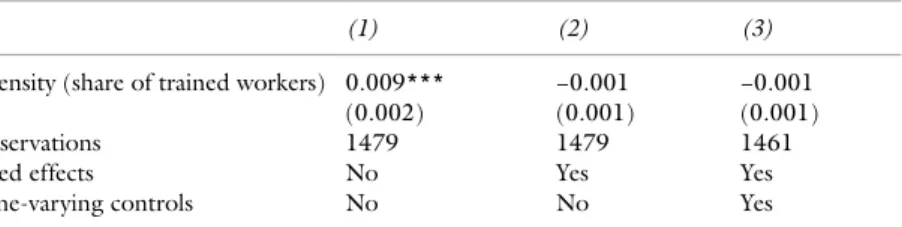
Table 5.5 presents the estimates for equation 5.5, in which the depen- dent variable is the log of TFP. The endogenous variable of interest mea- sures the intensity of training, calculated as the share of permanent workers who received training in the reference year. Column 1 reports the results of OLS models with no controls. Column 2 shows the results after adding firm-level fixed effects. Finally, column 3 shows the results after adding Table 5.5 Estimates of the impact of training on productivity
(1) (2) (3)
Intensity (share of trained workers) 0.009***
(0.002) −0.001
(0.001) −0.001
(0.001)
Observations 1479 1479 1461
Fixed effects No Yes Yes
Time-varying controls No No Yes
Source: Authorsʼ calculations based on WBES data
Notes: This table presents estimates of the effect of increasing the proportion of trained workers. Estimates were obtained using value added per worker as an alternative measure of productivity and, similarly, no statistically significant training effects were found. Standard errors are in parentheses.
* Coefficient is statistically significant at the 10 % level, ** at the 5 % level, *** at the 1 % level; no asterisk means the coefficient is not different from zero with statistical significance
fixed effects and the complete vector of time-varying firm-level exogenous variables, xit.
Column 1 shows a positive correlation between TFP and the intensity of training. A 1 percentage point increase in the proportion of skilled workers is associated with a 0.9 % increase in productivity. As mentioned previously, this parameter cannot be interpreted as a causal estimate of the effect of training because of possible time-varying shocks and unobserved firm heterogeneity that simultaneously determine training and production decisions. Column 2 shows that, with firm-level fixed effects, the estimate has a much smaller magnitude and is not statistically significant, a result that confirms the importance of correcting for unobserved firm heteroge- neity. Column 3 shows that these estimates remain stable after a rich set of time-varying controls are included.
Table 5.6 shows the results of an alternative version of equation 5.2 that models the heterogeneous effects of training. We consider four alternative Table 5.6 Heterogeneous effects of training
Panel A: Size and Age of the Firm
(1) (2) (3) (4)
Intensity −0.001
(0.001) −0.001
(0.001) −0.001
(0.001) −0.001 (0.001) Intensity × large firm 0.006*
(0.004) 0.007*
(0.004) n.a. n.a.
Intensity × improved processes n.a. n.a. −0.003
(0.002) 0.002 (0.002) Panel B: Fraction of Female and Temporary Workers
(1) (2) (3) (4)
Intensity −0.001 −0.001 0 0
(0.001) (0.001) (0.001) (0.001) Intensity × high fraction of
skilled workers 0.000 0.001 n.a. n.a.
(0.003) (0.004) Intensity × high fraction of
temporary workers n.a. n.a. −0.005 −0.006*
(0.003) (0.003)
Observations 1479 1461 1479 1461
Firm-level fixed effects Yes Yes Yes Yes
Time varying controls No Yes No Yes
Source: Authorsʼ calculations based on WBES data
Notes: This table presents estimates of the effect of increasing the proportion of trained workers. Standard errors are in parentheses.
* Coefficient is statistically significant at the 10 % level, ** at the 5 % level, *** at the 1 % level; no asterisk means the coefficient is not different from zero with statistical significance. n.a. = not applicable
sources of heterogeneity to examine if there are differential effects according to the characteristics of the firm (i.e. size and innovation) and characteristics of the workers (i.e. contractual stability and skill level).
Columns 1 and 2 of Panel A show the result of estimates that extend equation 5.2 with an interaction term between the intensity of training and a dummy variable indicating whether the firm had over 100 employ- ees in the baseline year, 2006. Columns 3 and 4 of Panel A show the results of replicating the exercise with a dummy variable that indicates if the firm improved processes in the three years before the baseline.
Columns 1 and 2 of Panel B show the result of models in which the interactions are constructed to indicate if in 2006 more than 60 % of employees were temporary. Finally, in columns 3 and 4 of Panel B, the interactions show that in 2006 more than 75 % of permanent employees were skilled. All models include firm-level fixed effects, but the time- varying controls are only included in the models presented in even-num- bered columns.
The results show that the impact of training on productivity for firms with over 100 employees is positive. A 1 percentage point increase in the proportion of trained employees raises productivity by 0.6 or 0.7 %, depending on the specification. The magnitude of this effect is similar to the estimated effect by Zwick (2006) for German firms. No differential effects are found for firms that innovate more or for firms that have more skilled workers, in spite of evidence suggesting the existence of comple- mentarities between OJT, innovation, and the skill level of workers. The absence of these effects could be due to imprecise measurements, and we recommend that further research be done in this area. Finally, for firms with a high share of temporary workers, increases in training intensity seem to have a marginally significant negative effect on productivity, although this result is not robust to both specifications.
Our results suggest that training has a positive impact on productivity only for larger firms. This may be because, as firms grow, there are larger spillover productivity effects from trained workers to a greater number of untrained workers. Middleton et al. (1993) suggested an alternative explanation, stating that the existence of internal labor markets in large firms can result in higher returns from training because promotion oppor- tunities make it more attractive for workers to stay in the firm, reducing the appropriation problem. A third possibility is that firm size is corre- lated with good managerial skills and internal labor markets that reward
increased productivity by profit sharing and promotion (Lazear 1995).
Finally, it is possible that larger firms provide a better quality of train- ing due to the economies of scale of investing in training programs and technologies.
As a final caveat, we should mention two reasons why in these esti- mations there may be an attenuation of the true training effects. First, because of the characteristics of the data, we are only able to estimate the contemporary effects of training on productivity and wages. However, as we mentioned previously, most of the training takes place during working hours, which means that workers spend less time on production. There is, in fact, evidence from developed countries that the level of worker produc- tivity falls during training (Bartel 1994; Dearden et al. 2000). Thus, the productivity impact of training could be low or negative in the immediate term and positive in the medium or long term. This could also explain the negative effects on the subset of firms with a high proportion of tempo- rary workers.
Second, measurement errors in the training variable can attenuate the estimated effect. This problem can be particularly severe in the type of models we estimate, which have fixed effects and only two periods of observations per firm. Even so, positive productivity impacts are found in larger firms. Thus, further studies are needed to provide more robust evidence of these impacts as well studies that identify the conditions (i.e.
characteristics of the firms, training, and workers) in which OJT is more productive, since this would certainly improve the targeting of policy interventions.
C
OnCLusiOnsOne of the most important challenges that LAC economies face is increas- ing the productivity of their workforces. In this effort, employer-provided training can play a key role by providing updated, relevant skills that are aligned with the demands of the market. In spite of their importance, little is known about the nature of the training investments made by firms in the region. This study aims to improve this knowledge.
We found that, in most countries in the region, between 30 and 50 % of firms offer training to their workers through programs that are usu- ally short, structured, and mostly targeted to the more skilled workers.
Training content prioritized job-specific skills, something that was consis-
tent with the fact that the majority of the training was financed with funds from the employer. Public subsidies for OJT were not often used and were more likely to be used by larger firms. Also, few firms seemed to use public institutions as external training providers.
We also presented evidence suggesting that, regardless of the firm size, the decision to train is determined by the firms’ demand for skills, which, in turn, is associated with innovation and the adoption of more advanced production technologies. Finally, we assessed the effects of training on wages and productivity. Point estimates showed that a 1 percentage point increase in the proportion of trained employees raised productivity by 0.7 %, but only in firms with more than 100 employees. We did not find evidence of wage effects from training. However, due to data limitations, our results should be interpreted with caution and may be a lower bound of the true effects.
Several policy recommendations emerge from these findings. First, the results are consistent with the view that providing training in general skills to low-skilled workers may have very low private returns for the firms. This highlights the importance of complementary policies to increase the skills of the workforce, such as developing lifelong vocational and educational training systems that allow workers to update their skills and reduce the skill gaps between individuals entering the workforce.
Our results also support the design of comprehensive interventions in which the instruments to promote OJT are part of a broader set of policies that foster technological transformation and innovation. Policies should take into account the coordination failure that may have caused some firms in the region to be caught in a low-technology low-skill trap.
This means that some firms are not able to adopt skill-intensive produc- tive technologies because of the lack of skilled workers and therefore do not invest in the human capital of their employees. Indeed, while this chapter shows that a lack of technology adoption limits human capital investments by firms, recent evidence shows that lack of skills impose serious constraints on the adoption of innovation in LAC (Hall and Maffioli 2008).
The results in this chapter also underscore the need for further research.
First, there is a need to assess the magnitude of the private returns to OJT and how these are distributed between firms and workers. This implies making greater efforts in data collection, either by conducting longitu- dinal surveys or using administrative data. An effort should also be made
to identify the complementary factors that make OJT productive, such as managerial decision-making. Suggestive evidence in this chapter indicates that OJT will have an impact on productivity if some of the attributes typical of larger firms are present. It is therefore important to identify the characteristics of the firms and personnel management practices required for training to be productive. Finally, an effort to identify the potential market failures that affect decisions about OJT is paramount to design evidence-based policies.
a
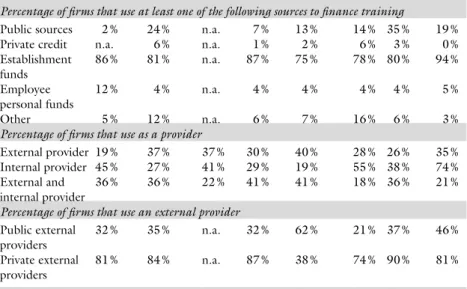
PPEnDixTable 5.7 Providing and financing training services
Bahamas Honduras PanamaUruguay Colombia Small firms Medium
firms Large firms Percentage of firms that use at least one of the following sources to finance training
Public sources 2 % 24 % n.a. 7 % 13 % 14 % 35 % 19 %
Private credit n.a. 6 % n.a. 1 % 2 % 6 % 3 % 0 %
Establishment
funds 86 % 81 % n.a. 87 % 75 % 78 % 80 % 94 %
Employee
personal funds 12 % 4 % n.a. 4 % 4 % 4 % 4 % 5 %
Other 5 % 12 % n.a. 6 % 7 % 16 % 6 % 3 %
Percentage of firms that use as a provider
External provider 19 % 37 % 37 % 30 % 40 % 28 % 26 % 35 % Internal provider 45 % 27 % 41 % 29 % 19 % 55 % 38 % 74 % External and
internal provider 36 % 36 % 22 % 41 % 41 % 18 % 36 % 21 % Percentage of firms that use an external provider
Public external
providers 32 % 35 % n.a. 32 % 62 % 21 % 37 % 46 %
Private external
providers 81 % 84 % n.a. 87 % 38 % 74 % 90 % 81 %
Source: Authorsʼ calculations based on EPFE data
Notes: All statistics in the table are calculated for the subset of firms that train. The questionnaire allowed more than one choice of source of funding for the answer, so the percentages do not total 100 %. The denominator is the number of firms that trained in the reference year. The percentages for Colombia are calculated using only manufacturing firms. Firms in the commerce and services sectors display very similar patterns: the major- ity of training is financed with establishment funds and external and internal providers are evenly distributed.
Results are not presented due to space limitations but are available on request. Also, due to special confiden- tiality protocols by the statistics office in Colombia, the authors of this study were unable to aggregate the data from Colombia with that of other countries to build the indicators by firm size. n.a. = not available
n
OtEs1. However, in a market with frictions, the predictions are different. Given that market wages do not fully reflect increases in productivity, firms may have incentives to finance general skills training. It has been established that cer- tain institutional aspects that characterize domestic labor markets, such as minimum wages, result in this type of friction (Acemoglu and Pischke 1998, 1999).
2. For evidence on the impact of modern workplace practices on productivity see Black and Lynch (2001). More recently, Lazear et al. (2012) provided evidence of the impact of the quality of bosses (supervisors or managers) on productivity.
3. The number of firms composing the sample in each country was: Bahamas, 505; Honduras, 658; Panama, 757; Colombia, 8071; and Uruguay, 636.
For Panama, the sample used was significantly smaller than the sample sur- veyed because of problems with missing and inconsistent data.
4. These training levels are constructed with WBES data from a question in which respondents were asked: “Over [the last complete fiscal year], did this establishment have formal training programs for its permanent, full-time employees?”
5. In Scandinavian countries, which have the highest intensity levels in Europe, firms provide an average of 30 to 35 hours of training per employee per year (Bassanini et al. 2005).
6. On average, high- and low-skilled workers in Honduras receive 37 and 22 hours of training per year, respectively. In Uruguay, these figures are 23 and 17 hours.
7. The survey adopts the skills classification of Murnane and Levy (1996), which defined three categories: (i) specific skills of the occupation, defined as the techniques needed to develop a particular occupation that are not read- ily applicable to other occupations or industries (e.g. training in the use of certain equipment in the textile sector); (ii) knowledge skills, defined as the basic areas of knowledge of the curriculum in the formal education system:
reading, writing, arithmetic, reasoning, and critical thinking; and (iii) behav- ioral or socio-emotional skills, related to responsibility, degree of commit- ment, ability to work in groups, persistence, and self-control.
8. The importance of socio-emotional skills in the working life of employees has been well documented in international literature (see Heckman et al.
2006). Given that socio-emotional skills appear to be malleable even after adolescence, the return on investing in development of such skills would be higher than investing in the development of cognitive skills (Cunha and Heckman 2010).
9. EFPE data shows that the share of firms that provide OJT during working hours are 67 % in Honduras, 97 % in Panama, and 91 % in Uruguay.