.1 I :-
Cape Town
SECOND CARNEGIE INQUIRY INTO POVERTY AND DEVELOPMENT IN SOUTHERN AFRICA
Food and Nutrition Policy with Relation to Poverty: The Child
Malnutrition Problen in South Africa
by John Hansen
Carnegie Conference Paper N:>. 205
13 - 19 April 1984
ISBN 0 7992 0624 5
.
IEQQQ_~~Q_~YIB!I!Q~_EQb!~Y_~!Itl_B~b~I!Q~_IQ_EQY~BIY~_Itl~
~tl!bQ_~~b~YIB!I!Q~_EBQ~bg~_!~_~QYItl_~EB!~~
J.D.L. Hansen, Department of Paediatrics and Child Health, University of the Witwatersrand
In the formulation of desirable food and nutrition policies for a country as diverse as South Africa it is important to have reliable data on the nutritional status of the population.
To obtain this, in the absence of all-embracing expensive prospective nutrition assessment surveys, reliance has to be pleased on available health statistics, hospital records and individual published and unpublished data that have a bearing on nutrition. In this paper an attempt has been made to get an overall picture of child malnutrition in Southern Africa from the literature, from official statistics and from recent surveys of weights and heights of preschool and school children in selected areas.
Indirect measures of community nutrition status are morbidity and mortality rates. particularly in theO~4 year age groups.
These are reported where relevant.
In a countrywide survey of malnutrition at all ages, it is not possible to obtain reliable data on clinical signs of mal- nutrition because of observer error and differing opinions of interpretation. The simplest measure of food intake in children is growth (weight and height for age) •. Weight for height is useful in extremes of obes i ty or wasti ng. It is now generally ..
agreed that international reference levels should be used in assessing these parameters and WHO has adopted this policy for comparative surveys in all countries 1 , 2, 3, 4
The weights and heights published in various surveys in the R.S.A. and surrounding territories since 1970 have been collected and looked at from regional and general aspects. In the earlier papers Harvard (Boston percentile) reference standards were used but latterly the newer NCHS reference levels2, 3 have been uti li.sed by authors. There is very 1 ittle difference of practical significance between the two so they have been considered together in the context of this paper.
JWhen ..•...
, - - - -
-2-
When relating a weight and length for age .~ain~t refer.ence standards it is important to have a cut-off point at which one can
".:) say that an individual is at risk for malnutrition or frankly malnourished. For most authors this is the third percentile of weight and height data or alternatively 80 percent of the expected mean weight and 90 percent of the expected mean height for age. Where weight for height is used 80 percent of the expected mean is the cut-off point.
Weight for age (WT/AGE) and mid-upper arm circumference (MUAC) are the strongest discriminants of mortality and morbidity risk, whereas weight for height (WT/HT) is the weakest 5, 6. Low height for age (HT/AGE) is an indicator of prolonged malnutrition.
Where possible the appendix tables will give all these parameters.
Bg~Yb!~
1. B~~~~~_~~_~_~~Qbg tl~~b!~_~!~!!~!!~~
a ) Nutl'i·tiona 1 DtseaseMol'ta ltty
Data from the Department of Statistics reveal that there is a considerable mortality from nutritional disease and diseases related to nutriti.on in the 0-4 year age group7 (Table I, Fig • .1). In 1977, the mortality rates/l00,000 'were 64, 247 and 1781 for whites, asians and coloureds
respectively. These rates had decreased from those per- taining 10 years previously, but the percentage of deaths from these·diseases in coloureds had not decreased. The estimated black mortality rate in 1970 from these diseases is 2104. It is calculated from these figures that there were 50,626 deaths in black children in 1970. Of these 6005 were due to the severe forms of malnutrition - kwashiorkor and maraSmuS.
b) ·lnfantMol'talityRate
This rate is an index of general health in a population and it should be less than 20. It shows over the last 40 years a striking reduction in the white population with little reduction in the coloured population of the whole country. However, in Cape Town the co19ured infantile mortality has declined to almost the white leve1 8 (Fig.! I).
-lIn ... .
~ <i
I,," '!l
I I
"
I I
I
,I
,
;
I,
, 1
I
\'
I~
."
=
... •
iii
...
...
.:;I
k 100<II
=
...
<...
Q<II
...
~
•
..
~..
::l<
.. •
0 ;,
., !L :.
1: INFANTS 0-1 n;A.SMORTALITY RATES:
... ; ~:\
~
, : / .... /." \:i. •\
~....
.,~"
i....
,... "
'.'\ l " .' • \:\:,: \.
-VI .,' ·\V
"""""' \,
'"
'..\ V\ \,\
...
".•..
\ .- '/ \. '
.
\ v-'. ,f.../\
·t... \
V'- ,/I." ••• t ••
\Iv II'" 1\ •••••••.•
V' , , ' ... .
... \ .. . ---'r---.,---- ',-,._---,.-
COLOURWS S.AFRICA
COUIURt:ns CAPt: TOWS WHITt:S S. UR WHITt:s CAP}: TOWS
19J~ I~' 196~ 197~ n;ARS
Infant mortality rates for Wbites and Coloureds in South Africa and Cape Town over tbe last 40 years.
4- - -_.-. -
B~~~~~_8~_~_~~Q~~_{~Q~II~~~Q2_:_~~8bI~_~I8Il~I!~~_~!!!!
1. b) . Infant Mortality Rate (continued)
••••• In Soweto the black IMR has fallen from 232 in 1950 to 35 in 19799 but in this same year some areas of the country had figures as high as 192 10 • c) ·Department ·of ·Hea lthand ·We lfare ·Surveyon
underweIght ·forage(.Anne)(ureVII I)
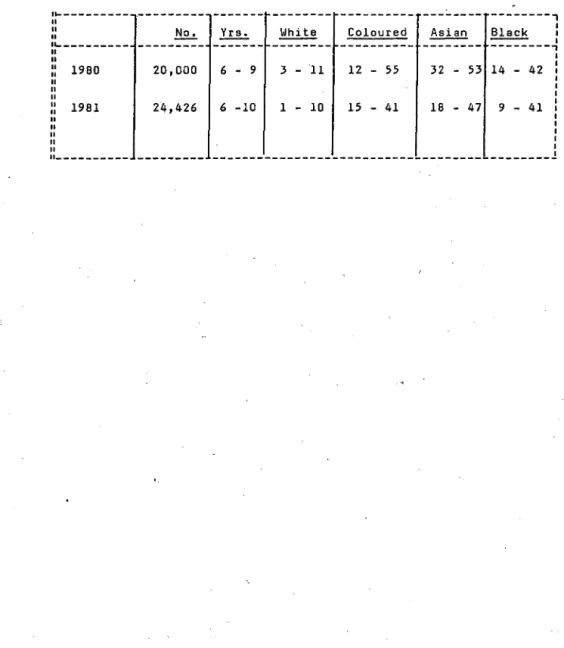
A nationwide anthropometric survey of primary school children in 1980 and 1981 11 , 12, showed that the number of children who were underweight for age between 6 and
10 years of age was approximately 5, 30,31 and 25 per- f:'
cent respectively for white, coloured, asian and black children. The range of underweight extended as high as 55 percent in some areas - the children at 10 years, in general, being more underweight than those at 6 years (Table II, Annexure VIII). When the 0-14 year all races age range is taken together it is estimated that there are 21/4 million out of 93/4 million children (23%) who are underweight for age i~ South Africa 13 (Annexure IX).
These overall official health statistics reveal that there is a severe nutritional problem amongst preschool and school children in South Africa in the coloured, asian and black population groups. The statistics also show that there has been some improvement in infant mortality in the last 15 years and, in particular, a striking improvement in the coloured population of Cape Town and the black population of Johannesburg.
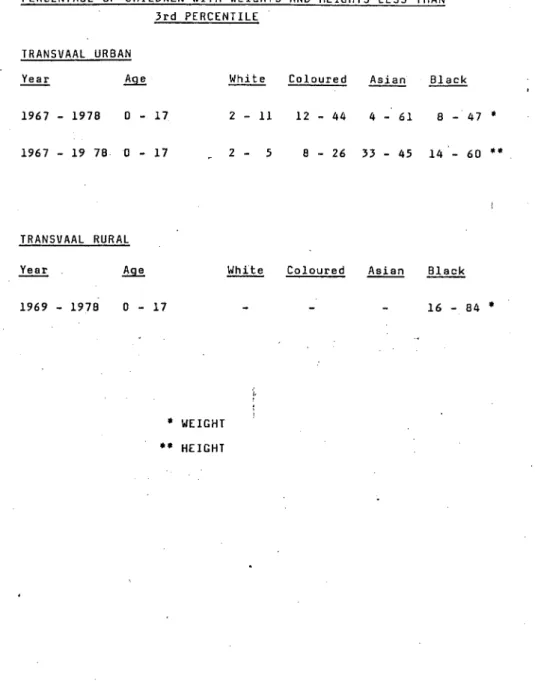
In all age groups from 0-17 years there is evidence of underweight and underheight for age. The ranges vary
..
Ifrom 2-11 percent in whites to 8-60 percent in blacks " .. J wHh considerable regional variation (see annexure).
Underweight in the preschool age group fluctuates between 10 and 30 percent and rises with school age to 24-84 per- cent tapering off again at puberty.
/In ...
oj :,'\
-
~
2. BEGrQ~~6_Q~I~_~~~~~~_!~~~~~~~l_;;;:~;~;_~~~~!~~~2_
In most studies weight for height seemed to be rela- tively normal - the children, therefore! are underweight and stunted rather than excessively emaciated. In one study19 a'pproximately 20 percent of 10-12 year old children in a rural area had some dimunition in serum albumin con- .centration, suggesting marginal protein deficiency.
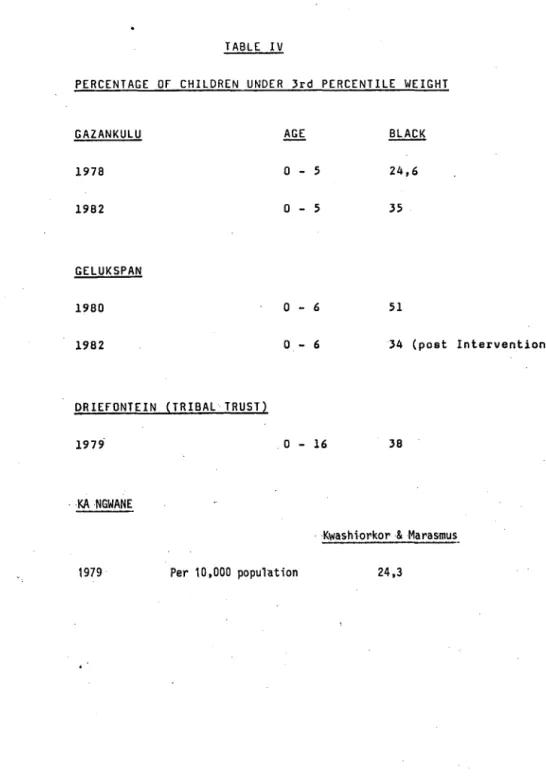
(b) Gr~~~~~~1~~-~~Eb~~b~!~~~Q~~-~~-~~~Q~-~Qg-gri~fQ2!~iQ
!riQ~1_!r~~!1_~_!~Ql~_!Y~_~QQ~~~r~_!!_:_lq~~1~_g~g~~~1_
Community surveys of ambulent preschool children in these three territories revealed that one third of the children in Elim Hospital area of Gazankulu and Driefontein Tribal Trust near Piet Retief and one half of the children in the Gelukspan area of Bophuthatswana are underweight. Of importance is the fact that active intervention in the latter area reduced the incidence within two years to one third in the preschool age group. The high prevalence of kwashiorkor in Ka Ngwane is evidence of a problem in that area.
COMMENT ON TRANSVAAL AND ADJOINING TERRITORIES OF GAZANKULU,
~opADTA~isw)l.~J\--RA-NGWJ\NE-)l.Nii-ilt~~sijll.J\[:-TRIiiJ\[-TRDsr--- ______________ 1 ____________________________________ _
Throughout the region there is evidence of protein energy malnutri.tion in at least one third of the childhood population.
As height is affected as much as weight the figures suggest a chronic deficiency of protein and energy. There is some evi- dence that there is less severe malnutrition in urban areas with high employment.rate but urban and rural figures are very similar. In Gelukspan, Bophthatswana, there appears to be improvement where active intervention had an effect within two years 10 • Where age groups and areas can be compared, e.g.
Gazankulu and Driefontein there is a remarkable similarity in prevalence of underweight in preschool age groups. In one rural area school feeding appeared to have a very favourable effect,9.The Elim Hospital sample is a true reflection of non-hospitalised children's weights. Underweight and stunting is more prevalent in school age children but there is improve- ment at the age of 17.
(c)Nata.l.and .KwaZul.u: .Table~, .Annexure I I I 25 ~26 ~27 ~28 ,29 ,30 ,31,32 Both in the urban (Durban) and rural areas there is evidence of malnutrition in Indian and Black children. In some districts
..;the •....•.•.•...
'6 - -
3. ~~~IQ~~k_Q~I8_!!!!!_~2!21_2D9_~~2~~1~_!!!!!!_~2~~iD~~9 the position is better than others. Chatsworth Indian children appeared to be the most undernourished. In KwaZulu Nqutu area the estimate for underweight was 27%
in 1974 and 16% in 1978 but the lower figures represents non-hospitalised children. As in other areas school-age chil dren appear to be more underwei ght than preschool c!]i1dTen.
The range of underweight for NataljKwaZulu is 10-53%.
Height is equally affected and t!]ere is not much evidence of wasting in the community.
In one study the Indian children of Chatsworth were com- pared with those at LaudIum near Pretoria. There is a strtktng di.fference In weights and heights ,reflecting the better-off Indian communi.ty at Laudium31 ,32.
(d)
n=a;~;~I~=~~;~~~~~~~~2~~~_!2~1!LY!z_~D~~~Mr~_IY
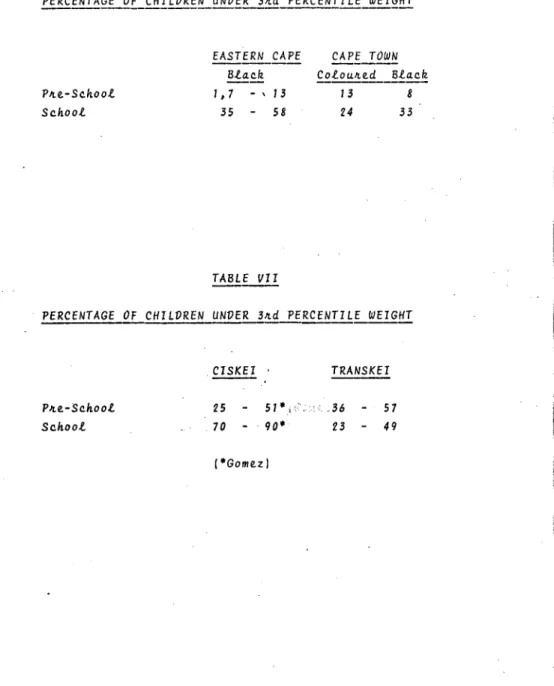
T!]ese areas represent rural and urban Cape. There are, as In other parts of t!]ecountry, differences depending on income and availability of creches for preschool children.
The preschool rural areas in Eastern Cape are roughly similar to the Cape. However, school chi.1dren in rural areas are considerab'ly worse off, wasting being as high as 33 percent.
T!]ere is, in Cape Town, COnsiderable Improvement in school children, both black and coloured, between 1979 and 1981 34 , 37.
(Annexure i V).
(e)
~i~~~1_2~~_Ir2Q~~~i~_!2~1~_YIIl_~DD~~Mr~_~:~~:~::~~~~
In CiskeIand Transkei and 'nutritional status is worse than the Cape both tn preschool and school age chil dren. Up to 50 percent of children in both age groups are underweight.
In one study a school feeding scheme showed improvement in weight of children. 47
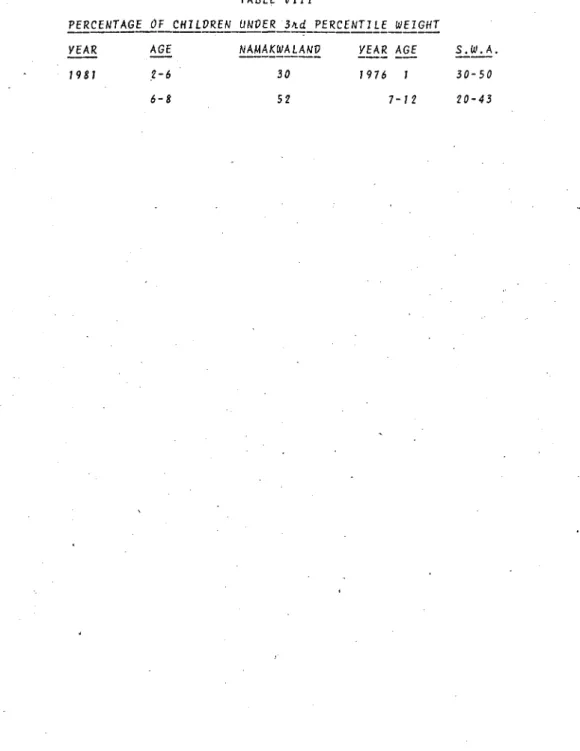
(f)
~~~2~~212n9_2~9_~!~!~!!_I2~1~_YIII~_~~~~~~r~_YI~~~_~~
The malnutrition picture in this South Western part of South AfrIca is apparently not very different to the rest of the sub- continent. The South West African children Baster group appeared somewhat better than the Nama, but some evidence of
/malnutrition ••.•....•
'.,"
;;
,
7
2. B~§lQ~~b_Q~I~_~~~~~_~~~~~~~l~~~_~~~~~~~~~!_~!!!!_£Q~!i~~~~
malnutri.tion is seen in most of the children.
Overall growth rates are less than international standards.
Hospitals in rural areas all have their quota of severe malnutrition cases. The number of children in hospital with kwashiorkor or marasmus varies from 5-31 percent of admissions depending on the rural area42
• Of children in hospital who are underweight for age figures vary from 24 to 64 percent.
In the R.S.A. and surrounding territories, it is apparent that there 'is.a problem of malnutrition in children. The figures for school children from multiple published papers from 1970 to 1983 are remarkably similar to those obtained in an official survey by the Department of Health and Welfare in 1980 and 1981 11 , 12.
From all these sources it.can be said' that approximately ,a ,thi·rd of·black·coloured·and·asian ·children below the age of 14 years 'are ·underwej·-ght ·and stunted fOl'thei-1' ,age. In some area, e. g.
parts of the Ciskei and Chatsworth in Durban the situation is WOI"se (rising to 60-70%, or more). In other areas, particularly in Cape Town and Soweto the figures for underweight, mortality rate and hospita1 admissions ·have 'shown great improvement in recent years9. This latter improvement can probably be linked to better socio-economic conditions, as an earlier study in 1965.
showed a very precise relationship between underweight and stunting in children and income/head/day44.
Malnutrition in children has its most serious effect in the under six year age range and it is in this age group that ·hospital
·adm;'ssi,ons for severe kwashiorkor and marasmus occur. The preva- lence of these severe forms of malnutrition may be as high as 3 percent of the preschool population in rural areas, leading to a high admission rate ot hospItal of these cases - in KwaZulu and Lebowa from 5-31% of admissions. In the context of nutritional disease and mortality the rates/l00,000 preschool (0-4 years) population are 1981 for coloured and 2104 for blacks. This is 31 times as high as the white figure of 647. As with the incidence of underweight there is great improvement in Cape Town and Soweto . .
In these areas admissions for malnourished cases have fallen steadily during the last ten years9. /Caoses •....•...
I i
£~~~~~_Qf_~~l~~~ri~iQ~_i~_£~ilgr~~:
From published papers where an attempt has been made to link malnutrition to environment and socio-economic factors, it is apparent that lack of cash income is the most important29 ,39,44.
In KwaZulu and other rural areas 29 ,33. poor education of mother, lack of dietary understanding, non-availability of protective foods were additional factors, which probably have universal application. In broken families where mother is the chief bread- winner there is more malnutrition. Family size (excess numbers of children) is a factor in the towns44 but neither family size or migrant labour appears to be important in rural areas 29 • A sociological factor in urban areas is the working mother. Lack of creches and child minder schemes results in poor supervision and feeding of children during the day14.
~h~~_i~_~Q_e~_gQQ~_~eQ~~_~~lQ~~ri~iQu_iQ_fhilgr~Q_iQ_~h~_B~~~~~1 There are indications that improved income in the towns 35 , 39 has a marked beneficial effect on the incidence of malnutrition compared to rural areas. In a rural area a cash income from a field aplleared . more important than a vegetable garden34 . On the other hand the
Valley Trust Concept of community 'vegetable gardens and fish pond cultivation h.as had a marked effect on the incidence of malnutrition in a specific area45. In the R.S.A. as a whole there is statistical evidence that there has been a gradual reduction in nutritional disease amongst Asians and Coloured. in the decade 1968-19777, and in Johannesburg there is evidence of steady decrease in malnutrition amongst Blacks according to hospita1 figures 9•
The overall situation with regard to malnutri'tion io children is nevertheless 'unsatisfactory and many lives will be lost before general economic and educational uplift is sufficient to overcome the problem.
Canspecific intervention on the part of health and welfare services produce a meaningful improvement in child malnutrition in the short term? The most caring and authoritative study on this 10 has demonstrated that intervention in a rural setting can be ·most successful. In this study the intervention consisted of:
11. ... .
",
I)\
<,~
" I
I
I. With the Community Hospital as a base, a mobile Under 5 Clinic Team consisting of a psychologist with an interest in community involvement, primary health care nurses, a family planning guidance officer and a health assistant (hygiene) was established. This team had a Kombi at its disposal and concentrated on:
(a) weighing and immunising all children in the district and issuing a "road to health" card to each,
(b) screening out all children at risk and follow- ing them up with health education and visits, (c) screening out all children with severe mal-
nutrition and giving them appropriate treatment with food supplements,
(d) giving health education to mothers, and (e) referring people with social problems to social
workers.
The team discussed the whole- project with the Community Leaders in each and every village and co-operation was sought from teachers, ministers, women's leagues, traditional healers, etc.
II. A gardening and. poultry project was started .at the hospital for selling produce at cost price.
I II. A nutrition rehabil itation centre was opened in the hospital to' admit· malnourished children with their mothers.
IV. Health service was decentralised with erection of distal clinics to which the mobile team paid visits.
A T.B. case finding team with mobile X-ray visited the clinics and the health inspector assessed quality and quantity of water •
. ·RESUl TS Wtthin two years from 1980 to 1982 thi s i nterventi on programme produced the following results;
(a) a reduction of underweight children from 51 to 34 percent of the 0-6 year population.
(b) The number of deaths from PEM in the hospital dropped to 15 percent.
(c) Child mortality 0-6 years in the Community
decreased from 9,5% to 2,1%. /These#' ...• / /
.~
o
These striking results demonstrate that a well organised health team working closely with the Community Leaders can make a difference to child health and reduce the incidence of malnutrition in a relatively short period of time at relatively low cost.
1.. Improvement of socioeconomic status of underprivileged sections of population. This requires c.oncerned inter- grated effort of planners in conjunction WHh relevant government departments, agriculture, water affairs, commerce and industry.
2. Better organisation of health services to ensure
monitoring of growth of preschool and school children and the giving of comprehensive service including immunisation, family planning and ·surveil1ance for tuberculosis.
3. Food supplements for those at risk, e.g., underweight children, both preschool .and school, pregnant and lactating mothers who have failed to gain weight in pregnancy, in- dustrial workers who are underweight for height.
It is of interest that 15 million children under five years of age died in the world during 198346• A mnemonic denoting techniques which can 'reduce this enonnous toll is GoBl-FFF The letters stand for the simple and low cost methods of Growth monitorin9, Oral rehydration therapy, Breast feeding and Immuni- sation and the more expensive, though equally important, strategies of Family spacing, Food supplements and Female education. These principles are backed by UNICEF and incorporate the three priorities of food and nutrition policy advocated above.
§~~~BY:
In the assessment of the extent of childhood malnutrition in Southern Afri.ca statistics on mortal ity and morbidity from malnlJtrition have been reviewed in conjunction with published data in weight and height. It is apparent that there is a severe problem in the rural areas where numbers of children are admitted to hospital for treatment of malnutrition and death rates are high. Of the non-hospitalised population approximately
fa ....•....••..•..•...•.•...•.•
r"'!
\ '
'I
II I
1
f;\;
,
a third of black, coloured and asian chi.ldren throughout the country are underweight and stunted for their age.
Low cash income combined with poor socioeconomic conditions is the most important cause of malnutrition. There are indicati.ons that well organised health services can ameliQrate the proble~ to some extent but educational and economic uplift is the long term solution.
·REFERENCES BY NUMBER . 12 Jelliffe, D.B.
'The assessment of the nutritional status of·
the community.' WHO Monograph Series No. 53 Geneva. (1966)
2 World Health Organisation
3
4
5
6
A Growth Chart for International Use in Maternal and Child Care. W.H.O. Geneva (1978)
Morley, D., Woodland, M.
See how they grow. MacMillan Press, London (1979) Editorial 'A measure of agreement on growth standards'. Lancet i 142-143 (1984) Kielman, A.A., McCord, C.
'Weight-for-age as an index of risk of death in
children~ Lancet i 1247-1250 (1978)
Chen, L.C., Chowdbury, A.K.M.A., Huffman, S.A.
'Anthropometric Assessment of Energy-Protein Malnutrition and Subsequent Risk of Mortality among Pre-School Children'
Amer.J.Clin.Nutr.~. 1836-1845 (1980)
7 Wyndham, C.H., 'Impact of Nutritional Deficiency on Mortality in Children aged 0-4 years'
S.Afr.J.Science,. 79, 218 (1983)
8 Wyndham, C.H., Irwig, L.M. 'A comparison of the mortality rates of various population groups in the Republic of South Africa.' S.Afr.med.J., 55, 796-802 (1979)
9 Stein, H. 'The Sick Black Child'.
Inaugural Lecture. Witwatersrand University Press, Johannesburg (1982)
'1
, JI!
·
10 Bac. M. Measuring and managing protein energy malnutrition in rural communities 1-6.
Family Practice IV. 1983.
11 Kotze. J.P., van der Merwe. G.J., Mostert, W.P., Reynders.J.J., Barnard, S.D .• Snyman, N.
'Anthropometric Survey of Different Cultural Groups in South Africa'. J.Dietetics and Home Econom; cs
lQ..
77-81 (1982)12 Kotze. J.P •• Williams. W.N., Vivier. F.L., MacIntyre, H·., Reynders. J.J •• Dept. Health and Welfare. 'Anthropometric and dental data of different population groups in primary schools in R.S.A.' Reported at Associ.ati.on of Dietetics and Home Economics. Pietermaritzburg. July. 1983.
13 Kotze. J;P., Department of Health and Welfare.
Personal Communication (1983).
14 Shuenyane. E., Mashigo. S., et al. A socio- economic, health and cultural survey in Soweto.
S.Afr.med.J.·
.2..!.
495-500 (1977)Richardson. B.D. 'Malnutrition and .nutritional anthropometery'J.Trop.Pediatrics. 26, 80-84 (1980) Richardson. ·B.D. 'Underweight - A Nutritional Risk?' S.Afr.med.J •• 51, 42-48 (1977)
Richardson. B.D. 'Underweight, stunting and wasting i.n Black and Whi.te South African schoolchildren, Malnutrition or Adaptation?' Trans.Roy.Soc.Trop.
Med. & Hyg.
:?l
210-216 (1977)Richardson, B;O. 'Growth patterns of South African Children:. An .overview. 'S.Afr.J.Science74 246-249 (1978)
19 Walker, A.R .. P., Bhamsee, D., l-Jalker, B.F., Richardson, B.D. Growth, school attendance and serum albumen levels in S.African Black children of 10-12 years. J.Trop.Med. 1\ Hyg.
il..!.
2-8 (1978)20 Margo, G., Lipschitz, S., et al. 'Protein calorie Malnutrition and Nutritional Anaemia in Black preschool Children in a South African Semi rural Community.' S.Afr.med.J.50 67-73 (1976)
21 IJsselmuiden, C.B. 'The Nutritional Status of Children under the age of 5 years in Northern Gazankulu.' S.Afr.med.J. In Press (1984).
22 Pettifor, J.M. Personal Communication (1983)
23 Fillipson, M.G .• Paper presented atS.A. Nutrition Society Congress (1980)
24 Penman, A.D. Personal Communication (1983)
25 Adikhari, r~., Coovadia, H.M. 'Mid-upper ann
ci.rcumference in the assessment of growth retardation.'
26
.Afr.med.J.59, 32' (1981)
Coovadia, H.M., Adikhari, M., Mthethwa, D.
'Physical growth of Negro ChIldren in the Durban
.- , \ ~ , .
area.' Trop.Geogr.med.,}.Q. 373-381 (1978)
27 Moosa, 'A. Personal Communication (1983)
28' Margo, G., Baroni, Y. et al
'Protein energy malnutrition and nutritional anaemia in preschool children in rural Kwazulu' S..Afr.med.J.54 21-26 (1978)
29 Schlemmer, L. and Stopforth, P. 'A study of malnutri.tion in the Nqutu district of Kwazulu' Institute of Social Research, University of Natal, Fact Paper No. 2 2.2/74 (1974)
30 Moosa, A., Coovadia, H.M., Jinabhai, C.C.
'The problem of malnutrition in South Africa'
-
S.Afr.med.J. ,59 888-889 (1981)
31 Van Rensburg. C.F., Booyens, J. et al.
'The relati.onship between scholastic progress and nutriti.onal status' S.Afr.med.J. 52 644-649 (1977)
32 Booyens, 'J., van Rensburg, C.F.W.J., Myburgh, C.P.H., Booyens, ·M;J.G. 'Aspects of Nutrition Status, sociQ- economi.c status and scholastic progress'
33
Malnutrition in Southern Africa. Ed. Griessel, R.D.
Misc. Congo 14, UNISA, Pretoria (1980)
Fincham, ·R.J. Institute of Economic and Social Research.
(a)
(b) (c)
Developmental Studies Working Paper No.3 (1981) ibid (1982)
ibid (1982)
Working Paper No.6 Working Paper No. 9
16
34 Power, D.J. 'An anthropometric study of young school children in an area of'Cape Town' S.Afr.med.J. 61 303-305 (1982)
35 White, M.W. SALDRUjSAMST
36
Conference on economics of health care in Southern Africa. Paper No.5 (1978)
Van Niekerk, C.H. M.D. Thesis.
University of Cape Town (1979)
37 Kibel, M. Tibbit, A. Personal Communication (1983)
38 de Villiers, M. 'An evaluation of the nutritional situation in the Ci.skei with recommendations for
)
remedial measures' D.Sc. Thesis. University of Pretoria. (1980).
39 Westcott, G.M., Stott, R.A.P. 'The extent and causes of malnutrition in children in the, Tsolo district of the TranskeL' S.Afr .med.J. '
g.
963-968 (1977).40 Kibel, M., Jacobs, M. Persona1 Communication (1983)
41 Heese, H. de V., du Plessis, J;M.E., Ferreira, J.J. "
Report on an epidemiological study in a group of Namibian infants in the Rehoboth-Gebied. (1976)
I
,1;1
! '
"
'(!,:
,,~
"j
n
42 Booth, R. Paediatric problems in rural area of South Africa. A study in Southern Lebowa.
S.Afr.med.J. -§l911-913 (1982)
43 Ndaba, M. Personal Communication (1983).
44 Wittman, W., -Moodie, A.D., Fellingham, S.A., Hansen, J.D.L. 'An evaluation of the relationship between nutritional status and infection by means of a field study.' S.Afr.med.J. -i1664-682 (1967) 45 Stott,-H.H. Annual Report. The Valley Trust,
Botha 's Hi 11. Nata 1 3660 (1979) 46 Annotation "Fifteen Mi 11 ion Dead"
Lancet ii 1506-1507 (1983)
47 ter Haar, G. 'Education in reverse' Transkei and Ciskei Research Society: Proceedings 6th Biennial Meeting, Umtata (1980)
I~
TABLE I
R.S.A. AS A WHOLE CHILDREN
Mortality Rates; Nutritional Diseases and Diseases Related to Nutrition - i.e., -Gastroenteritis, Pneumonia, Measles.
0-4 year Mortality Rate/lOO,OOO (~ercentage of deaths in brackets)
1968 1977 1970
122 (20) 64 (17)
702 (59) 247 (38)
Coloureds
:nO} (69) 17-81 (65)
2104
J~
lOOO
Coloured5
1968 70 71 72 13 74
"
7. 17Mortality rates per 100 000 for diseases related to nutrilional deficiency forthe three popula.
lion groups over the period 1968-1977.
TABLE II
PERCENTAGE OF UNOERWEIGHT CHILDREN AT PRIMARY SCHOOL, R.S.A.
u _________ _
"
"
"
11 .. ________ _
1960 1961
(less than 60% Expected weight NCHS Reference)
20,000 24,426
'.
--- --- --- --- ---,
~ Whi te Coloured ~ Black
1
--- --- --- --- ---,
I6 - 9 3 - ~1 12 - 55 32 - 53 14 - 42 :
I I I
6 -10 1 - 10 15 - 41 16 - 47 9 - 41 :
I I I I
_____________________________________________ 1 I
':21
TABLE III
PERCENTAGE OF CHILDREN WITH WEIGHTS AND HEIGHTS LESS THAN Jrd PERCENTILE
TRANSVAAL URBAN
1967 - 1978
o -
17 1967 - 19 78 0 - 17TRANSVAAL RURAL
1969 - 1978
o -
17*
WEIGHT**
HEIGHTWhite Coloured
2 - 11 12 - 44 4 - 61 8 - 47
*
2 - 5 8 - 26 JJ - 45 14 - 60 **
Coloured
16 - 84
*
TABLE IV
PERCENTAGE OF CHILDREN UNDER 3rd PERCENTILE WEIGHT
GAZANKULU 1978 1982
GELUKsPAN 1980 1982
DRIEFONTEIN (TRIBAL TRUST) 1979'
,KANGWANE
i l l
0 - 5 0 - 5
0 - 6 0 - 6
o -
1624,6 35
51
34 (post Intervention)
38
, -Kwashiorkor & Marasmus.
1979 Per 10,000 population 24,3
.
'TABLE V
Plac.e. . Yeal[.
Nqutu 1974
Chat.6wol[...th 1977
Nqutu 1978
VUl[.ban 1978
Phoen.i.x 1982
Tongaat
~
~~
I-IS 6-8 1-5 '1-12 '
H /1-12 lu.6 than 8
Blac.k
27 16 12 10-30
30
54
33 46
24
TABLE VI
PERCENTAGE OF CHILDREN UNDER 3Ad PERCENTILE WEIGHT
---
EASTERN CAPE CAPE TOWN
- - - -
- - - - -Black - - - -ColouAed Black
PAe-School I , 7
- ,
13 13 8School 35 58 24 33
TABLE VII
PERCENTAGE OF CHILDREN UNDER 3Ad PERCENTILE WEIGHT
PAe-School School
CISKEI . TRANSKEI 25
70
51
*
i '.--' .3690* 23
(*Gomez)
57 49
TABLE VIII
PERCENTAGE OF CHILDREN UNDER 34d PERCENTILE WEIGHT
- - - -
YEAR 1981
AGE ,2-6 6-8
NAMAKWALAND YEAR AGE
30 1976
52 7-12
S.W.A.
30-50 20-43
- - _ .. --~.!.:.. •.. -:--~-'-'-~-'--
.~; N 'H C .j.. ulc..;..
:c
.. ·C[
I
YEAR;O\\'ETO :Urban)
975
~
186 Families 523 Children 208 Preschool 315 School
-
AGE HEIGHT2-5 18 - 29 63 - 66
6-9 38 55
0-16 38 - 45 45 - 59
WT/HT LESS THAN
em,
(PERCENT)
«
90) 9 - 26 25 16Arm CIflC. 1 ?, LESS KWASH.
THAN e5~'· r111flAsr1US (PERCENT)
CU1,t>1ENT ANO flEr.
N
I$'
orrelation between
~
alnutrition and standard f education of head of ouse. (1977)'''·HUENYft.,NE et al. S.Af.Med . ~l 495 - 500
---~---.---~---+---~---.---~---~---.--- rOHANNESBURG
1
9V17 4607 Preschool 10-1:Urban) Black - B
Coloured - C 1-5 Whites - W
---f---j---'---
fOHANNESBURG 967-69 Black rural 3383
Urban) Black urban 4874 10-6
973 Coloured 1746 Indians 869 7-17 I.W. & N.E. Tvl 1975 Whites 1991
B C W
8 12 3 21 28 8
~---o
B ·8 - 23 C' 12 - .. 29 I
4 -
19 W 2.- 8'B C W
8 8 22 26
~r-~
15 - 49 2 5
B 1.3 2.0 1. C W
i ~m
ata on obesity. fo'd.~.il.bl,
'"" • IGIARDSON B.D. (19~O)",0.9 0.1 O. ' . TROP, Paediatrics
80 -: 84
---~---~--- ---
14 .- 44...,n. WEIGHT ONLY
32 - 61~
ee tables for details~
~GlARDSON B.D. (1977) b .Af.Med.J. ~ 42 - 48
i -
11---~---~---~---I ,---~---~---~
______________ ---
OHANNESBURG 1972-75
I
Preschool and Irhan and Rural School childrenall ages
0-17 I Male/Femal Male/Female BLACK
1
BLACKR 57 45 75 63 U 38 33 60 47
IGIARDSON B.D. (1977) i7
"rus. Roy. Soc. Trop Med &
[yg. 1] 210 - 216 (Histograms available) ---~---~---~---~---+---~---.--- VL .AND
OHANNESBURG
!'rior
tol
14087 all groups1978 0-:6
6-17
·BLACK 25%
60 - 70%
2 - 5
- 2
h~mprovement at age of 1}
(UGIARDSON B.D. (1978) ''0
.Af.J.Science
z.1 246 - 249
---~---~---+---~---+---~---.--- --- O\i\NNESBURG AND I 1978
VL Sotho and Tswana 10-12 I 20 - 84 14 - 33
School ..
Feeding 20-52 No School Feeding 24-84
4 - 18 HYPoalbumin-eALKER A.R.P.
aemia. HAMSEE D.
22% ALKER B.F. I~
GlARDSON .B.D. (1978) J.Trop.Med.Hyg
lU 2 - 8 ---~---+---
·1iJLDERSDRIFr 975 54 Families on small holdings
1-5 27.6 22.8 MAC
13.8 skin folds
11.4
3.2% Nutritional anaemia 1% adults no schooling ,lARGO G. et al (1976)"'''
~.Af.Med.J. lQ 67 - 73 ---.---.---~---~---~---.---~----
.'-_,.,_.:.._~!r .. :.!!~ ... !:.':.!.:. ... - • .,.,.. .• ..;. . ...;...:... .. .:... _._ •. ~ _ _ ._-_~ .• l~ .• r , . . . " . . • .... . : : . . - . . ; - - - . - --....:....: •• - - - - . : . . . - ' - - - - . _ - . _ . _ . --_ . . . . - - • • - - - -
ANNEXURE II . PERCENTAGE CQVIMENT AND
!:Li-CE ~ ~
BOPHlITATSWANA ---
GELUKSPAN 11980
I
265 HouseholdsDISTRICT 493 Children 6
228 Males 262 Females
~~I_!~§8~!Q~
1982 273 Households 504 Children
AQf.
<6
<.6
WT/HT ARM CIRC.
BELOW 3rd PERCENTILE
1 LESS THAN LESS
WEIGHT
51%
34%
HEJGHT
B 15% )16%IB
G 1n) G
34%
am: THAN a5~;
(PERCENT) 13.5 em
38%) 33%
28&)
5%
5%
--3:-2%
, .
.
,
KWASH.
t1f1RASI1US
nEro
7.9 @ 12-23 nj Mortality 0 - 6 9.5%
4.4 @ 24-47n 4.7 @ 48-60n
2.3 @ 12.23 Mortality 0 - 6 2.1%
4.0 @ 24-47 I
2.3 @ 48-60 REF: (1983) I
BAC, M. et al in Press
~~~~~---1~~;;--l-~~~:::~-;::;~:----1-~-~~1-tH~~~~aj---r---1---r---j---~~;-;---- -;~~~-~~~-~~:::~-:~-
4 Villages IJsselmuiden (1983)
462 School Children 7~17 33-95 10-53 2-8% A.D. Penman, 1983
(NCHS) (in preparation)
'l
HIM HOSPITAL 11982 DISTRICT
1983
658 Children in conununi ty
represents 17% of ~ 5 35 % total population
under five, 0-1 29%
measurement at tim 1-2 '45%
of polio .. 2-3 37%
immunisation 3-4 23%
4-5 32%
Weikht comfJared wit
DRIEFC
o
1 2 3 4 •
TEIN 1 2 3 4 5
15 18 36 26 36
t l
15 % .of 11J sselmuiden (1983) all admisScnS S.Afr .med.J. in Press
to hospital.' ---
---.---~---.---~---.---~---~---
RIEFONTEIN
r(~.llAL TRUST 11978 EAR PIETRETIEF • Tvl)
433 Black Children
I
0-5Preschool & School 6-16 TOTAL 0.16
14 - 48 35 - 52 38
33 - 44 33 - 44
42
0 - 7 5. - 10
6.3
---.---~---.---"---~---~---_ _ _ _ ~ _ _ _ _ _ _ _ _ _ _ _ 4 _ _ _ _ _ _ _ _ _ _ _ _
ANCII'ANE 11979 llI:1v!BA HOSPITAL 11980
---+---~---+---~---~---~--- k~
Per 10000
!:2Et,!!e!~2!}
24.3 13.5
---~
...
PETTi FOR J, (1983) Personal Conununication
FILLIPSON, M.G. (1980) S.A. Nutrition Society Congress.
)1:1
~rr~~!~~_L~~!§_!!!
PERCENTAGE BELOW 3rd PERCENTILE
~.~
I
YEAR I NATAL KWAZULU DURBAN(Urban) lJl'.'1LAZI
(Urban)
CHATSWOR1H (Urban)
j PHOENIX Tongaat
1978
1978
1977
1982
NQU111 I 1978
(Kwazulu) Rural
NQU111
HOSPITAL DURBAN
1974
1981
SAMPLE AGE
5743 Black Urban10-12 Children
WEIGHT 11. 7
5743 Black . .\1 -6\ 10 - 30 School Creches
and Baby Clinics 11-12 30
488 Primary School Indian
Indian
392 Black
,
6
-81M
F
... 8
1 -S
54 53
33 46 16.4
536 Children
Black 1 -151 Estimate 11% of 4833 patien~
admitted to hospital
14000 children in distriCt
7392 In-Patient 2739 Malnourifial 37%
27 ALL 10 Trauma 20 Healthy
HEIGHT 41.2
35 - 63 30 - 40
41 50
20 25
39 ALL 30 33
..
,'~. ,~~'.
WT/HT LESS THAN (PERCENT)
em:
AR~l C IRC.
LESS THAN B5~;
(PERCENT) 6.75
Skin fold
o -
2%0.3-16
___ I _ _ ~-
?~
KWASH.
I111RASI1US
2.7 Anaemia 6.7%
10% Kwash·
8% Marasmus
, ;(
COM-1ENT AND N <:>C
REr.
-
ADHIKARI, M o.'l-
COOVADIA, H.M. (1981) S.Afr.med.J. ~' 32 COOVADIA, H.I>I. l}
ADHIK!lJ{I, M. (1978) MIHEIl-IWA, D.
Trop.GeogJ,led.
2.Q 373.,. 381 VAN RENSBURG, C.F.
BOOyn.NS, it. J . GA1HURAIN, P. et al (1977) I~
S. Afr .rned.J .
~ 644 - 649 Personal Communication (MOOSA ,A • )
l;
'i ":>)'"
MARGO et al (1978)
-,
S.Afr.rned.J. ~ 21-26
ScHLEMMER,L. 21,.
STOPFOR1H,P. (1974) Institute Social Research University of Natal. Durban
Fact Paper No.2 22/74 MOOSA,A.
COOVADIA,H.M.
JlNABHAI,C.C.
S.Afr.med.J.
(1981)1.1
22
888-SS!.Ii
-~--~-~~---- - , -- ----~--
ANNEXURE IV
SAMPLE
"_.\CE . JnYEAR
- . - --
EASTERN CAPE CAPE
AGE
PERCENTAGE BELOW 3rd PERCENTILE
I
HjiM~~T HEIGHT EASTERN CAPE 1980 ~ChOOl
3171 lack
Sub A & BI 7.,.8
Urban 58
35
64 34
EASTERN CAPE
C,\PE TOWN
CAPE TOWN :russroads
compared with
\qutu)
CAPE TOI'IN
Rural
1980 IPreschool creche 58 children (Feeding) Urban 1981
~iaS'DiV'
Counc.2160 children 1982. atola (Ciskei)
225 Preschool
1979 ISchool Sub A Coloured
896 Children 1978 1464
Preschool (416 Nqutu)
1979.1694 Guguletu
NCHS
<.6 I
1-7<6. 1M 12 - 17 F 15 - 17
o -
2 yrs<6 1M 9 - 13 F 4 - 10
6-9 1-5 1-5
, :~ 2 yrs IM.13
F 10 NCHS<.5th
24
6-121B 28 G 33
M F
M F
25 23 - 33 23 - 25 17 - 21
o -
6.3~ 2 yrs 63·-' 67 56 - 59
20
41 32
WT/HT
LESS THAN
80~~
31 33
Arm ClfIC.
LESS
THAN 85~;
(PERCENT)
r
kinfOldS<.3P 13 - 21 . .10 - 13 11 - 24 14 - 15 M 9 - 12 M 2 - 8 F 13 .., 16 F 5 - 511 1.9 .(7.3)
---
---.--..._--
---.-.,
., .
KWASH.
r1f1RASf1US
I
(PERCENT)CC\\1MENT AND
nEro
~-FINCHAM ( 1 9Sr) l-".~' Working Paper No. 3 Institute of Economic and Social Research Development Studies No. 3 Rhodes University
---~---~~~~
R.J. FINCHAM (1982)
Education IBID
Working Paper No.6
R.J. FINCHAM ( 1982 ) Working Paper No. 9 ·tll"
'b
POWER,D.J. (1982) S.Afr.med.J. ~ 303-305 tJrUTE,' M.W. (1978
»0
Paper No. 5 SADRU/SAMST
Conference on economics of health care in Southell' Africa.
---.---~---~-
(1979) B & G
3.7
Skinfold 1.6 5.2
Senun Albuni.1VM< NIEKERK, C.H.
2.H <'3.5 M.D. Thesis
University of Cape Town
ANNEXURE IV
WT/HT
r -
o. ".~ c. YEAR SAI1PLE LESS THAN
~ISKEI AND TRANSKEI No CISKEI I 1980 I RANDCM
SAMPLE OF 20316 .,.23 1 25 - 42% 4 - 21 2
-
9CHILDREN 288 24-36 42 - 51% 20 - 36 3
-
10FRCM
HOUSEHOLDS, 222 IS4-96 1 71 ,. 95% 23 - 48 15 - 33 (7-Sn
AI1f1 CII1C.·
LESS THAN B5~~
oalbumin-
aem~,
10 - 15%
2 - 13%
0
-
6\o· CCM4ENT AND
"
KWA5H.
f1i1I1ASI1U5 I1Er.
15
Borderline
~washiorkor DE VILLIERS,M. (1980)
n
~orderline & DSc Thesis
firm cases :i1 "An Evaluation of the 3,8% of all Nutrit'ional Situation in children the Ciskei with
~rasmus in Recommendation for 2.790 of all Remedial Measures".
children. University of Pretona
.---~---~---~---~---+---~---.---~--- ---
,,'
y"
J
B G B G'RANSKEI I 1979 I Tsolo
/6 - 1
671 29 23 47 49
Skinfold
B .' G
0.9 14.6 17.5
Hypoalbumin- aemia 16
V~ NIEKERK, C.H.
e
1979) The prevalence of asthma in urban and rural black children - an epidemiological survey.M.D. Thesis. University of Cape Town •
. ---~---~---.---~---"---~---.--- ----_.---
'RA;\SKEI
11977 1 Tsolo 193 children 1 <.5 (57 between 36 1!-2 2-3 yrs - 3 Y"-
'1
7%. . H & 21 yrs)
Rural in hospital 1965
-
2001975
-
20030 percent children die before 2 yrs
WESTCOTT, G.M.
STOTT, R.A.P.
S .Afr .med.J . ~ -;., (1977)
963-968 ," ",'
.---~---~---+---.---~---~---.---~---
I I'
:..·.:·.::::'.:::::..-:::-;.;:;·1
, ... :c ~
YEAR 1~.J'ALAND & SL.A....-
NAMAKWALAND 11981
S.W.A. 1976
SAMPLE
COLOURED 118 528
COLOURED 462
3773 School
~ ."-+
-I 1 PERCENTAGE--- BELOW 3rd PERCENTILE AGE
HEIGHT
2 -
~ I
30 576 - 8 52 38
"'1
AVEAAGE AVERAGEO. - 1 On 3-P On 3 P
~_Lr .:<...~-~
7 - 14Baster 20 26
Nana 43 42
- - -.. _ .. __ ..
WT/HT LESS THAN
BO~'
~~
KWASH.
f1I1RASI-1US
30~ nonnal
70~ mal- nourished
47 - 70% show some degree of
malnutrition
5.8~ low albumin
I
C(M.IENT ANDnEro
KIBEL M. ".;
JACOBS M. (1983) Personal Communicatio
31.
H. de. V. HEESE J.M.E. du PLESSIS -...
J."J. FERREIRA (1\7b)
Report on an epidemio logical study in a group of Namibian infants in the Reboboth-Gebied
~
-_:..-..\_---"
.L'l\I}!-?K'Ui'~ ""ED
SUMMARY OF SOME HOSPITAL STATISTICS
PLACE
DURBAN
KING EDWARD VIII
KWAZULU NQUTU
I I
YEAR : % OF TOTAL : NUMBER OF CHILDREN IN HOSPITAL WITH
: ADMISSIONS: KWASHIORKOR OR MARASMUS REFERENCE
:INCLUDING UNDERWEIGHT:
I I
I I
1970 43 : In 1981 Kwashiorkor 10% admissions Moosa, A. (1983)
1981 37 : Marasmus 8% admissions Personal communication
_____ I (Total hospital admissions 7392)
r ,
I I
: 1972 70 :
: 1977 : 501 Ndaba (1983)
: 1982 ~ .466 Personal communication
1---~
I I
KWAZULU : 1982: 5 - 20% of admissions
8 Hospitals :_ I
Ndaba (1983)
Personal communication SOWETO
I I
: 1970 58
BARAGWANATH HOSPITAL: 1982 26
I
-: -.-
---.Rosen, E. (1983)
.7
~
LEBOWA
I : I
JANE FURSe HOSPITAL 1980 : 64 : 31,5% of admissions : Booth, R. (1982) S.Afr.Med.J.
. I I I I • !
BOPHUTHATSWANA, GELUKSPAN
JDLH/js August 1983
1980 42 percent of deaths)direct
1982 15 percent of deaths)intervention
~T-·· -._.--_ ..
g, 911-913 Bac, M. (1983) In press
., ~ -. ".:.: -, ~ . -'--:--'~--'-. ;
...
~.; , ... 7"-;:-:-:---0 ... r·--·:--.. .' ; ~~~~-Y!!!
~~~!~~_~!~~_~~_~E~_~~~!~~_~!~_i~9~_~~)
R.S.A. YEAR 6 Yrs 7 Yrs 8 Yrs 9 Yrs 10 Yrs C<M-1ENT
B G B G B G B G B G
20,000 Children White 4.5 3 4.0 5 3.5 3 8.5 11 3 percent KOTZE J.P.
5000 each group 1980 Coloured 30 12 37 37 35 42 40 55 , under 60% of V~ DER MERWE G.J.
50th P. MOSTEIl.T W.P.
Asian 32 39 51 42 44 41 49 53 REYNDERS J.J.
BARNARD S.O.
Black 14 19 25 25 22 30 . 34 42 SNYMAN N
(1982) .
f·
, . J. DIETd:CS ~D HCA\1E
ECONOM S 10 77 - 81
24426 School
Children , KOTZE J.P.
WILLIAMS W.N.
VIVIER F.L.
6333 White 1981 White 1 2 4 5 3 5 6 10 6 9 3 percent MACINTYRE U.
6169 Coloured Coloured 16 19 31 28 28 31 40 41 36 38 less than (1983)
65% expected
6120 Indian Asian 19
to
26 30is
33 35 47 36 39 weight5804 Black Black 10 13 17 19 18 26 28 40 33 40 Dept Health & Welfare
.
.... _! _ _ _ . .1._'_'_'_';
'fl",il'-):Ld"£.~ V.l
/~
, [)[PAIHEMlNl VAN GESONDHEID EN WELSYN: VOEDINGSTAlUS VAN SUID-AFRIKAANSE KINDERS - 0-14 JAAR OUO GEnKSTRAPOLEER NA AANl.EIOING VAN ANTROPOM::TRIESE DATAVERSM1Cll'f!.
ill!
(5 T ANOAARDE NCHS _ . - 1977)
Onder 6-14 jr Totaal Gem. ~ Getal Gem.= Getal Gem.
=
Getal Gem. ~ I Gete1 .Gem. % GelalI
, 6 Jr. <ao !; -< 80 % <75 " < 75 "" ...: 70 !;
<
701; <.65 ~' <65.'; <60 ~~
Blankes 569 128 815 8J9 . 1 J84 967 4,9 69 In 1,.8 24929 0,72 9971 0,272 J 767 0,08
-'
-
IKleurlinge 509 785 667 686 1 11~ 411 JO,4 J57 850 16,7 188 J85 7,7 90 578 2,855 JJ 615 0,76 8 948
Asiers U5 J52 185 097 320 449 J1,1 99 JJ9 15,5 48 067 7,5 24 on 2,418 7 748 0,6 1922
S .... artcB 2 957 646 J 957 370 6 915 016 25,6 1 770 244 11,5 760 651 6,6 456 J91 1,352 ?J 491 0,3 21 436
I Tolool 4-207 639 5 590 204 9 797 04 23,1 2 253 503 11,4 1 116 954 5,63 500 97] 1,72 lJO 621 0,44 r J)4Z7
I
- - -
I
___ ---.l I---..---
I
I b
These papers constitute the preliminary findings of the Second Carnegie Inquiry into Poverty and Develop- ment in Southern Africa, and were prepared for presen- tation at a Conference at the University of Cape Town from 13-19 April, 1984.
The Second Carnegie Inquiry into Poverty and Develop- ment in Southern Africa was launched in April 1982, and is scheduled to run until June 1985.
Quoting (in context) from these preliminary papers with due acknowledgement is of course allowed, but for permission to reprint any material, or for further infor- mation about the Inquiry, please write to:
SALDRU
School of Economics Robert Leslie Building University of Cape Town Rondebosch 7700
Edina-Griffiths