It examines service quality in a retail pharmacy using the SERVQUAL instrument as a measurement tool. Regarding the service provided by Pineland's pharmacy, respondents' perceptions of service quality included patient individualization, pharmacy staff competence, efficiency, staff presentation and convenient opening hours, aesthetic appeal, and a modern pharmacy.
INTRODUCTION
- STATEMENT OF THE PROBLEM
- OBJECTIVES OF THE STUDY
- BACKGROUND
- STRUCTURE OF THE DISSERTATION The dissertation will follow the following structure
The terms shopping experience and service package are usually synonymous in the eyes of the consumer, but not in the eyes of many business managers. The reason for this is that it looks at the business through the eyes of the consumer - what do customers expect when they enter the retail pharmacy? Measuring customer expectations and then comparing them to their perceptions is a way to add value to services provided and will more than justify the prices charged.
LITERATURE REVIEW
STRUCTURE OF THE DISSERTATION The dissertation will follow the following structure: The dissertation will follow the following structure:.
RESEARCH METHODOLOGY
ANALYSIS AND FINDINGS
RESEARCH CONCLUSIONS AND RECOMMENDATIONS
LITERATURE SURVEY 1. INTRODUCTION
WHAT IS A SERVICE?
According to Baron and Harris (1995), a service can be divided into two .. a) technical quality - refers to the relatively measurable aspects of the service, that is, what is being done. Examples of technical quality include the quality and effectiveness of medical diagnoses and procedures in a hospital, the effectiveness of a car repair, or the cleanliness of a hotel room. b) functional quality - refers to the way technical quality is provided to customers.
SERVICE CHARACTERISTICS
Talking to customers during and after the service to ensure they are satisfied will be beneficial in stimulating positive word-of-mouth communication. Training should include both how to perform the service and how to properly communicate with the customer.
SERVICE MANAGEMENT
It is also important to note that the definition of service management requires a dynamic approach to management. It is not enough to understand what values or benefits customers are looking for, it is also necessary to understand that the benefits customers are looking for will change over time and that the quality and value perceived by customers must change accordingly.
SERVICE QUALITY
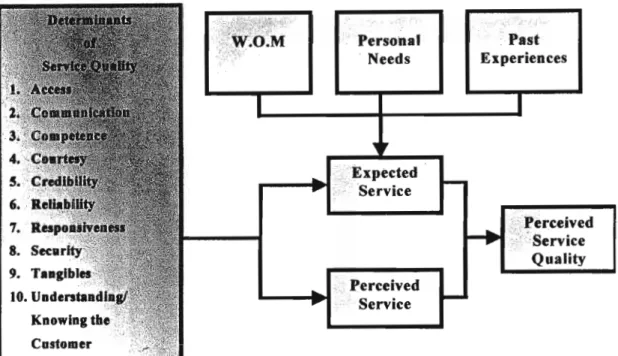
- Determinants of Service Quality
- Communication
- Competence
- Courtesy
- Credibility
- Reliability
- Responsiveness
- Security
- Tangibles
- Understandinglknowing the customer
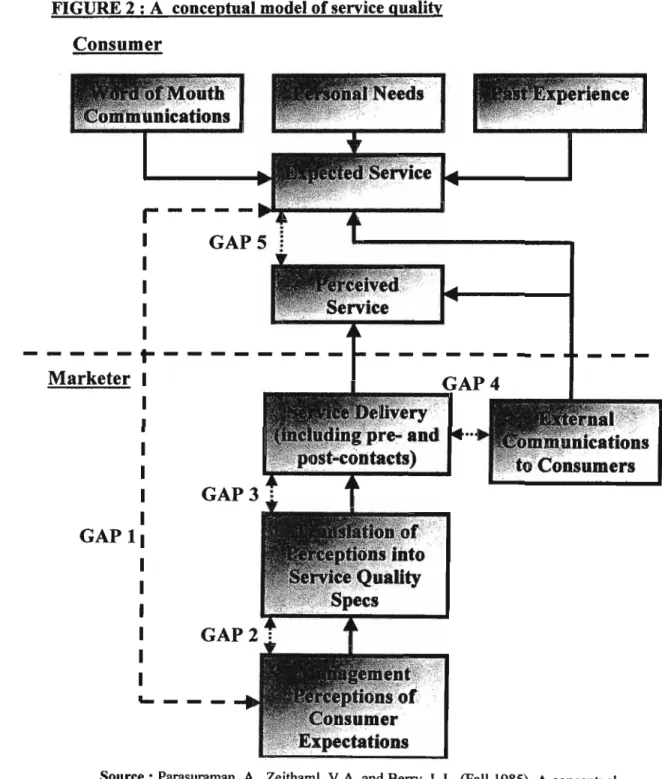
Service quality is more difficult for the consumer to assess than the quality of material goods. Researchers and managers of service companies agree that service quality involves a comparison of expectations with performance. Gronroos (1982) developed a model in which he argues that consumers compare the service they expect with the perception of the service they receive when evaluating service quality.
Service quality involves more than results, it also includes the manner in which the service is delivered. Gronroos (1982) postulated that there are two types of service quality: technical quality, which involves what the customer actually receives from the service, and functional quality, which involves the manner in which the service is delivered. Lehtinen and Lehtinen's (1982) basic premise is that service quality is produced in the interaction between a customer and elements of the service organization.
The service quality model views service quality and service quality problems as existing between the consumer and the merchant. From the customer's perspective, service quality is the difference between what he/she expects and what he/she perceives to be received from the service provider.
CUSTOMER PERCEIVED SERVICE QUALITY
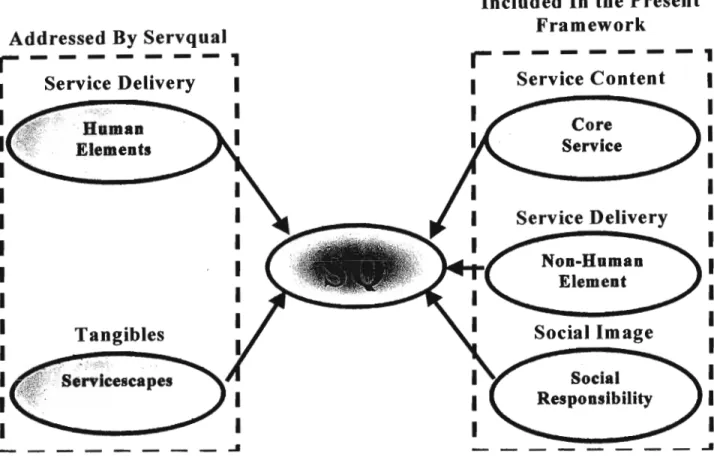
- Tangibles of service-servicescapes
- Core service or service product
- Systematisation of service delivery: non-human element
- Social Responsibility
A study covered British Airway Airlines by Gronroos (2000), demonstrated some of the key aspects of the perception of service quality. This study was conducted to assess which attributes of service quality customers value most and the following four aspects emerged:. A strength of this study is that it shows what is at the core of customers' perception of service quality.
These subtle, yet powerful elements send strong signals in the direction of improving the image and goodwill of the organization and, in turn, affect the overall assessment of service quality and customer loyalty to the organization. For example, a hospital that provides free treatment to the poor is likely to be well regarded by all consumers, which will improve the organization's image and affect customer perceptions of service quality. According to Zemke and Schaaf in 1990 (as cited in Sureshchandaret aI2002), a study conducted by "Consumer Reports" of customers of non-banking financial companies found that one of the dominant concerns of consumers regarding service quality was: "Equal treatment, limited by the pragmatism that comes from the belief that all, big or small, should be treated equally'.
Sureshchandar et al (2002), developed a new model which they believe can improve the understanding of the way customers perceive service quality. They also believe that the model can be used to measure levels of customer-perceived service quality and provide managers with a benchmark against which to base improvement efforts.
CUSTOMER EXPECTATIONS
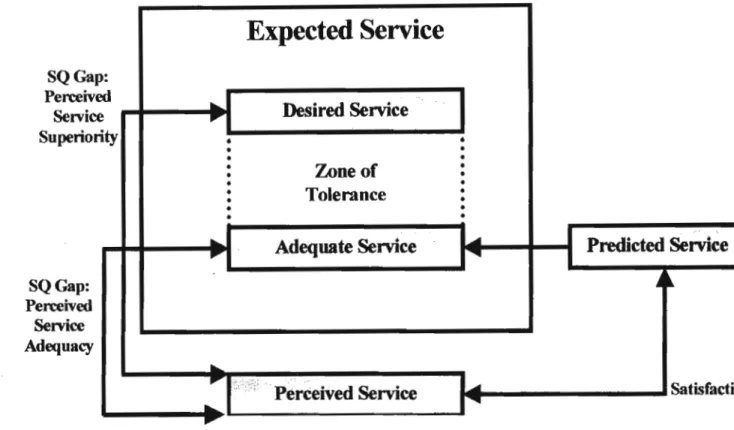
As shown by the model of perceived service quality (Figure 3.8), customer expectations have a decisive influence on the perception of service quality. Such promises, both implicit and explicit, made by service organizations influence customer expectations of the service experience (Bitner, 1995 as cited in Walker and Baker, 2000). With increasing attention to the need to study multiple expectations standards, a framework has recently been proposed that integrates both service quality and.
It is within this standard multiple-expectancy perspective that Zeithamlet al (1993) proposed that consumers use a combination of expectation types to guide their judgments of service quality. Like the tolerance zone, the two levels can vary from customer to customer and from situation to situation for the same customer. Understanding how the tolerance zone works will provide practitioners with better opportunities to optimize resource allocation in their continued effort to meet/exceed customer expectations.
Walker and Baker (2000), demonstrate that managers should measure both levels of expectation because marketers can fine-tune how they allocate resources by incorporating the tolerance zone framework. For example, a service provider with limited resources can improve customers' perceptions of service quality by making improvements to meet minimum levels of customer expectations on the most essential attributes first.
THE RELATIONSHIP BETWEEN SERVICE QUALITY AND CUSTOMER SATISFACTION
They argued that customer satisfaction should be operationalized according to the same five factors (41 items) as service quality. Research has shown that by analyzing information collected from customers of different banks in India, Sureshchandar et at (2002) was able to show that service quality and customer satisfaction are two different constructs that customers are capable of. Service quality is more abstract than customer satisfaction and is likely to be influenced by variables such as advertising and other forms of communication.
Managers should not only focus on improving customer satisfaction, but also try to improve customer perception of overall service quality. In a more recent study that also examined the relationship between service quality and satisfaction, Spreng and MacKoy (1996) tested a model developed by Oliver (1993). Lee, Lee and Y00 (2000) argue that customer satisfaction has more influence on the intention to purchase a service than the quality of the service.
Factors such as convenience, price or availability can influence satisfaction and subsequently the intention to purchase - while not actually influencing customers' perceptions of service quality. Research by Sureshchandar et af (2002), also shows that service quality and customer satisfaction are closely related and that an increase in one is likely to lead to an increase in the other.
RESEARCH METHODOLOGY 1. STUDY DESIGN
DATA ANALYSIS METHODS
RESEARCH RELIABILITY AND VALIDITY
Validity checks, however, indicated that the dimensions were not so general as to preclude the addition of items or new factors in specific applications of SERVQUAL. Cronbach's Alpha coefficient method was used in this research to assess internal consistency for Section B and Section C of the questionnaire. The alpha reliability coefficient obtained for both sections indicated a relatively high degree of internal consistency among the items in each section (see Appendix C).
EVALUATION OF DATA ANALYSIS AND FINDINGS
INTRODUCTION
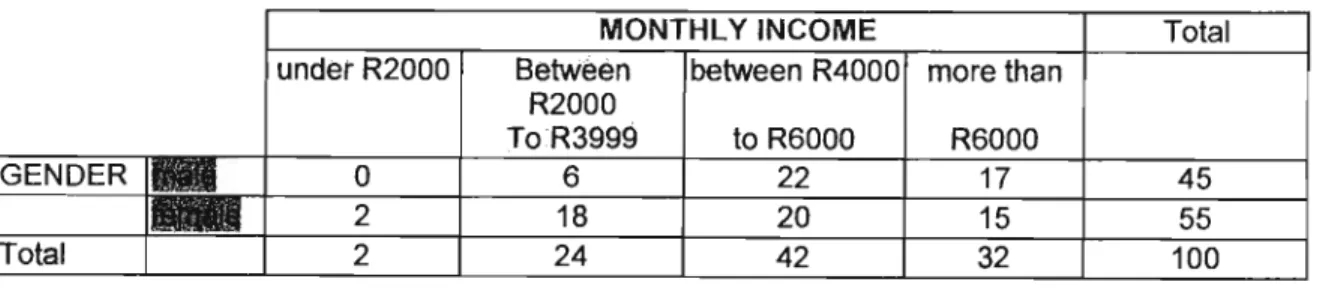
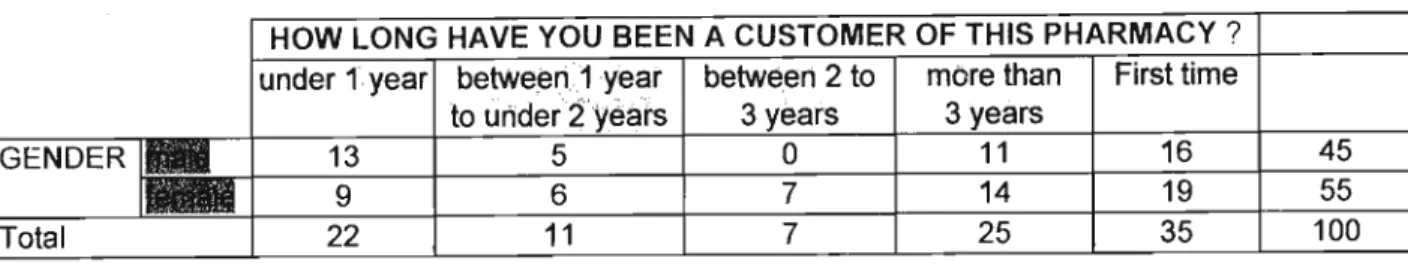
RESPONDENT PROFILING
Under.1.year between~,1 year between 2to more as First time toiJnder"?'years 3 years 3 years.
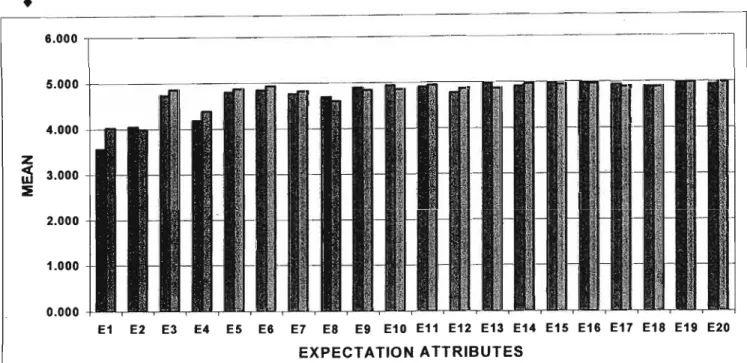
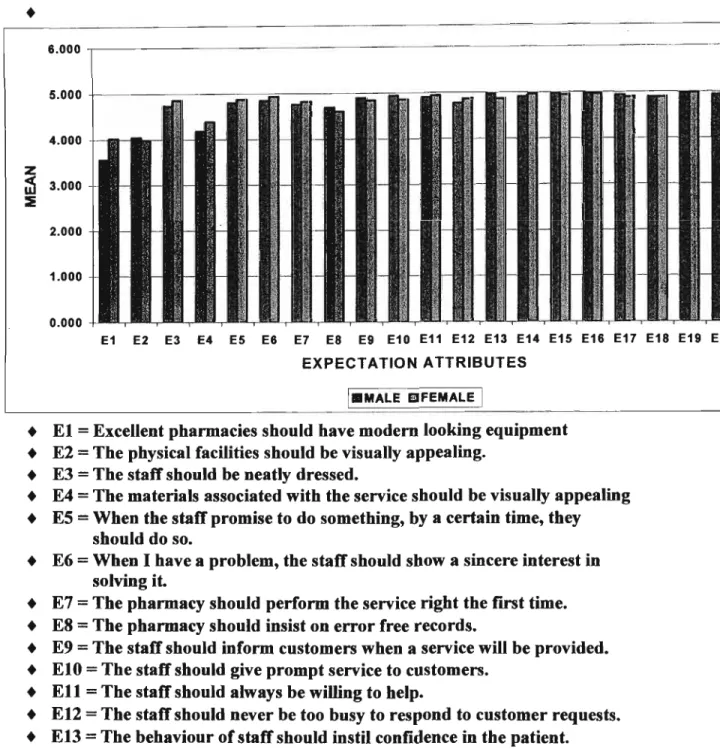
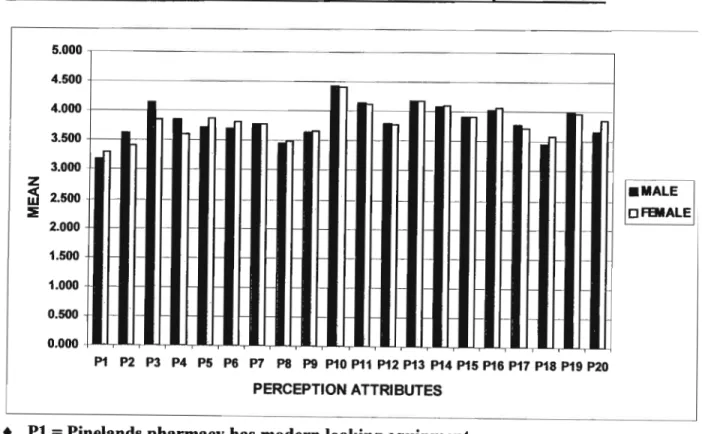
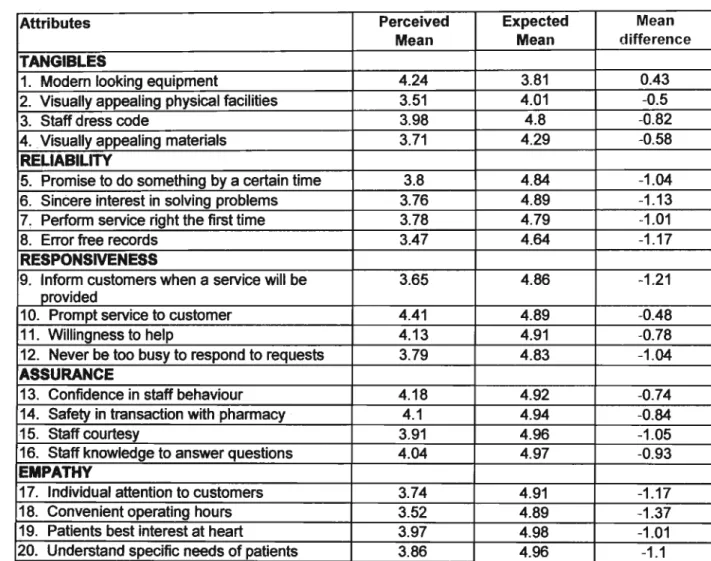
- SERVICE QUALITY DIMENSIONS OF CUSTOMER EXPECTATIONS AND PERCEPTIONS OF A RETAIL PHARMACY
- FACTOR ANALYSIS
- UNDERSTANDING PATIENT NEEDS
- ASSURANCE
- RELIABILITY
- EFFICIENCY
- TANGIBLES
- INDIVIDUAL ATTENTION
- STAFF PRESENTATION
- EFFICIENCY
- STAFF PRESENTATION AND CONVENIENT OPERATING HOURS
- PATIENT INDIVIDUALISATION
The staff must have the knowledge to answer patient questions. Patients must feel secure in their transactions with the pharmacy. Staff should never be too busy to respond to customized requests. Staff should understand the specific needs of their patients.
FACTOR2-PHARMACY STAFF COMPETENCE
STAFF PRESENTATION
AESTHETIC APPEAL
MODERN
- CLUSTER ANALYSIS
Cluster analysis was used to classify the 100 cases into homogeneous groups for the purpose of determining market segments of customers. Customers of services can differ from each other in many ways and at many times. Therefore, many different market segments can be found, which are based on the specific characteristics of the services.
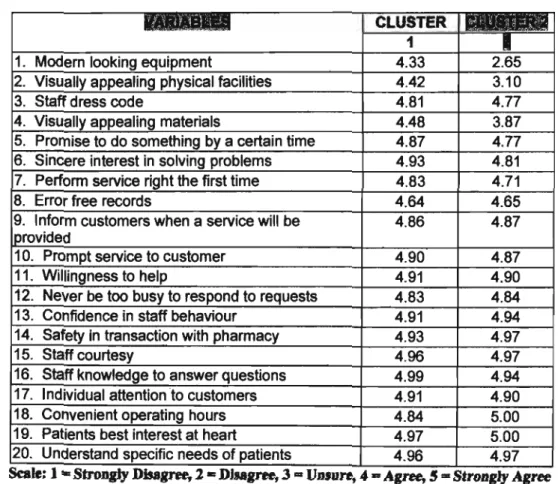
In an effort to identify market segments related to expectations and perceptions of service quality in a retail pharmacy, Tables 13 and 14 (below) have been generated. Analysis of Table 13 (see below) notes a noticeable difference between the two clusters with variables such as modern looking equipment and visually appealing physical facilities. Cluster 1 customers agreed (4.33 and 4.42) that they expected pharmacies to have modern-looking equipment and visually appealing physical facilities.
Thus, although the cluster analysis was attempted, it can be concluded that there was no noticeable difference between the two clusters. No clear market segments could therefore be identified, as the means for all other characteristics between the two groups were very close.
RESEARCH CONCLUSION AND RECOMMENDATIONS
- RESEARCH CONCLUSION The research explored 3 objectives
This indicates that the selected customers were very similar in their expectations and perceptions of service quality attributes. Patients need empathy and reliability to increase their trust in their pharmacist, as it concerns their health and thus their quality of life. 4 patients were given a magazine and had to make a collage by cutting out pictures from the magazine that symbolized their expectations of retail pharmacy services.
Patients must be able to rely on the honesty of the pharmacist and also receive support from other contact persons.
VERSATILITY
UNDERSTANDING
GUIDANCE
CHEERFULNESS
EFFICIENCY
The pharmacy should also take care of offering alternative therapies in terms of stocked products, in-store naturopaths, etc. By incorporating both conventional and alternative therapies, a well-balanced level of service can be achieved.
NEATNESS
PROFESSIONALISM
SINCERITY
PHYSICAL FACILITY
FOLLOW-UP
OPEN COMMUNICATION
SPECIALISED INDIVIDUALISED CARE
HIGH LEVEL OF CUSTOMISED CARE
TRUST
UP-TO-DATE
In order to complete this research, I would appreciate it if you would complete the attached questionnaire. Quality of service refers to how well a customer is served, including the extent to which the server helps the customer and the way the server operates. Based on your experiences as a patient at the pharmacy, think about the quality of service you EXPECT.
Please indicate to what extent you think such a pharmacy has the characteristics described in each statement. For each statement, indicate to what extent you think this pharmacy possesses the characteristic described in the statement. Again, circling 1 means you strongly disagree and circling 5 means you strongly agree.
Scree Plot for factor analysis of expectations
Scree Plot for factor analysis of perceptions