The ACRU model produced very acceptable statistics from storm flow simulations in the Afdeyu catchment compared to the SCS-based estimates. Curve number adjustment using Hawkins' water budgeting procedure The SCS-ACRU procedures to account for antecedent soil moisture.
RECOMMENDATIONS FOR FUTURE RESEARCH 108 1 Recomendations on Data Availability for Further Model Improvement 108
APPENDICES
Scatter plot of median prior storage changes, LIS, versus MAP (a) and simulated versus observed LIS values (b) for the entire set of 712 hydrologically relatively homogeneous climate zones in southern Africa, for catchments assuming sparse vegetation on shallow clay soils (SCSV 50. Scatter plot of median prior storage changes, LIS, versus MAP (a) and simulated versus observed LIS values (b) for the entire set of 712 hydrologically relatively homogeneous climate zones in southern Africa, for catchments assuming dense vegetation on deep sandy soils soils (DSDV) 51 Scatter plot of median prior storage changes, LIS, versus MAP (a) and simulated versus observed LIS values (b) for those hydrologically relatively homogeneous zones in southern Africa with a BWh climate, for catchments assuming sparse vegetation on shallow clay soils (SCSV) 52.
LIST OF TABLES
Afdeyu research catchment, as input to the ACRU model 88 Table 6.7 Land cover information used in the ACRU model for the Afdeyu research. SCS adjusted by AMC classes and the unadjusted SCS models for the five highest storm flows produced from the five highest daily rainfall.
LIST OF ABBREVIATIONS AND SYMBOLS AS WELL AS EXPLANATIONS OF TERMS
INTRODUCTION
In such an environment, estimates of storm volumes and peak discharges are highly sensitive to ASM, as antecedent watershed moisture conditions play a fundamental role in the hydrologic responses of individual rainfall events. The results and evaluation component of the dissertation begins in Chapter 5 with an overview of Eritrea from a hydrological perspective.
APPROACHES TO DESIGN FLOOD ESTIMATION FROM SMALL CATCHMENTS, AND MODEL SELECTION
- Stormflow Generation Theories: A Brief Overview
- Approaches to Hydrological Modelling
- Stochastic Models
- Calibration and Parameter Optimising Models
- Parametric (Conceptual) Models
- Deterministic Models
- Approaches to Design Flood Estimation
34 white box models, in which the physical processes of converting rainfall into runoff in a catchment are described in terms of mathematical relationships (Euroconsult, 1997; Kienzle et al., 1997). Deterministic models usually aim to simulate different components of the hydrological process of the spatial and temporal variation of the catchment (Kienzle et al., 1997).
Y SCS I
Selection of an Appropriate Design Flood Estimation Method for Small Catchments in Eritrea
The first step in flood estimation is choosing the flood estimation method to use. In light of the above, a selection had to be made of an appropriate design flooding method that could be suitable for wide application to small watersheds in Eritrea.
THE SCS-ACRU APPROACH TO STORMFLOW MODELLING
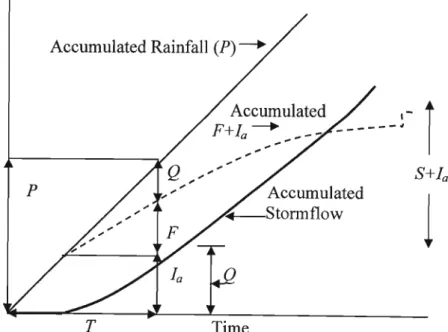
- The SCS Method and its Components
- One Day Rainfall Depth
- Hydrological Soil Groups
- Derivation of Curve Numbers
- Curve Number Adjustment using Hawkins' Water Budgeting Procedure
- The SCS-ACRU Procedures to Account for Antecedent Soil Moisture
Reynolds (1970) suggested that the main causes of soil moisture variability can be divided into two broad groups. Most of the discussion in this section therefore relates to the variability of soil moisture.

THE KOPPEN CLIMATE CLASSIFICATION SYSTEM AS AN INDICATOR OF REGIONAL INDICES OF CHANGES IN SOIL
MOISTURE STORAGE
Introduction
This illustrates, among other things, that the role of rainfall seasonality is decisive when evaluating the regional groundwater status. The aim of this chapter is therefore to approach the groundwater status of a catchment as a climatologically driven variable, based on the hypotheses outlined in the introductory chapter.
Climate Classification Systems
- Thornthwaite's Classification System
- FAO Agro-Ecological Zones (AEZ)
An index of 0 marks the boundary between wet and dry climates (Ahrens, 1994). The temperature and humidity provinces are illustrated in Figure 4.1. A subzone boundary occurs when another plant association occurs in zone areas. The AEZ classification provides a “regional” level of ecological integration (FAO, 1996; FAO, 2002).

Selection of a Climate Classification System
- Background to the 712 Relatively Homogeneous Hydrological Zones
- The Koppen Climate Classification for Southern Africa
- Analysis of the Variability of Soil Moisture Storage within Each Kdppen Climate Class
What follows is an application of the Koppen climate classification system to the 712 relatively homogeneous zones identified in southern Africa by Dent et at. 1988), to assess whether, within each Koppen climate zone in southern Africa, unique relationships exist between LlS and a simple climate variable, viz. The following sections, which describe the application of the Koppen climate classification system to the 712 relatively homogeneous hydrological areas of South Africa and the analysis of the 712 areas according to each Koppen climate class (KCC), are structured as follows: In section 4.4.1 the general background of the 712 sites is discussed, as well as the procedures used to estimate typical LlSi values required for CNn regulation in southern Africa. Long-term (~30 years) daily precipitation and temperature records were used at each of the 712 sites with the ACRU model, which was used for each of 3 soil texture, 3 soil depth, and 3 land cover combinations to calculated soil moisture status. before any storm-producing precipitation event.
Maharaj (2003) wrote a FORTRAN program to identify Koppen climate classes using the above databases and is given in Appendix B.

Figure 4.12 Scatter plot of median antecedent storage changes, LlS, vs MAP (a) and simulated vs observed LlS values (b) for those hydrologically relatively homogeneous zones in southern Africa with a BWk climate, for catchments growing intermediate vegetation on intermediate loamy soils assumed (IUV). The goodness of fit of the regression equation is high for the SCSV scenario (Figure 4.11 a), but poorer for the ILIV and DSDV scenarios (Figures 4.l2a and 4.l3a). Consequently, the estimated LlS values are better simulated in the SCSV (Figure 4.11 b) than in the ILIV and DSDV scenarios (Figures 4.12b and 4.13b).
Cjbreregions have a maritime climate in which the prevailing winds bring moisture from the oceans (Ahrens, 1994). In southern Africa, Cfb climates are mainly distributed along the southern coast of the country (see Figure 4.2). The climate is mild due to changing effects of the ocean.

1 III
Conclusions
This chapter first analyzed the variability within each Koppen climate class identified in southern Africa in order to highlight the potential for estimating LlS by climate zone. In the analysis of variance, CVsofLlSwithin each identified KCC were found to be minimal, except in Cwa climate for SCSV, Cwb climate for ILIV and Csb and Cwb climate for OSDV scenarios, where variability eLlScales a threshold limit (2CV). This high degree of homogeneity or uniformity of LlS within each KCC for a broad representation of soil texture/soil depth and land cover combinations promoted a desirable relationship between LlS values in relation to MAP distribution within each specified KCC. As can be seen from Figures 4.5 to 4.34, LlS values are strongly related to the distribution of MAP within each of the NCCs, in which rainfall seasonality and temperature distribution remain similar.
The good simulations of LlS of MAP by the regression equations unique to each KCC show that the Koppen.
AN OVERVIEW OF ERITREA FROM AN HYDROLOGICAL PERSPECTIVE
- Previous Attempts at Stormflow Modelling in Eritrea
The only soil map available in Eritrea is from the FAO-UNESCO World Soil Map. According to FAO, 28 major soil groups have been identified in Eritrea. They are susceptible to erosion and cover about 10% of the total area of Eritrea (FAO, 1994).
As such, the calibration sites covered catchments in all major river basins of the country.

TESTING THE SCS-ACRU-KOPPEN APPROACH ON A SMALL CATCHMENT IN ERITREA
- Introduction
- Background Information on the Afdeyu Research Catchment
- Location
- Rainfall
- Simulation of Peak Discharges from the Afdeyu Catchment
- Simulating Stormflows from the Afdeyu Catchment using the SCS-ACRU- Koppen Approach
- Rainfall Depth
- Conclusions
Soils in the Afdeyu catchment are mainly Cambisols developed on metamorphic volcanic material of Proterozoic age (Ghebremedhin, 1998). The sand, silt and clay content for the two horizons of the research catchment are given in table 6.4. It was also found for the Afdeyu catchment that the application of the ACRU-Koppen method using LIS to calculate a CN.
The slopes for the ACRU and ACRU-Koppen methods are much closer to unity than for any of the other CN adjustment methods.

DISCUSSION AND CONCLUSIONS
The first hypothesis was tested by applying the Koppen climate classification to the 712 relatively homogeneous hydrological zones that have been identified in southern Africa. A high degree of homogeneity of L1S was observed within each individual KCC identified in southern Africa. The values of L1S, which were previously calculated with the ACRU model by Schmidt and Schulze (1987), are highly correlated with MAP within each of the KCCs identified in southern Africa.
The coefficient of determination and efficiency coefficient of the ACRU-Koppen are significantly higher than those of either of the two methods for CN adjustments.

RECOMMENDATIONS FOR FUTURE RESEARCH
- Recommendations on Data Availability for Further Model Improvement
- Recommendations on Estimation of Change in Soil Moisture Storage Change, AS
The same should be done with long-term rainfall: runoff data from other study catchments to validate the concepts that are part of the SAK approach. Temporal variations in precipitation are likely to have as strong an impact as spatial variations in soil water balance. In Appendix A, the procedures for using the SCS-ACRU-Koppen (SAK) modeling approach are presented in the form of a simple user manual, as a guide to hydrologists/.
It provides a detailed outline of the steps required to determine stormflow volumes and peak discharges from small catchments in Eritrea.
An analysis of the effects of spatial variability of soil and soil moisture on runoff. Feasibility Study for Rehabilitation and Expansion of the Aligidir Irrigation Project on the Gash River, Eritrea. Long-term monitoring of soil erosion and soil and water conservation in Afdeyu, Eritrea.Copy Quick Printing Center, Flamatt, Berne, Switzerland.
Evaluation of soil hydrologic groups as used in the SCS runoff method on pastures.
APPENDIX A
SCS-ERITREA
This user manual outlines the SAK modeling procedures to assist engineers and hydrologists responsible for the design and planning of hydraulic structures in small river basins in Eritrea. The SCS-Eritrea User Manual is based on the methodologies presented in the SCS Design Manuals for Southern Areas. Africa by Schulze and Arnold (1979), Schmidt and Schulze (1987) and Schulze et al. Properties of the regional climate (for example, the amount of precipitation and its seasonal distribution, as well as the solar radiation received by an area); The determination of the two unknowns in equation 2.14, namely the time distribution of the design precipitation intensity and the catchment response time, is discussed in the following subsections.
SCS User Manual as they provide guidance on the information and data that must be entered to run the program. The user requires Adobe Acrobat software to access the electronic version of the SCS-LHl User Manual.

Climate Class
Polar climates Warmest month average temperature is <10°C T - Tundra Warmest month average temperature is >O°C but< 10°C E F - Ice cap Warmest month average temperature isO°C or below . Table 4.3 Regression equations developed from hydrological zones having similar Koppen climate classes in southern Africa, for a combination of three soil depth categories, three soil texture classes and three vegetation cover conditions. An analysis of regional crop water demand deficits for irrigation planning in southern Africa. ACRU Report No. 28.
SCS-SA User Manual, PC-Based SCS Design Flood Assessments for Small Catchments in Southern Africa. ACRU Report No.