SASOL has requested an investigation into the feasibility of separating and purifying butyric acid and isobutyric acid from this waste acid stream. The objective of this project was to determine a separation and purification route for butyric acid and isobutyric acid from SASOL's waste acid stream.
LIST OF TABLES
NOME NCLATURE"
C HAPTER ONE
CHAPTER 1 INTRODUCTION
For this project, distillation was chosen for the recovery of the valuable acids and crystallization was chosen to purify the acids. A lowsheeting program (Ny,\ys) was used to simulate the distillation process for recovering the valuable acids from the waste acid stream.
CHAPTER TWO
LITERATURE REVIEW
LITERATURE REVIEW
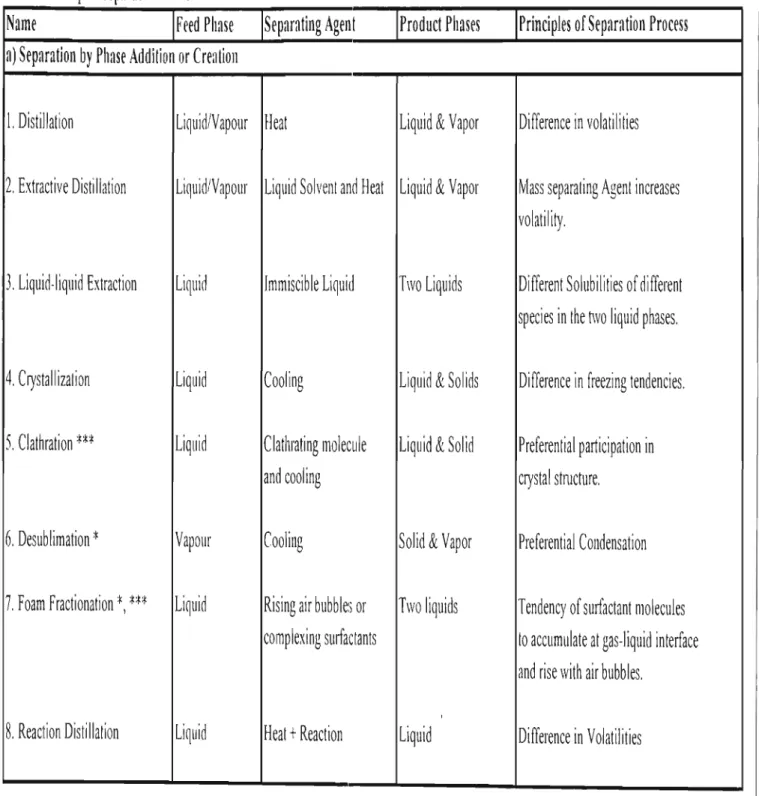
- Crystallization Liquid Cooling Liquid & Solids Difference in freezing tendencies
- Clathration *** Liquid Clathrating molecule Liquid & Solid Preferential participation in
- Electrodialysis *** Liquid Anionic and Cationic Liquids Tendency of anionic membranes Membranes + Elecctric to pass only anions etc
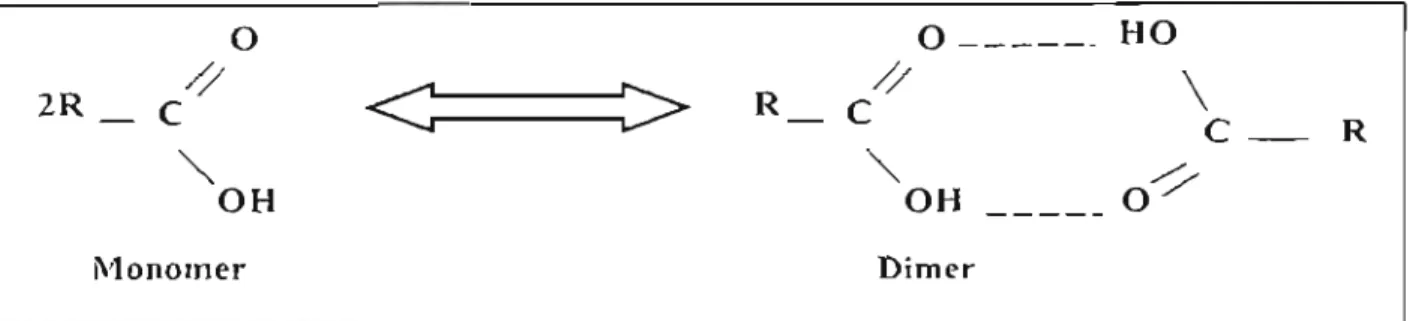
- Chemistry of carboxylic acids
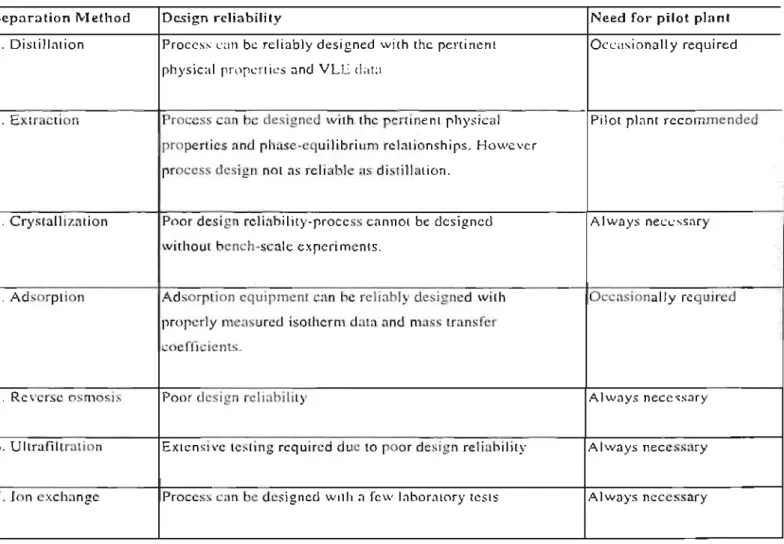
- Factors affecting the choice of a separation process
There are also isomers of carboxylic acids and the isomers present in the waste acid stream are also shown in Table 2-2. Carboxylic acids can be prepared in Inbonllory in several ways as shown in Figure 2-2.
LITERATURE REV IEW
For this project, establishment of feed conditions involved identification of the various components of the waste acid flow and the temperature. Research by Kertes et al [1990] also showed that amides could be used to separate the acids from the rest of the waste stream.
CHAPTER THREE
VAPOUR-LIQUID EQUILIBRIUM
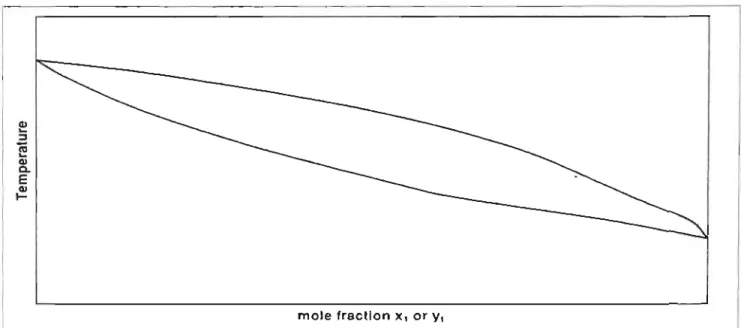
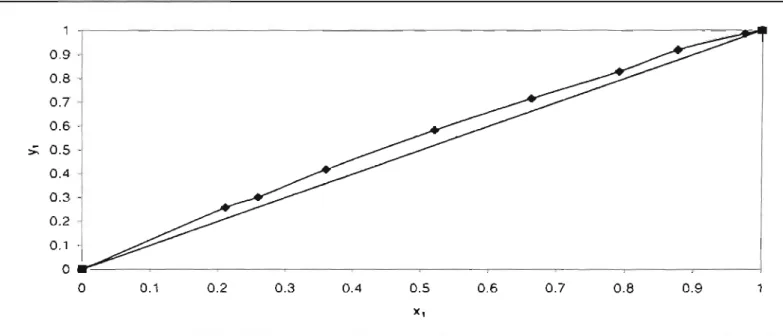
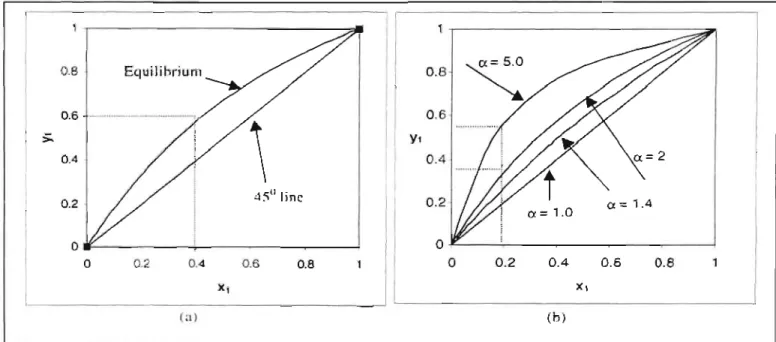
In Figure 3-2a, x and yax show the concentration of the more volatile component in the liquid and vapor phases, respectively. Drawing the dashed lines in Figure 3-2a shows how a liquid mixture containing 0.4 mole fraction of the more volatile component in the liquid is in equilibrium with vapor containing 0.6 mole fraction of the same component.
CHAPTER 3 VAPOUR-LIQUID EQUILIBR IUM
-7) where i and j are monomer molecules and ij is the complex (dimer) formed by hydrogen bonding. The chemical equilibrium constant can be found from the relation: -(2- 8,)BIJ. where: S,t is the dimerization contribution to the second virial coefficient as calculated by the Hayden & O'Connell method [1975J. The calculation of the fugacity coefficient for the components i and j is therefore carried out by solving the above equations with the constraint that the sum of z,. zJ and z,J equal to I. The Hayden and O'ConeH method is a procedure for calculating contributions to the second virial coefficient.
VA POU R- LIQUID EQUILIBRI UM
VA POUR-LIQUID EQU ILIBR IUM
CHAPTER 3 VAPOUR-LIQU ID EQUILIBRIUM
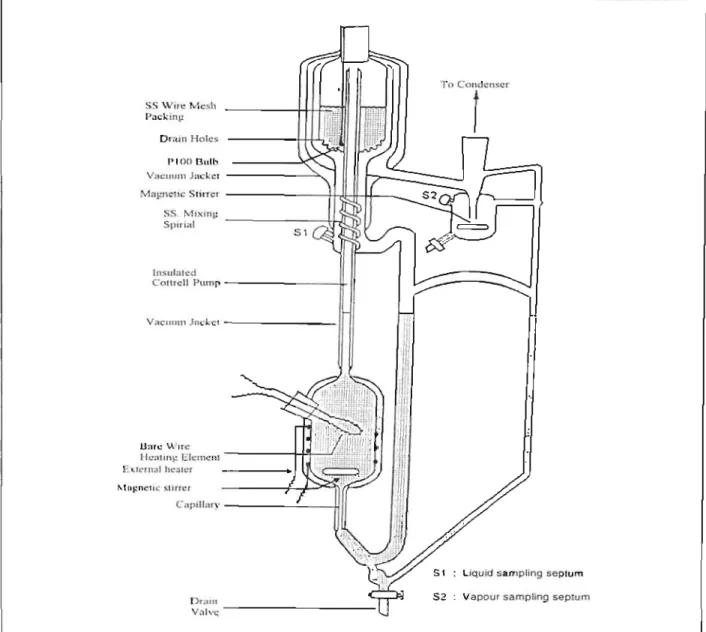
The use of packing in the equilibrium chamber ensures rapid attainment of equilibrium due to the intimate action between the vapor and the liquid and the expansion of the interface surface. Mixing in the boiling chamber that ensures complete mixing of the returned condensate before evaporation. This feature ensures rapid boiling, allows precise control of circulation speed, and provides nucleation sites for smooth boiling.
A Eurothcrm temperature display was used to indicate the resistance of the PT-lOO temperature sensor embedded in the equilibrium chamber.
VA POUR-LIQU ID EQUILIBR IUM
- Experimental Procedure
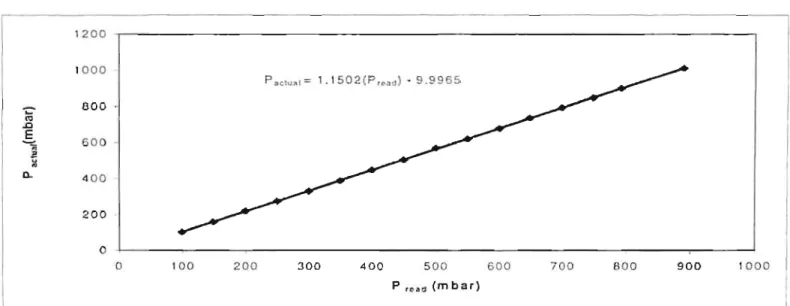
The true temperature is determined by boiling a pure component in the kettle at several different pressures. Provided the chemical is of high purity (>99.5% pure) and the pressure calibration is correct. A plot of these true temperatures versus the temperature reading gives a linear relationship and can be found in Appendix 8-4 (Figure 8-2).
VAPOUR-LIQUID EQUILIBRI UM
It is suggested to start with a pure component and then add more and more of the second component until the entire composition range is covered. It is also important to provide sufficient heat in order to achieve a fairly rapid pumping action and good circulation. The equilibration time varies for many components and is suggested after the temperature has stabilized.
Vapor and liquid samples are removed through sample baffles and analyzed by gas chromatograph.
CHAPTER 3 VAPOUR-LI QUI D EQUI LI BRI UM
VAPOUR-LIQUID EQU fLI BRJUM
VAPOUR-LIQU ID EQUILIBRI UM
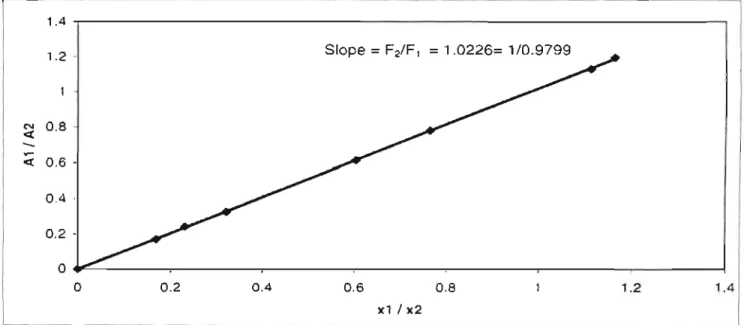
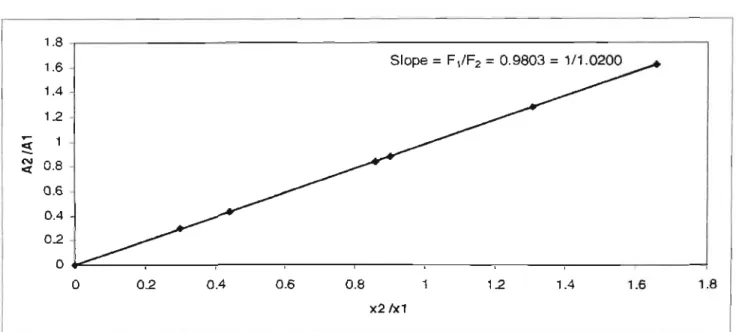
The purities of the reagents were also checked by their refractive indices and comparisons with literature values are shown in Table ~-4. The results for the cyclohexane + ethanol system are listed in Table 3-2 and shown in Figures 3-9 and 3-10. Because the experimental data for the cyclohexane + ethanol compared well with the literature data (which were also found to be thermodynamically consistent).
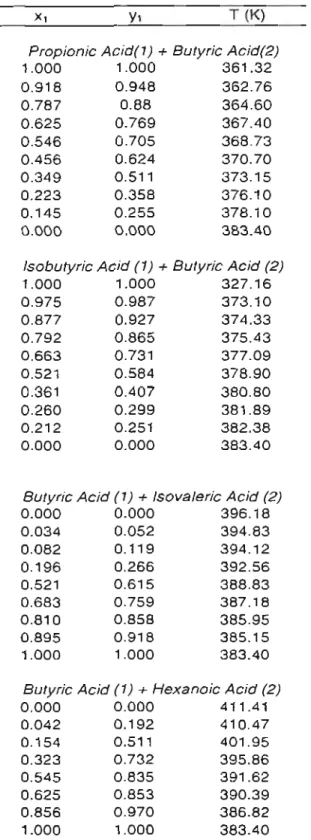
Results for binary vapor-liquid equilibria for systems involving butyric acid are presented in Table 3-3 and Figures 3-11 through 3-18.
VAPOUR·LIQUID EQU ILIBRI UM
For this project, the NRTL model was used to describe the liquid phase and the virial equations of state for the vapor phase. The process simulator requires interaction parameters for the NRTL model and these parameters were calculated by modeling the experimental data using the gamma·phi approach as discussed by Raal & Miihlbauer [1998] . VLE data reduction is discussed in many thermodynamics texts and is also discussed by Joseph [2001] and Harris [2001] .
The calculated T-x-y curve for the isobutyric acid + butyric acid system (Figure :\-20) does not predict the experimental data very well.
CHAPTER 3
CHAPTER
FOUR
DISTILLA TION
DIST ILLATI ON
The use of the McCabe·Thiele method in screen distillation to separate butyric acid from isobutyric acid is shown in Figure 4·2. This is based on the fact that in a typical distillation, the current levels of non-key components approach a constant. Therefore, this method should not be used if the presence of non-core components has a significant impact on the volatility of the core components.
For u!'>c Equation (4-1) estimates the number of stages in total;11 rcflux and the minimum lightning reflux.
DISTILLATION
- Hysys simulation
- Simulation Results
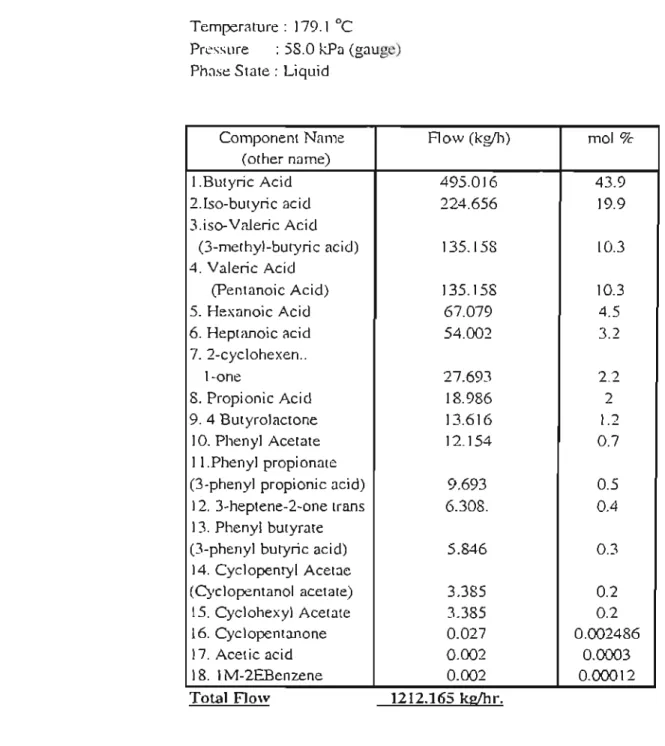
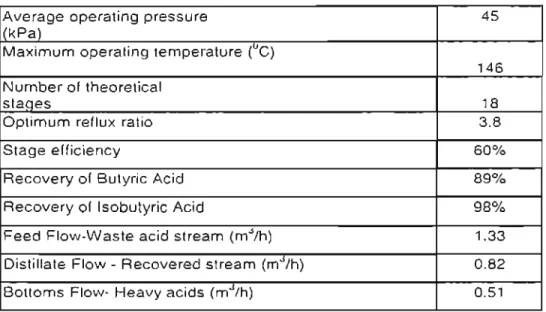
Estimates of feed stage location are also required for specification in rigorous distillation methods. ZIIK.ZJ K = mole fractions of heavy key and light key components in source B. Data for the composition and current of the waste acid stream ns supplied $asol (Table 2-5) were used to define the feed stream for the shortcut distillation.
Though. this can lead to design uncertainty. the rationale for his approach is the assumption that the nonkey components do not affect the volatility of the key components.
CHAPTER FIVE
BATCH DISTILLA TIO N
- BATCH DIS TILLAT IO:-'
- BATCH DISTILLATION
- Experimental Procedure
- Results and Discussion
- CIIAPTER 5 BATCII DISTILLATION
- CHAPTER 5 BATCII DISTILLATION
The feed mixture is introduced through the bottom and the desired product is removed through the top of the column (distillation). This column is also called a "batch stripper", where the feed mixture is introduced at the top of the column and the desired product is removed from the I'cboiler (bOHOIllS). Tht: The first batch distillation (batch I) was an all emp pt to recover more th,m 80% of the butyric and isobutyric acid from the waste acid stream. CHAPTER SIX This is because most solids are immiscible with other solids due to the 10 geometry of the crystal lattice of the different substances. At this point, the two-phase system consists of solid A and a liquid with a eutectic composition determined by point D. Any further cooling causes the eutectic solution to solidify. The only limitation is that enough of the crystallizing component must remain in the solution to prevent the liquid phase from reaching the eutectic point. This is because the installation and operation of a distillation column is cheaper compared to crystallization equipment. Equation (6-7) is used to predict the solid-liquid phase behavior for preliminary process design calculations. The data required is the latent heat of fusion at the melting point temperature. the melting temperatllre nnd the nctivit)' coefficient of the solution. This relationship is determined from the solid-liquid equilibrium of the binary mixture and was measured by 011 Cl al (19721 and is shown in Figure 6-4. The solid-liquid equilibrium curve for the isobutyric acid/butyric acid system as predicted by Equation (6-8) is shown in Figure 6-5. Table 6-1: Results of cr~'s lalliZ3 HOIl ex pel"i III enl Butyric Acid Isobutyric Acid (mole fraction) (mole fraction). It is assumed that a small amount of the isoblllyric acid was carried from the liquid phase with the solid when separating the two pHs. This resulted in the small amount of isobutyric acid in the solid phase analysis. Although purification of butyric acid by freeze crystallization has been experimentally verified. Butyric and isobutyric acids can be classified as fine chemicals because they are currently produced in lower volumes and are required to meet 10 lighter specifications for their functions in food additives and pharmaceuticals. One of the major costs in determining economic viability is the fixed capital Investment cost. This method is based on knowledge of the most important items of equipment required for the separation and purification of the acids. Knowing the main unit operations (Distillation and Crystallization), the plant capacity (ID OOOtpa). Operating costs: are the costs that occur over the life of the project and are directly related to production. Due to the nature of the markets, production on this scale could lower the current market prices of the acids, which is undesirable. Therefore, it may be considered to treat a small amount of the acid waste initially and then steadily increase the scale of production using batch equipment. In this way, the current market prices of the acids can be maintained because batching equipment has the unique property of separating a variety of feed mixes that easily meet the frequent changes in market demand. Because fractional crystallization is more efficient than the conventional way of using two separate devices for distillation and crystallization, it may also be worthwhile to consider further studies investigating fractional crystallization for this project. -Liquid Equilibria in Binary Mixtures of Organic Compouncb", Fluiti Faza Eqllilihrin, Volume Computer-Aided Measurement of Vapour-Liquid Eql1ilibria in a Dynamic Still at Sub-Atmospheric Pressures, MSc, Thesis, University of NatalEc1, J. Properties of binary systems with diactyl from ;1 Computer Controlled Vapor-Liquid EC]uilibriulll $till", Fluid Plws(' Equilibria. Olson, H J, Sandler, S I Sensitivity of Distilntion Process Design and Opemtion to Vapour-Liquid Equilibrium, D. /rial mul Kimi Engineering, Process Design (Iml Dcvelopmtlllf, Vol. Journal of efli'lI/ieal 71lermodYllllllfics, Vol. Distillation Column Sensitivity to Uncertainties in Vapor-Liquid Equilibrium Information", SeparaTion Sciel/('{' {//U/ Techllology. The physical properties of all components present in the waste acid stream are shown in Table A-2. All critical properties were obtained from Reid et al [1987]. Nonn:ll boiling points. density ~ . freezing points and stability were obtained from 11 WeaSI l1983J. Dipole moments. accentuation and radius of curvature were obtained from Prausnitz et I [1980]. The program given for the butyric acid (I) + valeric acid (2) system at 14Kpa is shown. According to the Gibbs·Duhem equation, the right-hand side of the equation should (B-:n) ! be zcro for consistent data. The residual on the left is therefore a direct measure of deviation!' from the Gibbs-Duhem equation. The degree to which values of this residual filii to spread around zero measures the deviation of data from thermodynamic consistency. First, the VLE data is reduced llsing 2,(8g)2as the objective function and second, the remaining 8 1n (yJyJ) is determined. Operating Cost Estimation![Figure 5-]; E.xpc l"im c ntal se t-up for bnt c h dis tillation.](https://thumb-ap.123doks.com/thumbv2/pubpdfnet/10631007.0/100.918.113.883.379.868/figure-e-xpc-34-ntal-bnt-dis-tillation.webp)
FREEZE CRYSTALLIZA TION
FREEZE CRYSTALLISATION
FREEZE CRYSTAL LI SATION
FREEZ E CRYSTALLISATION
ECONOMIC F E ASIBILITY
ECONOM IC FEASIBILITY
ECONOMIC FEASIBILITY
CHAPTER E I GHT
Recommendations
REFREN CES
A PPEN DIX A
APPENDIXB
APPENDIX II
S Thermodynamic consistency tests