ANALYSIS OF CAUSES OF DEATH AT HOME AND IN A PUBLIC HOSPITAL CAPRICORN DISTRICT OFLIMPOPO PROVINCE
by
SAM THEMBELIHLE NTULI
Submitted in accordance with the requirements for the degree of DOCTOR OF SCIENCE
In the
Department of Medical Science in the Faculty of Health Sciences at the
UNIVERSITY OF LIMPOPO, SOUTH AFRICA
Supervisor:Professor Marianne Alberts Co-Supervisor: Professor Peter Byass
2015
DECLARATION
I, Sam Thembelihle Ntuli declare that the work herein submitted as a thesis for Doctor of Medical Science resulted from my own investigation and that it has neither wholly nor partially been presented as a thesis for a degree at the University of Limpopo. Work by other authors who served as sources of information, have dully been acknowledged by references to the authors.
Ntuli TS Date
FACULTY OF HEALTH SCIENCES UNIVERSITY OF LIMPOPO
TURFLOOP CAMPUS SOUTH AFRICA
DEDICATION
I dedicate this thesis to:
• My late father Jerry Simo Ntuli, my brother Thokozani Dunford Ntuli, my wife’s father, who has also passed on, Nicolas Mashiya;
• My brother’s son Bongani, my younger sisters Nomalanga, Tshadi and Mpho, my elder brother Thulani;
• Mylate mother, Jeannett Tshadinyana Ntuli, who took pride in the achievements of her children, and who taught us that the best gift you can give to a child is education and love;
• The families of those who passed on in the Pietersburg/Mankweng Hospital Complex (PMHC)and Dikgale Health and Demographic Surveillance Site (HDSS);
• My wife Constance, my three children: Thokozile, Masello and Sibusiso for their love, understanding and support throughout my study period.
ACKNOWLEDGEMENT
First of all I would like to thank Lord Jesus Christ for wisdom, strength and the grace upon my life. I would also like to express my sincere thanks and gratitude to my supervisors Professor Marianne Alberts and Professor Peter Byass for their encouragement, support, understanding, patience, kindness and guidance through the worst times. Thank you, Professor Byass for the long hours spent in reading and discussing the materials with Professor Alberts.
My sincere gratitude also goes to the following people who assisted me directly and indirectly in the completion of this thesis:
• The authorities of the Department of Health and Social Development Limpopo Province, for allowing me to access confidential patient information
• Joseph Wamukuo, Anita van Jaarsveldti and Doctor Petero Anguria for helping me when compiling my proposal and the report;
• Professor Daniel Ncayiyana, Professor Gustav Malangu and Professor T Mashego for providing useful comments and suggestions;
• Librarians, Records clerks, mortuary attendants and information officers of the Pietersburg/Mankweng Hospital Complex Hospital (PMHC) for their cooperation during the progress of the research;
• Staff of the Maternity Department of the Pietersburg Hospital, especially K.L Mohlake and T. Esterhuyse for their co-operation during data collection;
• Lastly, the wonderful fieldworkers who collected “causes of death” data in the communities of Dikgale DHSS, and the families who participated in the verbal
ABSTRACT
Objectives
The objectives of the study were to examine the demographic profile and causes of death of people dying in a hospital and community; and to determine mortality rates, specifically age- and gender-specific mortality rates in a community. The study also compared causes of death assigned to hospital records with causes of death obtained from verbal autopsy reports.
Methodology
The data used in this thesis were collected in two phases. The first phase involved a retrospective review of all deaths that occurred in the Pietersburg/Mankweng Hospital Complex from 1st January, 2011 to 31st December, 2012. The second phase involved a community-based study using a verbal autopsyto determine cause of death in Dikgale HDSS for the same period.
Results
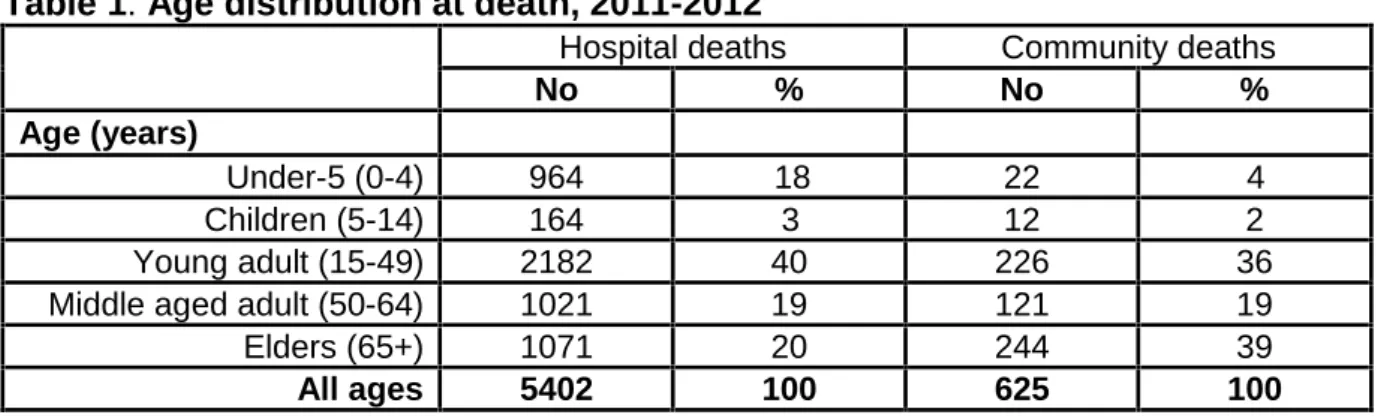
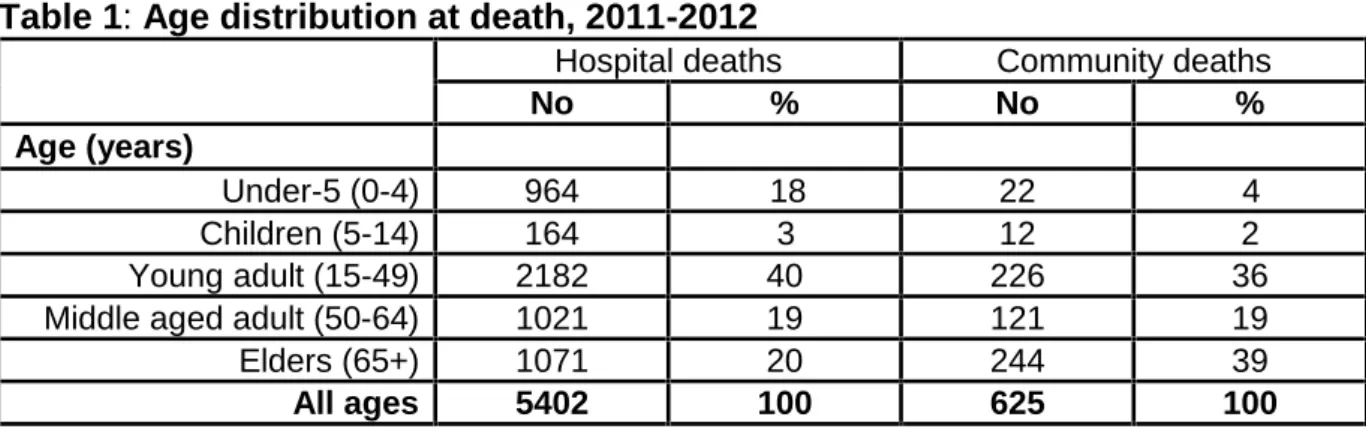
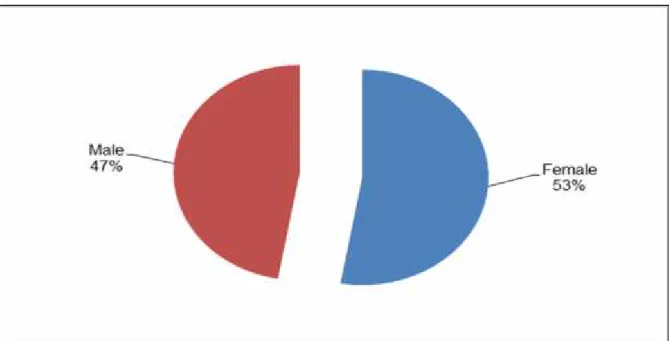
A total of 5402 deaths were reported in the hospital and 625 in the community. The majority of deaths in the hospital involved adults in the 15 to 49 year old age group, while in the community more deaths were recorded amongst adults aged 15 to 49 years of age and those in the 65+ year old age group. There were more male deaths in the hospital, while in the community a higher proportion of deaths occurred amongst females.
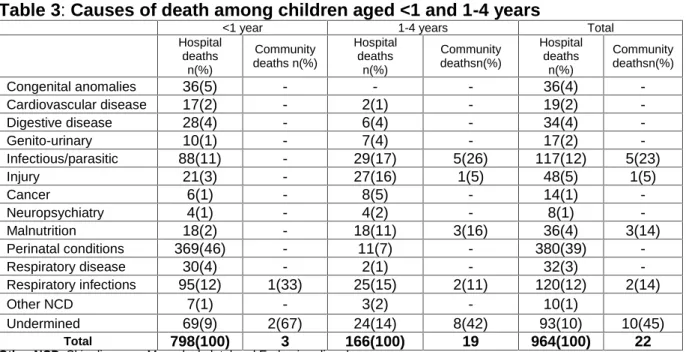
In children less than1 year old, the cause of death in the hospital was predominantly due to perinatal conditions, particularly preterm birth, low birth weight and birth asphyxia; while in the community, of the 5 deaths in this age group, infectious diseases were recorded as the main cause of death. Amongst children in the 1 to 4 year old age groups causes of hospital deaths were dominated by infectious diseases, injuries and malnutrition; while in the community infectious diseases were the main cause of death.
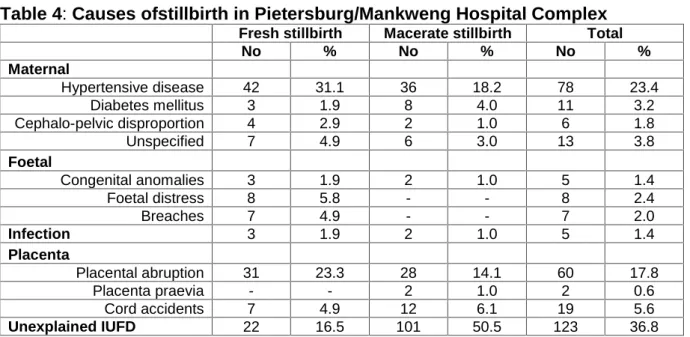
Stillbirths were noted in the hospital with a stillbirth rate of 29.1/1000 deliveries. In the community no stillbirths were reported. More than half of the stillbirths were caused by unexplained intrauterine foetal causes followed by maternal hypertension in pregnancy and placenta abruption.
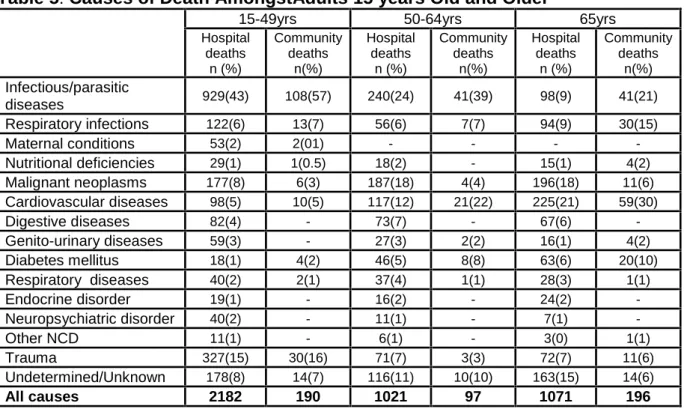
For adults in the 15 to 49 year old age groups infectious diseases, such as HIV/AIDS and tuberculosis, were the leading causes of death in both the hospital and in the community. The proportion of deaths due to HIV/AIDS and tuberculosis was significantly greater in the community than in the hospital.
Amongst adults in the 50+year old age group non-communicable diseases, particularly cardiovascular diseases and cancers were the most common causes of death. In this age group, the hospital recorded more cancer deaths than did the community; while the community recorded more cardiovascular deaths than did the hospital.
The overall mortality rate in the community was 8.4 deaths per 1000 person-year, with more deaths occurring amongst males (8.9 deaths per 1000 person-year). The mortality rate was high amongst adults in the 65+ year old age group (48.9 deaths per 1000 person-year).
When comparing cause-specific mortality between hospital cause of death notification forms and cause of death determined by verbal autopsy reviews, the same top five underlying causes of death were observed, namely: cardiovascular diseases, infectious diseases, diabetes mellitus, malignant neoplasms and respiratory infections. The agreement between causes of death reported on cause of death notification forms and cause of death as a result of a verbal autopsywas 48%.
For individual causes, agreement of more than 80% was achieved between cause of death recorded on cause of death notification forms and from verbal autopsy reviews for respiratory infections, diabetes, malignancies and injuries. Infectious diseases (68.5%) and cardiovascular diseases (74.1%) achieved the lowest agreement. In other words, in only 68.5% and 74.1% respectively was the cause of death as recorded on the “cause of death notification” forms the same as the cause of death when reviewed verbally.
Furthermore, 13 deaths were recorded as being due to cardiovascular diseases on the “cause of death notification” forms, however, in only 5 of these cases was the cause of death recorded as the same in the verbal autopsy report. In 21 cases cause of death was attributed to infectious diseases on the cause of death notification form,
while in only 13 of these cases was the cause of death similarly ascribed after verbal autopsy review.
Conclusion
This study showed that the verbal autopsy instrument has the potential to identify causes of death in a population where deaths occur outside of health facilities.
Procedures for death certification and coding of underlying causes of death need to be streamlined in order to improve the reliability of registration data. This will be achieved if medical students and trainee specialists are trained in the completion of cause of death notification forms.
Foetal autopsies should be introduced at tertiary hospitals to determine the causes of stillbirths.Antenatal care education for pregnant women should be encouraged because the level of antenatal care has an influence on the health of mothers and their newborns.
The government should continue to focus on improving the socio-economic status of the population, while adequate foetal monitoring by health workers may reduce neonatal deaths resulting from preterm births, low birth weight and birth asphyxia.
Innovative injury prevention strategies, interventions to control infectious diseases, cancer screening and lifestyle program may reduce adult mortality.
TABLE OF CONTENTS
Table of Contents
DECLARATION ... i
DEDICATION...ii
ACKNOWLEDGEMENT...iii
ABSTRACT...iv
LIST OF FIGURES ...xi
LIST OF TABLES...xi
LIST OF ABBREVIATIONS AND ACRONYMS ...xii
PAPERS PREPARED FROM THIS THESIS... xiii
CHAPTER 1: INTRODUCTION... 1
1.1 Background of the study ... 1
1.2 Rationale and Problem Statement of the Study... 6
1.3 Research Question ... 7
1.4 Research Hypothesis... 7
1.5 Aim and Objectives ... 7
1.5.1 Aim ... 7
1.6 Summary ... 8
CHAPTER 2: LITERATURE REVIEW ... 9
2.1 Introduction... 9
2.2 Verbal Autopsy ... 11
2.3 Gender and Age at Death... 14
2.4 Causes of Mortality... 17
2.4.1 Causes of Stillbirth ... 17
2.4.3 Causes of Death in Children between the Ages of 1 and 4 Years of Age ... 24
2.4.4 Causes of Death in Children between 5 and 14 Year of Age... 26
2.4.5 Causes of Death in Adults (older than 15 Years of Age)... 28
2.4 CommunityMortality Rates... 34
2.6 Agreement of Causes of Death between Hospital Records and Verbal Autopsy Reports... 36
2.8 Summary ... 39
CHAPTER 3: METHODOLOGY... 41
3.1 Introduction ... 41
3.2 Study Design ... 41
3.3 Study settings ... 41
3.4 Sampling Technique and Sample Size... 43
3.5 Data Collection ... 43
3.6 Data Analysis... 45
3.7 Validity, Reliability and Bias ... 47
3.8 Ethical Considerations ... 47
3.9 Summary ... 48
CHAPTER 4: CAUSES OF MORTALITY ... 49
4.1 Introduction ... 49
4.2 Gender and Age at Death ... 49
4.3 Causesof Death... 51
4.4 Causes of Death by Age-Group... 53
4.4.1 Causes of Childhood Death (<1 year, 1-4 years and 5-14 years) ... 53
4.4.2 Causes of Death in Adults Aged 15 to 49 Years Old... 55
4.4.3 Causes of Death in Adults Aged between 50 and 64 Years of Age ... 56
4.4.4 Causes of Death in Adults 65 Years of Age and Older: ... 57
CHAPTER 5: COMMUNITY MORTALITY RATES ... 59
5.1 Introduction... 59
5.2 Population Size, Age and Sex Distribution in the Community ... 59
5.3 Age and Gender Specific Mortality Rate in the Community... 60
5.5 Summary ... 62
CHAPTER 6: AGREEMENT OF CAUSES OF DEATH BETWEEN HOSPITAL RECORDS AND VERBAL AUTOPSY ... 63
6.1 Introduction ... 63
6.2 Demographic Profile of the Deceased ... 63
6.4 Agreement of Causes of Death between Hospital Records and Verbal Autopsies ... 65
6.5 Summary ... 67
CHAPTER7: DISCUSSION AND CONCLUSION... 68
7.1 Introduction ... 68
7.2 Gender and Age at Death... 68
7.3 Causes of Death... 71
7.3.1 Stillbirths... 71
7.3.2 Causes of Death in Children below 1 year Old ... 73
7.3.3 Causes of Death in Children Aged between 1 and 4 years Old ... 76
7.3.4 Causes of Death in Children Aged between 5 and 14 years of Age ... 79
7.3.5 Causes of Death in Adults (Older Than 15 years of Age) ... 81
7.4 Community Mortality Rates... 87
7.5 Agreement of Cause of Death between Hospital Records and Verbal Autopsies... 89
7.6 Limitations of the Study ... 92
7.7 Recommendations... 93
REFERENCES ... 97
ANNEXURE : Informed consent form Sepedi... 145
ANNEXURE: Informed consent form English ... 146
ANNEXURE : Data Abstraction Form for Health Facility ... 147
ANNEXURE : Verbal Autopsy Questionnaire ... 148
ANNEXURE : List of ICD 10 codes used... 150
ANNEXURE : Approval letter from Ethics Committee... 152
ANNEXURE: Approval Letter from Provincial Office ... 153
LIST OF FIGURES
Figure 1: Map of South Africa and Limpopo Province Showing the Location of Dikgale ... 42
Figure 2: Gender distribution of deaths in hospital and in the community ... 50
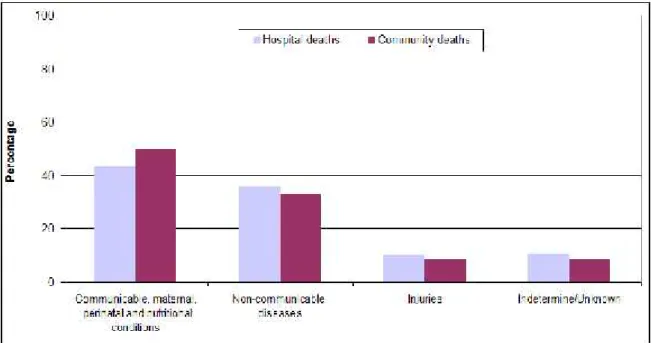
Figure 3: Causes of death by major category and site, 2011-2012... 52
Figure 4: Gender distribution in the community ... 59
Figure 5: Age distribution in the community... 60
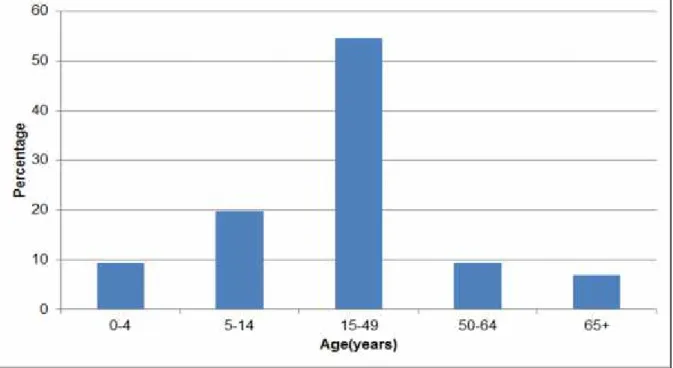
LIST OF TABLES Table 1: Age distribution at death, 2011-2012... 50
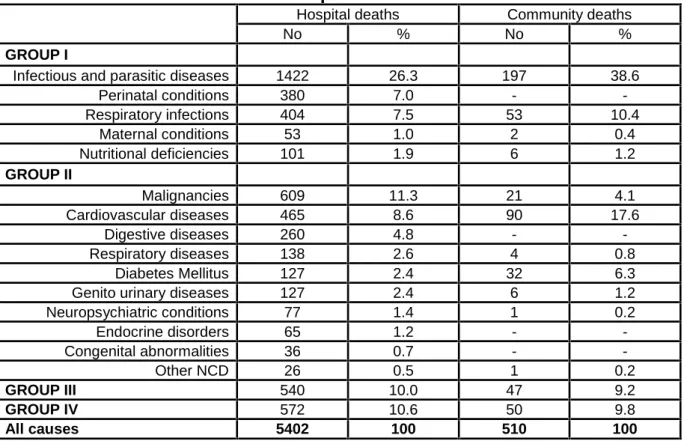
Table 2: Main causes of death in Group I and II ... 53
Table 3: Causes of death among children aged <1 and 1-4 years... 54
Table 4: Causes ofstillbirth in Pietersburg/Mankweng Hospital Complex, 2011-2012... 55
Table 5: Causes of Death AmongstAdults 15 years Old and Older ... 56
Table 6: Mortality Rates (per 1000 person-years) in Dikgale HDSS, 2012 ... 61
Table 7: Crude Mortality Rates (per 1,000 person-years) by Age and Gender ... 61
Table 8: Causes of Death on Hospital Records and by Verbal Autopsies... 65
Table 9: Agreement of Causes of death between Death Notificationsand Verbal Autopsy .. 66
Table 10: Discrepancies Observed between VA Diagnoses and Hospital Records ... 67
LIST OF ABBREVIATIONS AND ACRONYMS
AIDS Acquired Immune Deficiency Syndrome ART Antiretroviral Therapy
CCVA Computer Coded Verbal Autopsy DHA Department of Home Affairs DCH Department of Community Health
DHSD Department of Health and Social Development GBD Global Burden of Disease
HDSS Health and Demographic Surveillance Site HIV Human Immunodeficiency Virus
ICD-10 International Classification of Diseases
INDEPTH International Network for the continuous Demographic Evaluation of Populations and Their Health
MRC Medical Research Centre MDG Mellinium Development Goal NCD Non-Communicable Diseases
PMHC Pietersburg/Mankweng Hospital Complex PPV Positive Predictive Value
TB Tuberculosis
VA Verbal Autopsy
WHO World Health Organization
PAPERS PREPARED FROM THIS THESIS
The following papers resulted from this project and were used to form part of a pilot study to assess the feasibility and availability of information before the data collection for this study began:
Ntuli ST, Malangu N. An investigation of the stillbirths at a tertiary hospital in Limpopo province of South Africa. Glob J Health Sci. 2012 Sep 24;4(6):141-7.
doi: 10.5539/gjhs.v4n6p141.
Ntuli ST, Malangu N, Alberts M. Causes of deaths in children under-five years old at a tertiary hospital in Limpopo province of South Africa. Glob J Health Sci. 2013 Feb 15; 5(3):95-100. doi: 10.5539/gjhs.v5n3p95.
Malangu N, Ntuli ST, Alberts M. Causes of deaths in patients treated at a Tertiary Hospital in Limpopo Province of South Africa: A retrospective study from 2008 to 2010.Accepted for publication by South African Journal of Epidemiology and Infectious diseases
CHAPTER 1: INTRODUCTION
This introductory chapter provides a background to the study, the research question, research hypothesis and the rationale for the study. The purposeand the objectives of the study are also elaborated on in this chapter.
1.1 Background of the study
Consistent and reliable mortality statistics are essential for evaluating the effectiveness of health services and formulating local and global health policies (Lopez et al, 2006; Mathers et al., 2009; Lozano et al., 2012; Stats SA, 2013). Such data also provides a basis for investigating the occurrence of diseases and for identifying the magnitude, pattern and distribution of major disease problems (Mathers and Loncar, 2006; Stevens et al., 2008; Celine, 2013; Yang et al., 2013).
Civil registration systems remain the “gold standard” source of continuous mortality statistics worldwide (Lopez et al., 2006; Lozano et al., 2012; Phillips et al., 2013).
However, the chance of a death being registered and the cause of death documented in a civil registration system depends on the socioeconomic status of the community and nation in which that death occurs (Byass, 2006).
Previous studies found that mortality statistics provided to World Health Organization (WHO) by high-income countries are of a higher quality when compared to mortality statistics provided by low-and-middle income countries (Mahapatra et al., 2007;
sub-Saharan Africa, cause of death data are inadequate or not readily available (Mahapatra et al., 2007; Setel et al., 2007; Ye et al., 2012, Phillips et al., 2013) for policy-making, public health programs and research (Johns et al., 2013).
Mortality registration and causes of death reporting system has existed for many years in South Africa (Stats SA, 2005). When a death occurs in a health facility the attending doctor or professional nurse issues a death certificate (Pieterse et al., 2009) according to the international standard recommended by the International Classification of Diseases 10thRevision (WHO, 2004a; WHO, 2004b; WHO, 2004c).
When a death occurs at home, the cause of death is certified by an attending doctor, if present. If a doctor or other healthcare professional is not present then the death will be recorded by a traditional headman or funeral undertaker, in which case the medically-determined cause of death is usually not recorded (Pieterse et al., 2009).
Despite recent improvements in the death registration system in South Africa (Joubert et al., 2013; Stats SA, 2013), the quality of cause of death statistics remains deficient and causes of death recorded are often “ill-defined” or “undetermined”
and/or misclassified, especially HIV/AIDS related deaths (Burger et al., 2007;
Nojilana et al., 2009; Bradshaw et al., 2010; Groenewald et al., 2010; Birnbaum et al., 2011; Stats SA, 2013). Deaths coded to these categories are of little use for decision-making.
Given the lack of reliable vital statistics in South Africa (Pillay-van Wyk et al., 2011;
registration system. However, deaths in remote rural areas often occur at home and are not always recorded (Stats SA, 2013). Thus any survey of hospital records can often misrepresent mortality rates and causes of mortality.
The Verbal Autopsy (VA) method is the best available tool to complement the collection of vital statistics data in settings with weak civil registration systems (Baiden et al., 2007; Garenne and Fauveau, 2007; Kahn et al, 2007; Van Eijk et al., 2008; Herbst et al., 2011; Murray et al., 2011a; Olack et al., 2014).
VA involves interviewing a family member and/or caregiver of the deceased using a structured questionnaire to record signs, symptoms and the sequence of events seen during the illness that preceded death (Fantahum et al, 2006; Soleman et al, 2006). This is followed by a physician’s review of the VA or the use of automated computer programs for assigning cause of death from VA contents (Fottrel and Byass, 2010; Lozano et al., 2011a, Lozano et al., 2011b;Flaxman et al., 2011b;
James et al., 2011; Murray et al., 2011a; Byass et al., 2012; Desai et al., 2014; Jha, 2014).
Civil registration systems and verbal autopsies present their own challenges. In the case of verbal autopsies diverse practices in the implementation of VA field methodology such as variability of field procedures, questionnaire used, recall period by respondents and different methods in interpreting VA information to determine a probable cause of death present challenges (Garenne and Fauveau, 2006; Soleman et al., 2006; Thatte et al., 2009; Fottrell and Byass, 2010; Dharmaratne et al., 2011).
Civil registration systems, on the other hand, are difficult to establish, expensive to maintain and have problems with accuracy and coding of causes of death (Burger et al., 2007; Nojilana et al., 2009; Bradshaw et al., 2010; Groenewald et al., 2010;
Birnbaum et al., 2011; Pillay-van Wyk et al., 2011). Despite their limitations, the two methods are accepted tools that are useful in estimating cause-specific mortality fractions in a large population (Sartorius et al., 2010; Lozano et al., 2012; Narh-Bana et al., 2012; Stats SA, 2013; Olack et al., 2014).
Stillbirths remain the most common adverse outcome of pregnancy, yet are not included in the international health agenda (Bryce et al., 2013). Globally, there were 2.65 million stillbirths in 2008, more than two-thirds (98%) occur in low and middle income countries (Lawn et al., 2011). In South Africa (SA), the national stillbirth rate for the year (2007/2008) was 23.0 per 1000 births, and two districts (i.e.rural and urban) of the Limpopo had a slightly higher rate than the national average (Day et al., 2009).
The Millennium Development Goal 4 (MDG-4) recommended a global reduction of under-5 mortality rate by two-thirds between 1990 and 2015. In South Africa, the under-five mortality rate was 53 per 1000 live births in 2010, which is higher than the international target of 20 per 1000 live births (Statistics South Africa, 2013).
There are many factors that contribute to under-5 mortality. In South Africa, preterm birth and low birth weight, birth asphyxia and infections - primarily pneumonia and sepsis - were the main causes of under-5 mortality (Nannan et al., 2012). Ntuli and
birth asphyxia, and severe malnutrition were the top five common causes of under-5 mortality in a tertiary hospital of the Limpopo (Ntuli et al., 2013).
In Limpopo Province, a community-based study reported an increase in mortality rates from 6.8 to 9.9 per 1000 person-years between 1996/1999 and 2004/2007 (Kanjala et al., 2010).The rate was relatively high amongst adults in this rural community; the explanation is multifactorial and could include the growing burden of chronic and lifestyle-related diseases and HIV/AIDS in adults (Malangu et al., 2014).
The statistics on cause of death require careful evaluation if they are to be useful for epidemiological research and health intervention policy or program.Comparison of cause of death reported on death certificates with clinical records or verbal autopsies are usually assessed by using the concepts of sensitivity, specificity or kappa statistics (Rao et al., 2007; Wang et al., 2007; Burger et al., 2012; Misganaw et al., 2012a; Khalili et al., 2012).
A number of studies have reported sensitivity of above 50%and specificity of more than 80% for most of the communicable diseases (Setel et al., 2006; Khademi et al., 2010; Khalili et al., 2012; Misganaw et al., 2012). However, there are studies that found a sensitivity of less than 50% (Wang et al., 2007). For non-communicable diseases, sensitivity and specificity of the verbal autopsy diagnoses was 69% and 78%, respectively (Misganaw et al., 2012). The studies reviewed illustrate the potential of verbal autopsy to provide cost-effective information to guide policy on communicable and non communicable diseases.
The absence of a reliable vital statistics system in South Africa limits the usefulness of measuring the impact of health interventions, particularly at periphery of the healthcare system. An analysis of the burden of disease needs more accurate cause of death data in order to make provision for a relevant health system in rural areas.
In order to assist local health teams in planning relevant health systems in remote areas it is important to identify the correct causes of death in any given community.
1.2 Rationale and Problem Statement of the Study
There is a great deal of uncertainty regarding the causes of mortality in the Limpopo Province, a province with a population of more than 5 million people. Causes of mortality can be estimated by combining through information from vital statistics obtained from hospital records and verbal autopsy records of deaths in the community where patients were unattended by competent health professionals, however, this combination method has not been effectively studied in a rural setting.
High quality mortality data is critical for the assessment of the health status of a given population and for health policy formulation or modification aimed at bringing about cost efficient and effective health services.
Medical certification of death depends on the availability of a doctor at the time of death. In remote rural areas of South Africa most deaths occur at home (Kahn et al, 2007; Clark et al, 2007; Kanjala et al., 2010), with limited contact between the patient and the health service during the time of illness preceding death (McLarenet al., 2013).
Given this background, an analysis of statistics of registered causes of death in the rural areas of South Africa requires careful evaluation if they are to be useful for epidemiological research and health service planning. Therefore, a community- based study using VA reporting and hospital data was undertaken to compare cause-specific mortality patterns according to the age of the deceased and to compare the cause of death as documented on hospital records with VA report.
1.3 Research Question
Are cause-specific mortality patterns in a public hospital different to those reported in anadjacentcommunity?
1.4 Research Hypothesis
The research hypothesis for this study is that the cause-specific mortality patterns in the hospital are different to adjacent communities.
1.5 Aim and Objectives
1.5.1 Aim
The aim is to determine the cause-specific mortality patterns in a public hospital and nearby community.
Objectives
To examine the demographic profile of people dying in a hospital and in a community adjacent to that hospital;
To determine mortality rates, age and gender-specific mortality rates in a community ;
To determine the leading causes of death in a hospital and community;
To compare cause of death assigned on the hospital death registration form to the cause obtained froma verbal autopsy report.
1.6 Summary
The introductory chapter explained the background of the study, research question, research hypothesis and the rationale for the study, as well as the aims and objectives of the study. A review of the literature follows in Chapter 2 in which what has already been done in this field of study will be examined.
CHAPTER 2: LITERATURE REVIEW
2.1 Introduction
This chapter presents a review of the literature, focusing on previous studies relevant to the aims and objectives of this study.
Mortality statistics are widely used epidemiological data for determining the burden of disease in a population and for planning of health services. Globally, civil registration systems are the principal source of mortality data and are dependent on the cause of death reports based on the opinion of a medical doctor (Myer and Eden, 2007; Wetmore, 2007; Pieterse et al., 2009).
Several papers published by Lancet drew attention to the importance of civil registration systems for monitoring global health and its implementation in many countries (Mahapatra et al., 2007; AbouZahr et al., 2007). However, between one- third and two-thirds of the world’s annual births and deaths are not registered, especially in low-and-middle income countries (Setel et al., 2007).
The lack of political will and coordination, limited analytical skills and insufficient technical resources in low-and-middle income countries impact negatively on the collection of civil registration data and vital statistics (Carter et al., 2012).
With population ageing and other possible factors, there is steady increase in the proportion of home deaths worldwide, which has negative implicationson the quality of documentation of causes of mortality.
An increasing body of evidence showed a decline in home deaths in the Brussels (Houttekier et al., 2011), England and Wales (Gomes and Higginson, 2008) in 1998- 2007 and 1974-2003, respectively. In contrast, data from England shows an increase in home deaths between 2004 and 2010 (Gomes et al., 2012).
A comparison study of the location of deaths in Japan, England, France and USA found a greater proportion of home deaths in these countries (Broad et al., 2013). In Canada, 15% of deaths occur at home in rural settings comparable to 16% in an urban setting (Goodridge et al., 2010). In Singapore, most deaths amongst elderly people occur mainly in hospitals, while 31% die at home (Beng et al., 2009). In the rural areas of China (Yang et al., 2005), most of adult deaths occur at home, while in Brazil, home deaths accounted for 23% of all deaths (Franca et al., 2008).
In sub-Saharan Africa, home deaths is not a new phenomenon, Lazenby and co- authors showed that home deaths in Botswana accounted for 36% of all deaths (Lazenby et al, 2010). According to Stats SA, 30% of deaths in South Africa occurred at home (StatsSA, 2013). The HDSS data in Kenya (van Eijk et al., 2008; Philips- Howard et al., 2012), indicated that more than two-thirds of deaths occurred at home, while in Mpumalanga Province, South Africa, 23% of maternal deaths occurred at home (Weiner et al., 2007).
The reviewed studies show that home deaths are common globally which has an implact on the documentation of causes of death. There are various reasons that contribute to home deaths in high income countries such as patient preferences and
in low-and-middle income countries home deaths occurred as a result of distance, finance and local culture (Weiner et al., 2007; McLarenet al., 2013).
In high income countries home deaths do not have negative implication on the quality of mortality data, since when a person is in the process of dying or about to die, a family doctor will be called upon to participate in an end-of-life care of the patient (Myer and Eden, 2007; Wetmore, 2007). However, in low-and-middle income countries a large number of home deaths are recorded by an attending doctor if present, by the traditional headmen or funeral undertakers (Franca et al., 2008;
Pieterse et al., 2009), which impact negatively on the quality of data.
2.2 Verbal Autopsy
In a situation where medical certification of death is limited and/or death occurs without medical attention, the World Health Organization (WHO) has urged the use of the verbal autopsy method to ascertain cause of death (Baiden et al., 2007).VA is an indirect method of determining cause of death based on an interview with a family member and/or caretakers of a deceased individual. The interview is carried out by a trained field worker using a structured questionnaire that records the sign, symptoms and sequence of events prior to death (Fantahum et al, 2006; Soleman et al, 2006).
The collected information is used to establish the most probable cause of death.
There are two approaches for analysing the verbal autopsy questionnaire contents in order to reach a probable cause of death. The first method is the physician review, which uses two trained physicians who independently apply their professional knowledge and experienceto the verbal autopsy questionnaire to assign a probable
underlying cause of death in each case. The adjudication is done by reaching consensus between the two physicians or through an assessment by a third doctor.
The physician verbal autopsy review is widely used; however, it has been shown to have the following limitations, inter and intra observer differences in coding and it is relatively costly and time consuming when dealing with a large number of questionnaires to be assessed (Fottrel and Byass, 2010).
To overcome these problems there has been an interest in using automated computer programs for interpreting VA data, which has been reported to be cheaper, faster and more consistent over time (Fottrel and Byass, 2010). The main purpose of these automated computer programs is the large-scale profiling of causes of death in a population for the purposes of evaluation of health programs and planning health interventions (Garenne, 2014).
There are various automated computer programs which can be either algorithmic or probabilistic, namely: (1) InterVA which is developed by UmeåUniversity (Byass et al., 2012), (2) Tariff (James et al., 2011) and (3) Random Forest methods developed by Population Health Metrics Research Consortium (Flaxman et al., 2011a) and (4) King-Lu method developed by Gary King and Ying Lu (King and Lu, 2008).
These methods have been validated against physician reviews and against each other (Lozano et al., 2011a, Flaxman et al., 2011a; James et al., 2011; Murray et al., 2011a; Desai et al., 2014; Jha, 2014). Leitao and co-authors concluded that none of the four automated computer program is superior to the other (Leitao et al., 2014).
The InterVA program has been available in the public domain for many years (Chandramohan et al., 1994; Lozano et al., 2011a). The program applies a Bayesian probability method which requires the extraction of a defined set of indicators (signs, symptoms, history, and circumstances) as the input to the model, which can be derived from both the open narrative and closed questions in the VA interview.
Running the model on these indicators will then generate a database with up to three likely causes of death for each case, together with respective probabilities.
Byass and co-authors conducted a study in a rural community in Vietnam with the aim to validate the InterVA model. The findings of this study showed that the probability approach (InterVA) has great potential for VA interpretation (Byass et al, 2003). Similar studies were conducted in different parts of the world to show the validity of the model (Byass et al, 2006; Fantahum et al, 2006).
The UmeåUniversity designed a new public-domain probabilistic model (InterVA-3) for interpreting VA data which can be used for determining cause of death both in research settings and for routine registration of the cause of death (Byass et al., 2012). This modified InterVA-3 model has been shown to provide plausible results for stillbirths and newborn deaths when broadly comparable to a physician’s review but with the added advantage of internal consistency (Vergnano et al., 2011).
Internal consistency reliability is a measure of how well the items on the test measure the same construct or idea.
2.3 Gender and Age at Death
Knowledge about the distribution of death by age and gender can effectively inform health policy makers about the risk factors associated with diseases that contribute to deaths in a population. Since mortality risks vary by age and gender, it is important to understand the leading causes of death by age and gender to plan intervention strategies.
Globally, life expectancy for both males and females increased from 65 years in 1990 to 71 years in 2013. The improvement in life expectancy has shown a reduction in cardiovascular disease and cancer deaths in high income countries and reduction in child deaths from diarrhea, lower respiratory tract infections, and neonatal causes in low-and-middle income regions (Naghavi et al., 2015).
Important gaps exist in this global burden of disease study (2013) such as the quality of the underlying medical certification of causes of death and verbal autopsy, country-specific cause of death data show national variation in coding practices, uncertainty from garbade code is not incorporated for ill-defined causes of death and the clinical pathways to deaths such as heart failure, sepsis, fungal infection, and acute kidney injury were excluded (Naghavi et al., 2015).
In high income countries such as USA (Heron. 2012) and England and Wales (McLaren, 2011) a greater proportion of death occurred amongst females. In contrast, national reports from Stats SA showed that in South Africa (SA) there were slight more male than female deaths (Stats SA, 2013). In SA, male deaths have
In industrialized countries, the socio-economic status is strongly associated with high mortality (Stringhini et al., 2010), and as more women enter and remain in the labor force, a large number are now involved in unhealthly behaviours such as smoking, alcohol use, unhealthy diet and physical inactivity which have negative impact on their health (Stringhini et al., 2011).
Similarly hospital-based studies in low-and-middle countries have shown a higher proportion of male deaths when compared to female deaths (Tariq et al., 2009;
Adeolu et al., 2010; lliyasu et al., 2010; Preacely et al., 2012; Aziz et al., 2013;
Ayoade et al., 2013; Abejew et al., 2014).
Similar findings of greater proportion of male deaths were reported in community- based studies in Kenya (Negin et al., 2010), India (Palanivel et al., 2013) and South Africa (Cook et al., 2008; Kahn et al., 2007; Mashego et al., 2007; Sartorius et al., 2010; Kanjala et al., 2010). In contrast, a study which explored deaths among young adults aged between 15 and 24 years of age in a rural community in Kenya found that females accounted for 67.3% of deaths (Phillips-Howard et al. 2012).
Unwillingness of men to use health services and report health problems together with aggressive behaviour (Roger et al., 2010) may account for some of the burden of male deaths (Signh-Manoux et al., 2008) in low-and-middle income countries.
Regarding age, the World Health Organization (WHO) found that globally most deaths (43%) occurred at age 70 years and older (Wang et al., 2012). In the USA
70% or more deaths were adults in the age group 65 years and above (Heron, 2012). In South Africa, most deaths were adults aged between 15 and 49 years old (Stats SA, 2013, Stats SA, 2014).
A hospital-based study in Nigeria indicated that two-thirds of deaths were young adults aged between 15 and 49 years old (Preacely et al., 2012). A study by Einterz and Bates (2011) in a district hospital in Cameroon indicated that the majority of all deaths (63.9%) involved children under-15 years old (Einterz and Bates, 2011).
A community-based study in India reported that more than half (59%) of deaths occurred in people aged 60 years and above (Palanivel et al., 2013). In rural communities in Kenya, more than two-thirdsof deaths occurred among adult’s under- 65 years old (van Eijk et al., 2008) and those above 65 years of age (Negin et al., 2010).
In South Africa, HDSS data shows high mortality rates in children under-5 years old (Kahn et al., 2007), in the age group 15 to 49 years of age (Kahn et al., 2007;
Mashego et al., 2007; Sartorius et al., 2010; Kanjala et al., 2010; Herbst et al., 2011) and in those aged 65 and above (Cook et al., 2008; Kanjala et al., 2010; Herbst et al., 2011).
The high death rates among adolescents and young adults could be due to several factors, including behavioural risk factors such as unprotected sexual practice, which increases the chances of acquiring HIV infection and alcohol use which contributes
The involvement of parents and other family members, mass media programmes, sex education and HIV education have shown to influence HIV-related outcomes among young people (Monasch and Mahy, 2006; Bertrand et al., 2006; Kirby et al., 2006; Keeney and Palley, 2013).
2.4 Causes of Mortality
In this section the underlying causes of mortality will be discussed by age group. The first part discusses the causes of mortality in children under-5 years of age followed by a discussion on causes of mortality among adults aged 15 years old and above.
2.4.1 Causes of Stillbirth
Worldwide, stillbirths are considered a major public health problem with more than twomillion stillbirths occurring annually (Lawn et al., 2011). High income countries are also affected by the burden of stillborns.
The Lancet‘s Stillbirths Series showed a significant variation in stillbirth rates between high income countries (Cousens et al., 2011).In these countries, Finland and Singapore have the lowest stillbirth rate, while USA and UK were shown to have the highest rates of stillbirth (Cousens et al., 2011).
The differences in the rates could be ascribed to socio-economic differences between these countries (Smith et al., 2010; Seaton et al., 2012), smoking behaviour during pregnancy (Gray et al., 2009; Gardosi et al., 2013; Goldenberg et al., 2013;
Gordon et al., 2013) and overweight and/or obesity of the mothers (Flenady et al., 2011; Gardosi et al., 2013).
The rate of stillbirths are higher in low and middle income countries when compared to the rate found in high income countries (McClure et al., 2006; McClure et al., 2007a; McClure et al., 2007b; McClure et al., 2011; Cousens et al., 2011). A comparative study of six low-and-middle income countries found a significant different in the stillbirth rates (McClure et al., 2011).
The high stillbirth rates in low and middle income countries could be attributed to inadequate access to appropriate maternal health care during the antenatal period and at the time of delivery (Shrestha and Yadav, 2010) and low socioeconomic status (Smith et al., 2010; Seaton et al., 2012).
Several studies have shown that hospital-based stillbirth rates are higher than the rates reported from community-based studies. Hospital-based studies in low-and- middle income countries reported stillbirth rates of 156/1000 births in Gambia (Jammeh et al., 2010); 59.8/1000 births in India (Bhattacharya, et al., 2010); 57/1000 births in Zimbabwe (Feresu, 2010) and 35.9/1000 births in Tanzania (Mmbaga et al., 2012). In SA, the hospital stillbirth rates range from 10.1 to 52.3 per 1000 births which continue to pose serious challenges (Pattinson, 2009).
Community-based studies reported stillbirth rates of 19/1000 births in Uganda (Nankabirwaet al., 2011); 33/1000births (Engmann et al., 2009), 34.2/1000 births in Ghana (Edmond et al., 2008) and 35.4/1000 births in Ghana (Lee et al., 2011). A community-based study in Zambia found that among 148 child deaths 34% were stillbirths (Ensor et al., 2014).
The reviewed studies have shown that the rate of stillbirths is lower in the community as compared to the hospital. Stillbirths in the rural communities are often hidden and disposed without recognition or rituals (i.e. funeral rites) because the evil spirit is to blame (Haws et al., 2010; Froen et al, 2011; Kiguli et al., 2015).
Causes of stillbirths are associated with both medical and non-medical risk factors.
These risk factors are manifold, often unclear and vary by geographical region (Lawn et al., 2010). Obesity and excessive weight gain during pregnancy lead to adverse maternal and foetal outcomes (Athukorala et al, 2010; Crane et al., 2013). Studies in several low-and-middle income countries identified overweight and obesity among the major risk factors for stillbirths (Salihu et al., 2007; Flenady et al., 2011; Gardosi et al., 2013; Scott-Pillar et al., 2013).
Interventions to reduce stillbirths include antenatal dietary and lifestyle interventions in obese pregnant women to reduce maternal pregnancy weight gain and improve pregnancy outcome (Oteng-Ntim et al., 2012; Thangaratinamet al., 2012;
McPherson, 2013).
Smoking behaviour during pregnancy has also been identified as a risk factor for stillbirths (Flenady et al., 2011; Gardosi et al., 2013; Goldenberg et al., 2013; Gordon et al., 2013). Recently Varner et al reported that exposure to second-hand smoke during pregnancy was associated with an increased risk of stillbirths (Varner et al., 2014). There is evidence that psychosocial interventions during pregnancy reduce smoking behaviour and thus stillbirths (Chamberlain et al., 2013).
Hypertensive disorders are the most common medical complications encountered during pregnancy and are associated with poor maternal and foetus outcomes (Roberts et al., 2008; Duley et al., 2009; Steegers et al., 2010; Bateman et al., 2012).
Globally, the number of women entering pregnancy with established hypertension disorders is set to increase (Seely and Ecker, 2011).
A retrospective review of hospital maternity records in Gambia reported that hypertensive disorders are highly associated with stillbirth (Jammeh et al., 2010).
Another Gambian study in three (3) obstetric referral hospitals found that hypertension in pregnancy was most common cause of stillbirth (Cham et al., 2009).
A community-based study undertaken in sub-Saharan Africa, Southern Asia and South America using verbal autopsy reporting indicated that hypertensive disorders were common causes of stillbirth (Engmann et al., 2012). In Nigerian mission hospital, Onyiriuka (2009) reported that hypertensive disorders are among the three leading risk factors resulting in stillbirths. Numerous case-control studies have identified hypertension in pregnancy as a risk factor for adverse events for mother and the foetus (Berg et al., 2009; Hossain et al., 2009).
Several risk factors that contribute to hypertension in pregnancy include obesity, older age and diabetes mellitus (Al-Jameil et al., 2013). Use of anticonvulsants(Acosta et al., 2012; King, 2013; Kassebaum et al., 2014; Say et al., 2014), aspirin, calcium supplementation in areas with low intake (Henderson et al., 2014) can reduce the incidence of hypertension disorders in pegnancy.Some studies
developing hospital protocols for treatment of hypertension and eclampsia (Wagner et al., 2007; Lowe et al., 2009).
Obstructed labour is also among the major medical conditions that cause stillbirths in many health facilities (Onyiriuka, 2009; Mmbaga et al., 2012) and communities (Engmann et al., 2012; Alkali et al., 2014) in low-and-middle income countries.
Early and regular antenatal care visits improve the chances of identifying complications during pregnancy (Young et al., 2007; Di Mario et al., 2007; McClure et al., 201; Ensor et al., 2014). Several procedures, such as caesarean delivery, are done to relieve the obstruction in obstructed labour (Nwogu-Ikojo et al., 2008; Alkire et al., 2012).
In the Harare Maternity Hospital, lack of prenatal care contributed to a large number of stillbirths (Feresu, 2010). In four rural health districts in DRC, a correlation was found between lack of prenatal care and formal education, on the one hand (Engmann et al., 2009). In a Tanzanian hospital’s non-adherence to an antenatal care program was found to correlate with high stillbirth rates (Schmiegelow et al., 2012).
2.4.2 Causes of Death in Children Under-1 Year of Age
The Millennium Development Goal 4 (MDG4) target is to reduce under-5 mortality rate by two-thirds between 1990 and 2015. There has been an impressive progress in reducing under-5 mortality globally, although few countries will reach target by 2015 (Bryce et al., 2013).
In 2010, there were 7.6 million recorded deaths of children under-5 years of age worldwide, of which more than two-thirds occurred in the neonatal period. Low-and- middle-income countries have the highest neonatal mortality rates, with two regions, namely sub-Saharan Africa and Southern Asia, together accounting for nearly 80%
of the worldwide neonatal deaths (Liu et al., 2012).
Globally, the leading causes of deaths in the neonatal period were preterm births, intrapartum-related conditions (previously called birth asphyxia) and infections - mainly sepsis, meningitis and pneumonia (Liu et al., 2012; Oza et al., 2013).
Preterm deaths are the most common cause of deaths in all countries, congenital malformations cause more neonatal deaths in high income countries, while infection and intrapartumassociated disorders cause more neonatal deaths in low-and middle income countries (Liu et al., 2012; Oza et al., 2013). In SA, preterm birth and low birth weight, birth asphyxia and neonatal infections - primarily pneumonia and sepsis - were the main causes of neonatal deaths (Nannan et al., 2012).
Preterm birth, which is defined as being born less than 37 weeks after conception, and low birth weight, which is defined as a weight of less than 2500g at time of delivery (Gray et al., 2008) were the main causes of death in hospital-based studies in low-and-middle income countries (Grandin et al., 2006; Ngocet al., 2006; Huerga et al., 2009; Forae et al., 2014; Mmbaga et al., 2012). Similar findings were reported in community-based studies which show preterm birth and low birth weight as the leading causes of neonatal deaths in low-and-middle income countries (Manandhar
There are many factors that contribute to infant mortality such as the mother’s level of education and environmental conditions. Improving sanitation, access to clean drinking water and hand washing could help to reduce the high rate of infant mortality.
Smoking cessation interventions and use of progesterone have been shown to reduce mortality related to low birth weight and preterm birth, respectively (Barros et al., 2010; Hassan et al., 2011; Slager et al., 2012).
In addition, poor maternal nutritional status during pregnancy has been shown to interfere with foetal growth and development resulting in newborns with low birth weight (Quigley et al., 2008; Belkacemi et al., 2010; Wu et al., 2012). The provision of micronutrients such as iron, folate and zinc to pregnant women who consume minimal vitamins and minerals in their daily diet has a significantly positive impact on low birth weight of newborns (Barros et al., 2010). The introduction of basic obstetric care, an improved referral system and neonatal resuscitation have shown to reduce asphyxiated deaths (Cowles, 2007; Lawn et al., 2007).
Neonatal deaths due to infections are also common in low-and-middleincome countries, whereas in high income countries infections rarely cause neonatal mortality (Black et al., 2010; You et al., 2010). In neonates infections normally occur either during pregnancy or at the time of delivery, causing sepsis, pneumonia or meningitis (Heath and Jardine, 2014).
Neonatal deaths could be reduced through appropriate antenatal care and timely referral of the mother to tertiary care facilities (Mmbaga et al., 2012; Ali et al., 2013).
In addition, in areas where malaria is endemicthe use of anti-malarial drugs amongst primiparae and the use of insecticide-treated nets both result in a reduction in perinatal mortality (Barros et al., 2010).
2.4.3 Causes of Death in Children between the Ages of 1 and4 Years of Age Whilst there has been some reduction in under-5 mortality rates globally, progress to reduce mortality in some regions of the world has been insufficient particularly in sub-Saharan Africa (Bryce et al., 2013).
Among children aged between 1 and 4 years old, infections - primarily pneumonia, diarrhoea and malaria - are the predominant causes of death which result in a substantial burden on a health-care system(Black et al., 2010; Boschi-Pintoet al., 2008; Johnson et al., 2010; Kassebaum et al., 2014). Infectious diseases are particularly common in sub-Saharan Africa and Southern Asia.
In low-and-middle income countries, hospital-based studies reported that infectious diseases - mainly pneumonia and diarrhoea - were the main causes of death in children aged between 1 and 4 years old (Grandin et al., 2006; lloh et al., 2011;
Stephen et al., 2011; Misganaw et al., 2012b; Forae et al., 2014).Several authors noted that in rural communities in low-and-middle income countries pneumonia and diarrhoea were the predominant causes of death amongst these age group (Garrib et al., 2006; Sacarlal et al., 2009; Awqati et al., 2009; Byass et al., 2010; Johnson et
al., 2010; Huo et al., 2010; Liu et al., 2011; Checchi et al., 2011; Feng et al., 2012;
Parcesepe et al., 2013).
Pneumonia- and diarrhoeal-related deaths are closely associated with factors such as poverty, under-nutrition and poor hygiene. It is wellknown that exclusive breastfeeding up to 6 months of age, rotavirus vaccination, Haemophilus influenzae (Hib) vaccination, oral rehydration solutions, zinc therapy and antibiotics for pneumonia reduce pneumonia and diarrhoealrelated mortality in children under-5 years old (Sayem et al., 2012; Bhutta et al., 2013; Chopra et al., 2013).
Malaria also continues to contribute many deaths amongunder-5s living in rural areas across sub-Saharan Africa and South Asia (Black et al., 2010; Liu et al., 2012;
Kassebaum et al., 2014).
The major risk factors that contribute to high malaria mortality include low socio- economic status, poor access to healthcare services and low quality of health services (Belay et al., 2008; Dawit et al., 2012; Chirebvu et al., 2014).
In low-and-middle income countries, hospital-based data identify malaria as the main cause of death in children aged between 1 and 4 years old (Misganaw et al., 2012b;Einterz and Bates, 2011; Forae et al., 2014). A systematic review of community-based studies indicated that in low-and-middle income countries malaria caused most deaths among childrenaged between 1 and 4 years old (Johnson et al., 2010).
The use of insecticide-treated nets and anti-malarial spraying has contributed to a decrease in the incidence of malaria (Belay et al., 2008; Dawit et al., 2012; Chirebvu et al., 2014).
2.4.4 Causes of Death in Children between 5 and 14 Year of Age
The leading causes of death among children under-5 years of age in low and middle- income countries are well researched (Black et al., 2010; Liu et al., 2012;
Kassebaum et al., 2014). However, little information is available on the causes of morbidity and mortality among children in the 5 to 14 year age group. The main reason is that the mortality rate is low and causes of death in this age group remained unchanged (Desai et al., 2014; Streatfield et al., 2014).
Injuries are a major global public health issues that contributesto morbidity and mortality among children,especially those in the 5 to 14 year age group (Peden et al., 2008; Harvey et al., 2009). A study in Perureported injuriesas the leading cause of mortality in children in the 5 to 14 year age group (Huicho et al., 2009). Similarly in Mozambique, the most frequent cause of mortality among children in the 5 to 14 year age group was injuries (Sacarlal et al., 2009).
In Agincourt, Byass and co-authors showed that among children in the 5 to 14 year age group, injuries were the common cause of death (Byass et al., 2010). Traffic accidents are the most important cause of child injury-related deaths (Huicho et al., 2009; Sacarlal et al., 2009; Byass et al., 2010; Imamura et al., 2012).
Road traffic injury deaths may be due tooverburdened informal urban settlements,a high degree of traffic law violation, poor traffic control and lack of adult supervision of children (Rizvi et al., 2006; Harvey et al., 2009; Mamady et al., 2012).
Infectious diseases are the next most common cause of death in this age group, especially in low-and-middle income countries (Huicho et al., 2009; Sacarlal et al., 2009; Byass et al., 2010; Morris et al., 2011). In rural India (Morris et al., 2011) and Peru (Huicho et al., 2009), infectious diseases such as diarrhea and pneumonia were found to be the leading causesof death in children aged between 5 and 14 years old. In Mozambique, infectious diseases, mainly malaria and anaemia, were the leading causes of death (Sacarlal et al., 2009).
Data collected by Byass and colleaques showed that among children in the 5 to 14 year age group, meningitis and HIV/AIDS were the leading infectious causes of death in the Mpumalanga Province of South Africa (Byass et al., 2010).
Socio-economic inequalities are a major public health problem in globally. Childhood mortality is higher in low-and middle income countries compared to high income countries. However, even in high income countries child mortality is high among lower socio-economic groups compared to higher income groups (Signh et al., 2007;
Houweling and Kunst, 2010;Signh et al., 2013; Signh and Siahpush, 2014).
Improvements in living conditions, better nutrition, and access to clean drinking waterhave been cited as factors contributing for the decline in child mortality particularly from infectious diseases (Singh and Kogan, 2007).Moreover,
interventions, such as use of anti-malarial spraying, rotavirus vaccination, Haemophilus influenzae (Hib) vaccination, zinc therapy and antibiotics, have shown to reduce mortality due to malaria, pneumonia and diarrhoea (Sayem et al., 2012;
Bhutta et al., 2013; Chopra et al., 2013).
2.4.5 Causes of Death in Adults (older than15 Years of Age)
The cause of death amongst adults is a neglected topic in the global health discussion (Accorsi et al., 2010; Lozano et al., 2011; Dye, 2014). In 2004, 46.9 million of the 58.8 million deaths worldwide occurred in people aged 15 years and older (WHO, 2008). Despite high adult mortality, for many years public health efforts have focused on reducing maternal and child mortality, as well as halting and reversing the spread of HIV and tuberculosis (United Nations, 2011).
Causes of death vary substantially by age. Amongst adults aged between 15 and 49 years old, infectious diseases such as HIV/AIDS and tuberculosis are the leading causes of death, particularly in sub-Saharan Africa and Asia (Lozano et al., 2012).
Similar proportion of HIV/AIDS and tuberculosis deaths in this age group occurred in the hospitals (Adeolu et al., 2010; Ohene et al., 2011; Etyang et al., 2013) and rural community-based studies (van Eijk et al., 2008; Byass et al., 2010; Herbst et al., 2011; Checchi et al., 2011; Dlodlo et al, 2011; Narh-Bana et al., 2012; Chihana et al., 2012; Kumar et al., 2012; Palanivel et al., 2013).
Behavioural risk factors, such as unprotected sexual practice is the most important
(Senn et al., 2006; Muula, 2008). However, antiretroviral (ARV) treatment has played a major role in reducing the death rate in people with HIV (Walensky et al., 2009;
Ray et al., 2010; Saraceni et al., 2014; Yang et al., 2014).
A number of studies have shown that tuberculosis is closely linked to HIV/AIDS, overcrowding, smoking, diabetes and malnutrition (Chaisson and Martinson, 2008;
Lawn and Zumla, 2011; Ferrara et al., 2012; Murthy et al., 2013; Narasimhan et al., 2013) are the risk factors. Therefore, these factors play a significant role at both the individual and population level. Aglobal threat to tuberculosis controlhas been the emergence and spread of multi-drug-resistant tuberculosis (MDR-TB) (Banerjee et al., 2008; Ramachandran et al., 2009; Grobusch, 2010).
The incorrect use of anti-TB drugs, either due to prescription errorsor to low patient compliance,has led to the widespread emergence of MDR-TB.Preventive strategies include prompt diagnosis and adequate TB treatment using the directly observed therapy, short-course (DOTS) strategy and drug-resistance programmes, preventive treatment of TB/HIV, and optimal use of antiretroviral therapy (Prasad, 2010; Yew, 2011; Chang and Yew, 2012).
Non-natural causes of death, such as road traffic accidents, are the second largest global cause of death in the 15 to 49 year age group (Lozano et al., 2012; WHO, 2013). In the USA Heron (2013) found that injuries, particularly road traffic accidents, are the leading cause of deaths in adult aged between 25 and 44 years old. In SA road traffic accidents and violent assault are among the leading causes of death in young adults (Stats SA, 2014).
Similar findings were found in hospital (Adeolu et al., 2010; Chukuezi and Nwosu, 2010; Ohene et al., 2011; Etyang et al., 2013) and community-based studies (Byass et al., 2010; Herbst et al., 2011; Narh-Bana et al., 2012) which reported road traffic accidents as the leading cause of death amongst young adults.
These studies found that there were twice as many deaths amongst young males due to injury than there were amongst young females, demonstrating the susceptibility of young males to external causes of death. Alcohol abuse and aggressive behaviour contributes greatly to external causes of death (Senn et al., 2006; Muula, 2008).
The Millennium Development Goal 5 (MDG-5) recommended a global reduction of the maternal mortality rate by three quarters between 1990 and 2015 (Bryce et al., 2013). Pregnancy-related deaths among females aged between 15 and 49 years old, continue to be a public health concern worldwide, particularly in sub-Saharan Africa and Asia (Koblinsky et al., 2012; Bhutta et al., 2013; Kassebaum et al., 2014).
Approximately 99% of all maternal deaths occur in low-and-middle income countries, with a maternal mortality ratio (MMR) of 233 per 100 000 births versus a MMR of 12 per 100 000 in high income countries in 2013 (Kassebaum et al., 2014).
As stated by WHO (2003 - 2009), over two-thirds of global maternal deaths are due to direct obstetric causes, mainly obstetric haemorrhage, hypertensive disorders, abortions and infections (Say et al., 2014). In contrast, indirect causes, mainly non-
pregnancy related infections are responsible for maternal deaths in South Africa (NCCEMD, 2012).
According to hospital-and community-based studies in low-and-middle income countries, an increase in maternal deaths due to direct causes include maternal haemorrhaging and hypertension, while anaemia, malaria and HIV/AIDS were the main indirect causes of maternal deaths (Igberase et al., 2007; Kongnyuy et al., 2009; Gupta et al., 2010; Lee et al., 2012; Dinyain et al., 2013; Der et al., 2013;
Bukar et al., 2013).
In many low-and-middle income countries, lack of adequate healthcare, poor family planning,limited access to skilled birth attendants and the fact that patientsoften travel long distances to the nearest clinic to receive proper care contribute to maternal deaths(Ujah et al., 2005; Alvarez et al., 2009; Kassebaum et al., 2014; Say et al., 2014).
Basic emergency obstetric interventions, such as the provision of antibiotics, oxytocic’s, anticonvulsants and the manual removal of the placenta and the prevention of anaemia, malnutrition and malaria during pregnancy, as well as the provision of calcium and micronutrient supplementation and the reduction in unsafe abortions have shown to improve pregnancy outcome (Nour, 2008; Bhutta et al., 2008; Acosta et al., 2012; King, 2013; Kassebaum et al., 2014; Say et al., 2014).
In adults aged 50 years and older, non-communicable diseases, particularly cardiovascular diseases (CVDs) and malignant neoplasms,were the predominant
causes of death worldwide (Lozano et al., 2012, WHO, 2013). CVDs are known to be a public health problem worldwide and to have a major impact, not only in high income countries, but also in low-and-middle income countries countries (Lopez et al., 2006; WHO, 2008; Mayosi et al., 2009).
With accelerating global trends in industrialisation, urbanisation and increase socio- economic status the prevalence of CVDs is set to increase if left unchecked.
In a high income country like the USA, Heron (2013) found that CVDs are the leading cause of death in adults aged 45 years and older. In low-and-middle income countriesCVDs were also found to cause many deaths in adults aged 50 years and above (Mayosi et al., 2009; Porapakkham et al., 2010; Stats SA, 2014).
Many hospital-based studies reported CVDs as the leading cause of death among adult aged 45 years and older (Tariq et al., 2009; Papazafiropoulou et al., 2010;
lliyasu et al., 2010; Beharry et al., 2011; Preacely et al., 2012; Olarinde and Olatunji, 2014). Similarly, community-based studies found CVDs to be the leading cause of death among adults aged 50 years and above (Kynast-Wolf et al., 2010; Kumar et al., 2012).
Most of these deaths can be prevented by addressing risk factors such as tobacco use, unhealthy diets, overweight and obesity, physical inactivity, high blood pressure and the harmful use of alcohol (Pennant et al., 2010; Korczak et al., 2011;WHO, 2011b; van de Vijver et al., 2012; Nguyen et al., 2012).
Neoplasms account for the second most common non-communicable causes of death amongst adults aged 50 years and older and accounted for around eight million deaths in 2012 worldwide (de Martel et al., 2012; WHO, 2013). This age group has a much higher proportion of cancer deaths when compared to younger age groups, with two-thirds of all cancer deaths occurring in adults aged 50 years and above (WHO, 2013).
The causes of cancer deaths vary dramatically by gender, with cancer of the trachea, bronchus, lung, liver, and stomach accounting for 46% of cancer deaths in men, while in women, 38% of cancer deaths were caused by breast, trachea, bronchus, lung and colorectal cancers (WHO, 2013). Neoplasmsare already the leading cause of deaths in many high-income countries and are set to become a major cause of mortality and disability in developing countries (Bray et al., 2012).
In South Africa, neoplasm deaths are mainly caused by cancer of digestive organs in adults aged 50 years and above (Stats SA, 2014). In the USA neoplasmsaccounted for 13% of deaths in adults aged between 25 and 44 years old, 32% of deaths in adults aged between 45 and 64 years old and 34% of deaths in adults aged 65 years and older (Heron, 2013).
Psychosocial experiences such as stress and health behaviour including tobacco use, sun exposure, poor diets and a sedentary lifestyle, increase the risk of some cancers (Klein et al., 2014; Lugman et al., 2014).