The empirical findings of this research study will further benefit the insurance industry as it provides an analysis of the factors that influence the risk perception of the insurance policy holders. It was recommended for future researchers to conduct a test before and after COVID-19 to analyze the change in the risk perception of the policyholders.
INTRODUCTION AND BACKGROUND
- INTRODUCTION
- THE PROBLEM STATEMENT
- OBJECTIVES OF THE STUDY
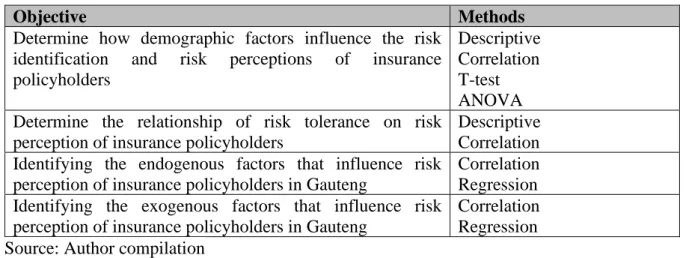
- Primary objective
- Theoretical objectives
- Empirical objectives
- RESEARCH DESIGN AND METHODOLOGY
- Literature review
- Empirical study
- Statistical analysis
- CONTRIBUTION OF THE STUDY
- ETHICAL CONSIDERATIONS
- CHAPTER CLASSIFICATIONS
Therefore, the purpose of this study is to analyze the risk perception of insurance policy holders in Gauteng. This section also incorporated the link of risk tolerance with the risk perception of insurance policy holders.
THE CLIMATE OF THE SOUTH AFRICAN INSURANCE INDUSTRY OVERVIEW
INTRODUCTION
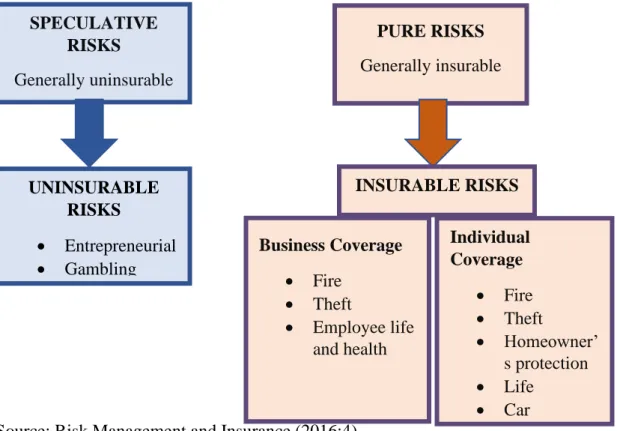
DEFINING RISK
- Speculative risk
- Pure risk
In contrast, pure risk only accompanies the possibility of a loss, with no possible outcomes of gain (Alwang et al., 2005). If a person participates in sports betting with R800, the outcome of the match will be both the possibility of loss or gain, making it difficult to hedge speculative risk.
RISK RESPONSES
- Risk avoidance
- Risk mitigation
- Risk assumption
- Risk shifting
However, various risks that an insurance company cannot insure can be covered by various risk responses. Harner elaborated further, saying that the risk of being injured in an accident can be mitigated by wearing a seat belt in a car.
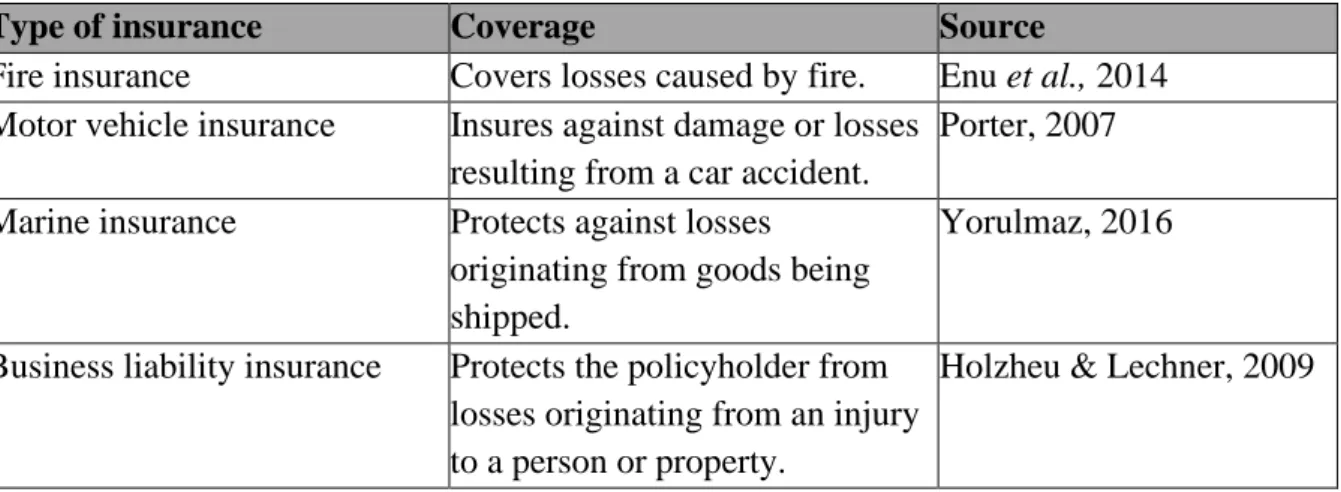
TYPES OF INSURANCE IN SOUTH AFRICA
- Short-term insurance
- Long-term insurance
Unlike short-term insurance, long-term insurance aims to provide the holder with income in the long term, which is retirement (Cutler, 2003). Examples of long-term insurance are life insurance, funeral insurance, and retirement annuities.
THE SOUTH AFRICAN INSURANCE INDUSTRY
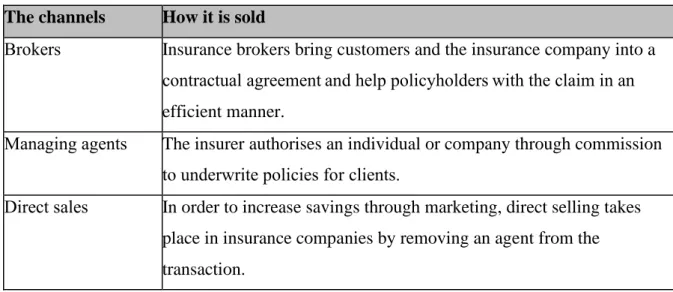
- How insurance is sold
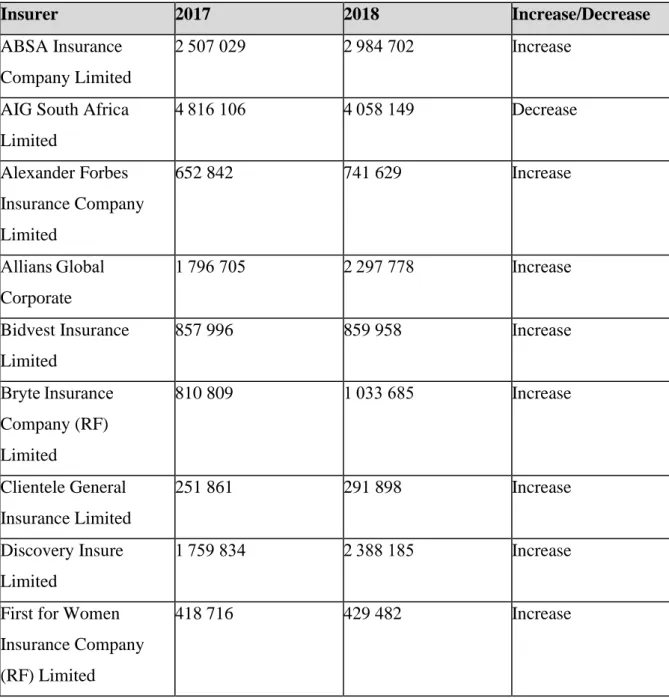
- The financial performance of insurance companies in South Africa
So, the higher the total assets, the greater the financial soundness of the company and the lower the total assets, the weaker the company's financial soundness. As depicted in Table 2.2, 85% of the companies showed an increase in total assets between 2017 and 2018, which further translates to the greater financial health of the companies.
THE FUNCTIONS OF THE INSURANCE SECTOR IN THE ECONOMY
- Insurance sector as a savings and investment intermediary
- Promotes financial stability among households and firms
- Risk protection
Dickinson (1998) stated that there are several ways in which insurance companies can give rise to savings in the private sector. A few researchers have hinted that insurance companies in the country relieve the government's tight budget (World Bank, 2020 & Delloitte, 2020).
THE PRINCIPLES OF INSURANCE
- Principle of utmost good faith
- Principle of indemnity
- Principle of contributions
- Principle of loss minimisation
Ultimately, this principle of indemnification is heavily dependent on the constant economic valuation of an asset. This means that the contribution principle only applies to specific contracts that contain compensation.
REGULATION OF THE INSURANCE INDUSTRY
Precisely in insurance contracts, the principle of indemnification is the financial security that puts the insurance policyholder in the same financial position after a loss that they enjoyed before the loss occurred (Palmer, 1990:74). It stipulates that the insurance policyholder must at all times ensure that loss of the insured property is minimized.
CHALLENGES FACING THE INSURANCE INDUSTRY
- Retaining customers
- More catastrophic events
- The impact of crime on insurance policyholders
- The impact of unemployment on insurance policyholders
- The impact of political risk on insurance policyholders
Ndlela (2020) argues that high crime levels further increase policyholders' awareness of the risks they face. Ultimately, crime is a challenge for the insurance industry because of the risks associated with the increase in crime.
SYNOPSIS
According to Groth and Roberts, political risks increase when society's expectations of society are not met. It can negatively impact insurance performance as unexpected changes occur that were previously undetected.
RISK PERCEPTION
INTRODUCTION
The third and fourth sections outline the overview and relationship between behavioral factors, financial well-being and risk perception. The last section continues to establish the relationship between risk perception and influences from the external environment.
DEFINING PERCEPTION
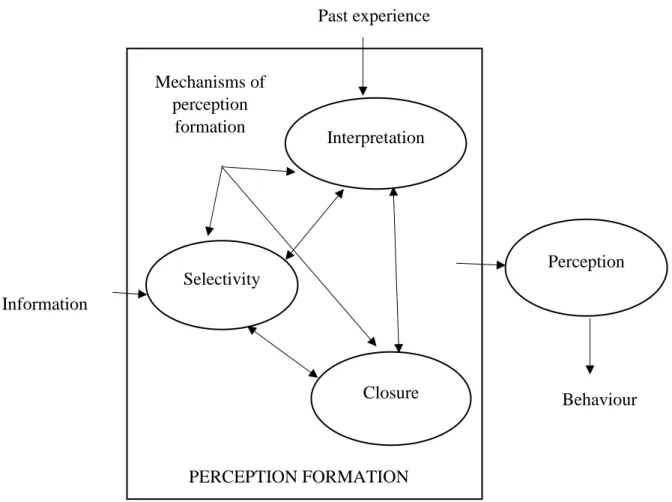
- The Litterer’s perception formation model
Perception is the technique by which an individual perceives reality and arrives at an opinion or point of view. According to Ricciardi, the Litterer's Perception Formation Model provides a visual representation of individuals' perceptual process.
RISK PERCEPTION
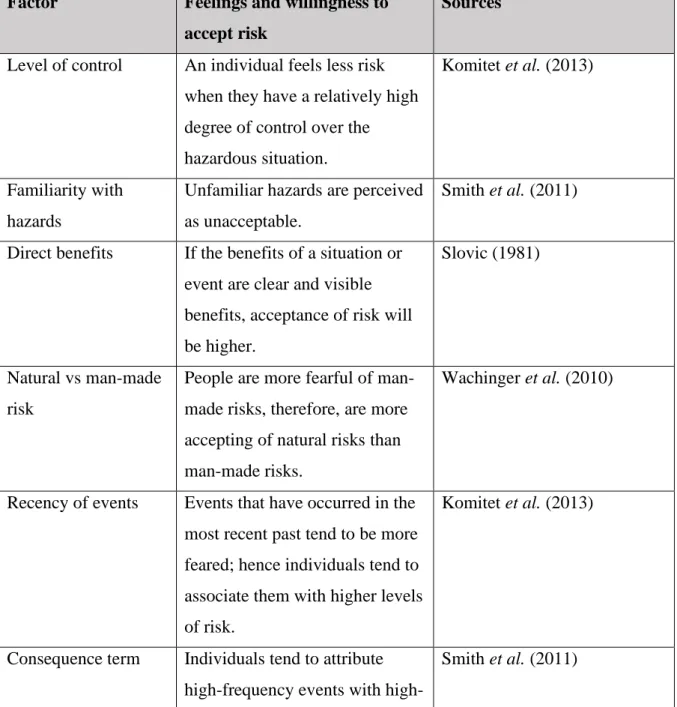
- Factors influencing the risk perception of decision-makers
Therefore, a distinction can be made between the factors influencing individuals' risk perception, as indicated in Table 3.3. What can be deduced from the factors influencing risk perception is that they are mainly based on the feelings and acceptability of risk, determined by human nature (Sutton, 2010:33).
THE LINK BETWEEN RISK PERCEPTION, RISK TOLERANCE AND FACTORS INFLUENCING RISK
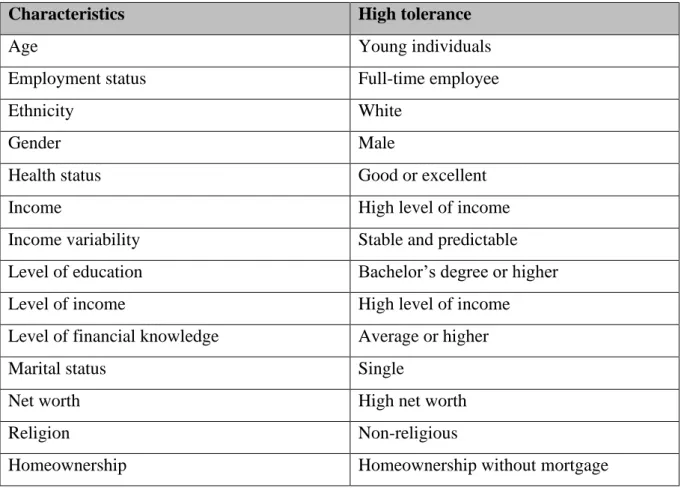
- The influence of demographics on risk tolerance and risk perception
- The link between risk perception and financial well-being
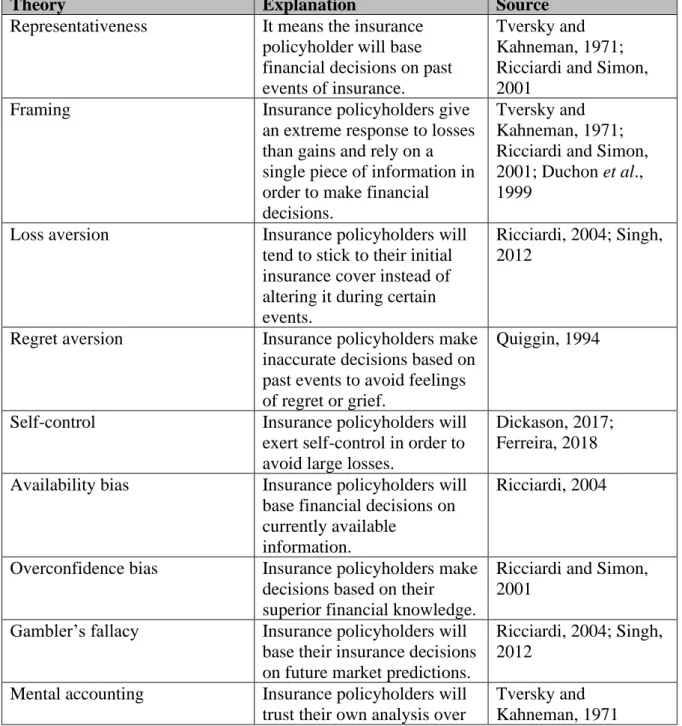
- The link between risk perception and behavioural finance
- Representativeness
- Framing
- Loss aversion
- Regret aversion
- Self-control
- Availability bias
- Overconfidence bias
- Gambler’s fallacy
- Mental accounting
- The link between risk perception and the external environment
According to Mahdzan and Diacon (2008), financial freedom is a fundamental part of the concept of financial well-being. Some insured persons show poor financial well-being, while others show good financial well-being. It has been found that people's positive financial well-being can positively perceive other non-financial risks.
A meta-analysis was conducted to test the link between financial well-being and risk perception and was found to be reliable (Lannello et al., 2020). Furthermore, it was found that women with poor financial well-being often experience more financial stress than men (Friedline, 2020).
SYNOPSIS
RESEARCH METHODOLOGY
INTRODUCTION
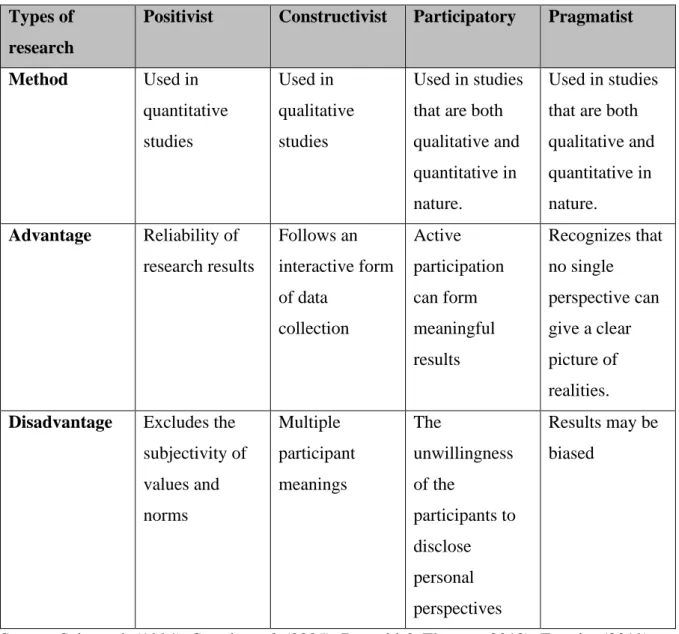
RESEARCH PARADIGM
Positivist assumes that something is meaningful and true regarding the nature of the social phenomenon under investigation (Scotland, 2012). According to Pham (2018), this paradigm helps positivist researchers to understand the sampling methods and questionnaires through empirical tests of the focus group. It depicts the idea that people develop their view of the world by experiencing things and deriving a certain perception based on those experiences (Wilson, 1996).
In general, Muposhi (2015) asserts that since constructivism follows a more personal and interactive form of data collection, the main purpose of the approach is not to predict people's experiences, but to assess and understand human behavior. According to Aspers & Corte (2019), individuals tend to open up about their experiences regarding certain topics, such as politics, with their close friends and tend to be closed to strangers.
METHODOLOGICAL RESEARCH APPROACH
Therefore, this study follows the positivist paradigm where the researcher analyzed the questionnaires of 350 respondents to obtain reliable information about the phenomena in question. It ensures better quality of results because by limiting the disadvantages of qualitative and quantitative approaches. The questionnaire used in this study included a 46-item scale, which included the literature on the subject.
SAMPLING PROCEDURE
- Defining the target population
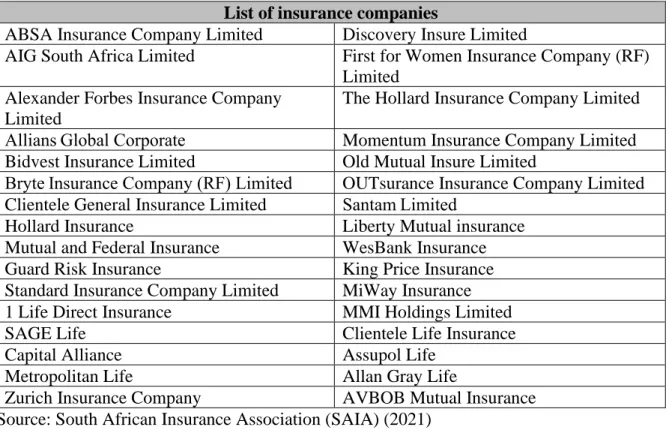
- Sampling frame
- Sampling method
- Sample size
Therefore, the sampling frame for this study consisted of short-term and long-term policyholders from these companies registered in South Africa. The sample size is an important part of the sampling procedure because it indicates the number of items included in the research study (Malhotra, 2010). To determine the correct sample size to use for a study, Struwig and Stead (2010) suggest using the sample size used in similar studies.
The sample size selected was within the range of other studies conducted by Kunle et al. In this study, the sample size of 348 yielded a ratio of six items for each variable.
DATA COLLECTION METHOD
- Questionnaire design
- Questionnaire format
- Questionnaire layout
- Pre-testing the questionnaire
- Administration of the questionnaire
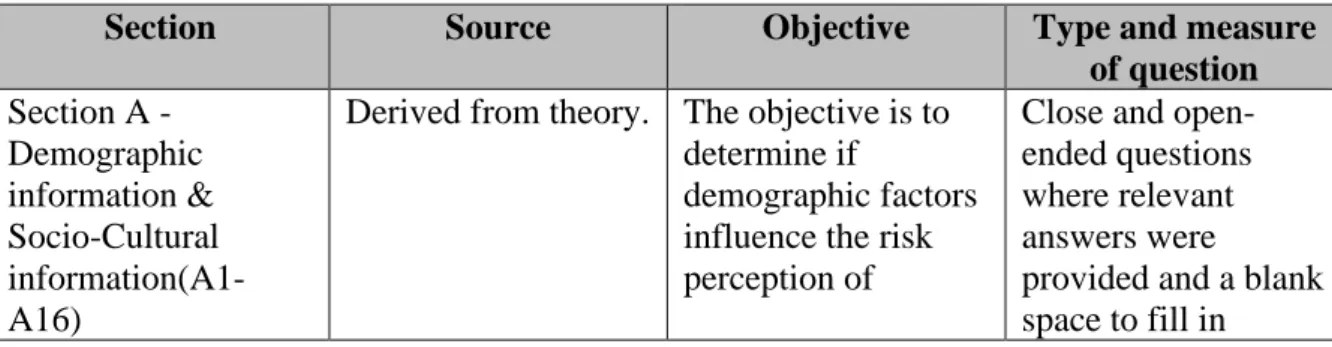
According to Pallant (2007), questionnaire design plays an important role in ensuring that the research questions are answered correctly. The questionnaire was designed to ensure that participants over 18 understood the purpose of the questionnaire. The questionnaire should include simple questions that are easy to read and quick for participants to answer without hesitation (Maree et al., 2011).
The following section discusses the methods used in pre-testing the questionnaire after it has been designed and formatted accordingly. According to Iacobucci and Churchill, a pre-test of the questionnaire should be done so that the researcher knows how the participants will interact with the questionnaire.
PRELIMINARY DATA ANALYSIS
- Data gathering process
- Coding
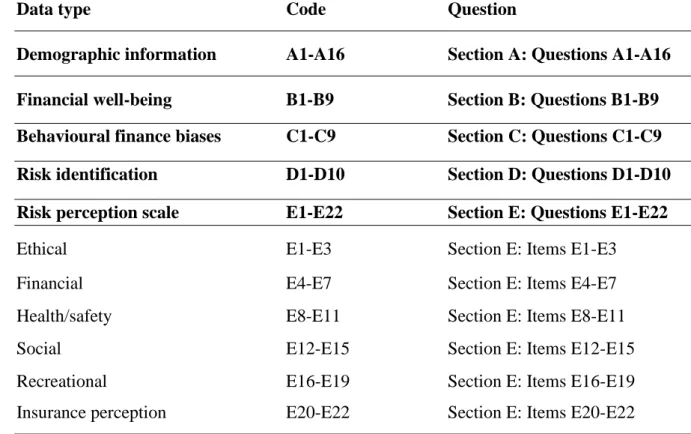
As shown in Table 4.4, the questionnaire was divided into six sections, namely Section A, Section B, Section C, Section D, Section E and Section F. To ensure that all participants understood the questionnaire at the same level, three individuals were students, five were employed, and the other two were unemployed. In addition, as Gauteng is the most diverse province in South Africa, the pre-test included all different ethnic groups to ensure that all ethnic groups understood the questionnaire.
Hinkin (1998) stated that the average time to complete a questionnaire should be 15 minutes to ensure that participants complete the questionnaire and provide honest feedback. The questionnaire was administered online and the final sample excluded individuals who did not meet the required inclusion criteria, incomplete questionnaires and any errors that were present.
STATISTICAL ANALYSIS
- Reliability analysis
- Validity analysis
- Descriptive statistics
- Measures of central tendency
- Measures of dispersion
- Measures of shape
- Correlation analysis
- Test of significance
- Analysis of variance (ANOVA)
- Multiple linear regression
- Outline of statistical techniques utilised
In addition, validity can determine the extent to which differences in observed data can reveal true differences in characteristics. Similar to the variance, the standard deviation is the square root of the variance, which refers to the range in a data set. In other words, skewness is the uneven distribution of the mean, mode, and median (Diedericks, 2015).
This study used descriptive statistics to determine the overall pattern and distribution of the data and determine participant characteristics. The t-test is used to determine whether there is a significant difference between the arithmetic means of the two groups (Hair et al., 2008).
ETHICAL CONSIDERATIONS
A Truthful Representation of Information: The information collected for the study was not attributed to any individual and was accurately used for the purpose of the study; And. Management of data obtained: The data collected from this research will be kept for a maximum of five years.
SYNOPSIS
ANALYSIS AND INTERPRETATION OF EMPIRICAL FINDINGS
INTRODUCTION
ANALYSIS OF DESCRIPTIVE INFORMATION
- Distribution of age
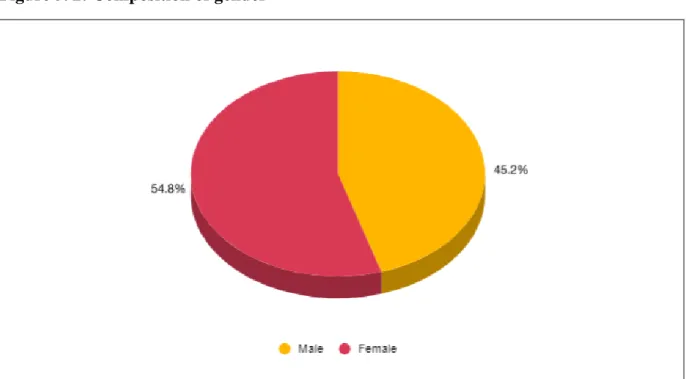
- Composition of gender
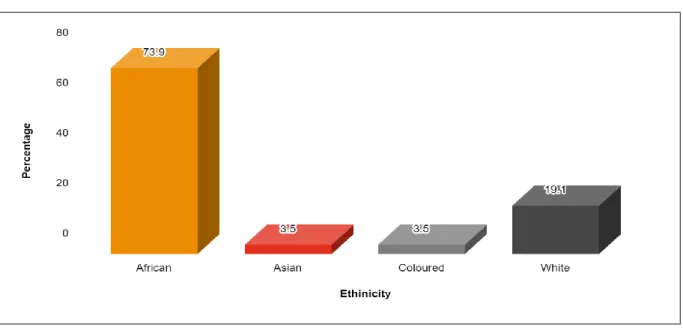
- Composition of ethnicity
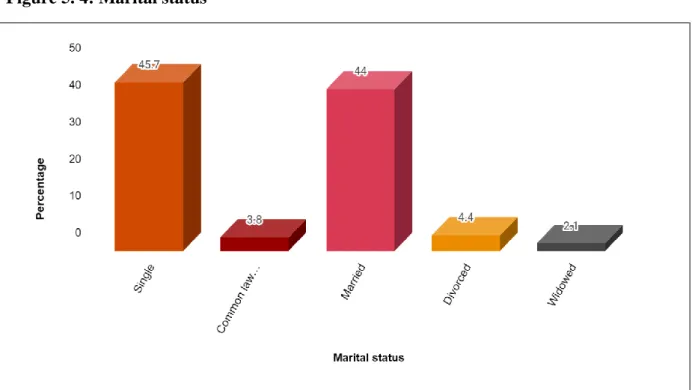
- Marital status
- Highest level of education
- Employment status
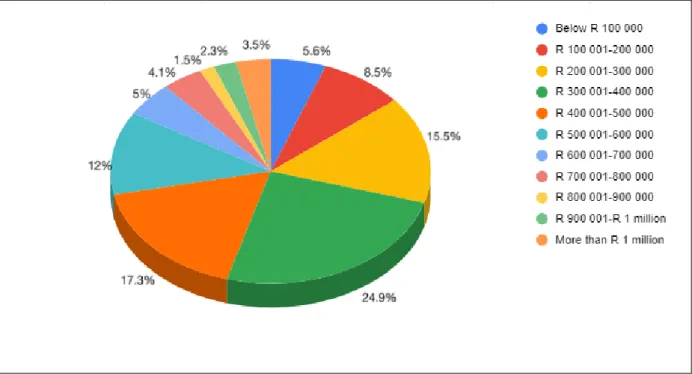
- Annual income
- Income variability
- Net worth
- Homeownership
- Household size
- Number of dependants
- Religion
- Health status
- Type of policy
- Level of financial and insurance product knowledge
DESCRIPTIVE ANALYSIS
EXPLORATORY FACTOR ANALYSIS (EFA)
- Exploratory factor analysis of Section B – Financial well-being
- Exploratory factor analysis of Section D – Risk Identification
- Naming and interpretation of dimensions in Section D: Risk identification
- Internal reliability of Section D – Risk identification
- Exploratory factor analysis of Section E – Risk Perception Scale
- Risk perception scale: Ethical
- Risk perception scale: Financial
- Risk perception scale: Health
- Risk perception scale: Social
- Risk perception scale: Recreational
- Risk perception scale: Insurance risk perception
- Correlation matrix of risk perception scale (DOSPERT)
- Exploratory factor analysis of Section F – The external environment
- Section F: Political-legal
- Section F: Market fluctuations, volatility and international events
- Section F: Crime
- Section F: Unemployment
HYPOTHESIS TESTING
INFLUENCE OF DEMOGRAPHICAL FACTORS ON THE RISK IDENTIFICATION AND RISK PERCEPTION
- Demographics with risk identification and risk perception non-parametric correlation
- Age groups
- Level of education
- Annual income
- Income variability
- Net worth
- Household size
- Dependents
- Health status
- Level of financial knowledge
- Gender
- Marital status
- Religion
- Homeownership
- Employment status
- Type of policy
- Ethnicity
DETERMINE THE RELATIONSHIP OF RISK TOLERANCE ON RISK PERCEPTION OF INSURANCE
- Age
- Education level
- Income level
IDENTIFY THE ENDOGENOUS FACTORS INFLUENCING THE RISK PERCEPTION OF INSURANCE
- The influence of financial well-being on the risk perception of insurance policyholders
- Influence of behavioural finance on the risk perception of insurance policyholders
- Representativeness
- Regret aversion
- Framing
- Overconfidence
- Availability bias
- Gambler’s fallacy
- Mental accounting
- Loss aversion
- Self-control
IDENTIFY THE EXOGENOUS FACTORS INFLUENCING THE RISK PERCEPTION OF INSURANCE
- The relationship between external events and the risk perception of insurance policyholders
- Political-legal
- Market fluctuations
- Crime
- Unemployment
FACTORS INFLUENCING RISK PERCEPTION
- Risk perception non-parametric correlation
- Multiple linear regression on risk perception
- Age
- Gender
- Representativeness
- Gambler’s fallacy
- Self-control
SYNOPSIS
CONCLUSION AND RECOMMENDATIONS
INTRODUCTION
To highlight the contribution of the research study, this chapter presents the main results of the empirical measures. Furthermore, Chapter 6 discusses the limitations of the research study and provides recommendations for future research studies.
OVERVIEW OF THE STUDY
- Theoretical objectives
In addition, the chapter presented the relationship between risk perception, risk tolerance and other factors by reviewing existing literature studies. A sample size of 341 policyholders was considered and adequate for factor analysis in this study. To participate in the study, participants were required to be over 18 years of age, have a certain level of education, hold an insurance policy and currently reside in Gauteng.
The analysis and interpretation focused on achieving all the empirical objectives and the primary objective of the research study. The subsequent section summarizes the most important empirical findings of the study as stated in Chapter 1.
FINDINGS OF THE STUDY
- Determine how demographical factors influence the risk identification and risk perception of
- Determine the relationship of risk tolerance on risk perception of insurance policyholders
- Identify the exogenous factors influencing the risk perception of insurance policyholders
However, no statistically significant differences were found between religious groups and risk perception at a 1 percent significance level. These results suggest that demographic factors have some influence on policyholders' risk perception. To determine the relationship between risk tolerance and risk perception of policyholders, this was achieved by performing a test between risk tolerance and the demographic factors, as shown in section 5.7.
A non-parametric Spearman's correlation test was performed to assess the impact of financial well-being on policyholders' risk perception. The results showed a statistically significant positive relationship between the political-legal factor and recreational risk.
CONTRIBUTION OF THE STUDY
LIMITATIONS AND RECOMMENDATIONS FOR FUTURE RESEARCH
CONCLUDING REMARKS