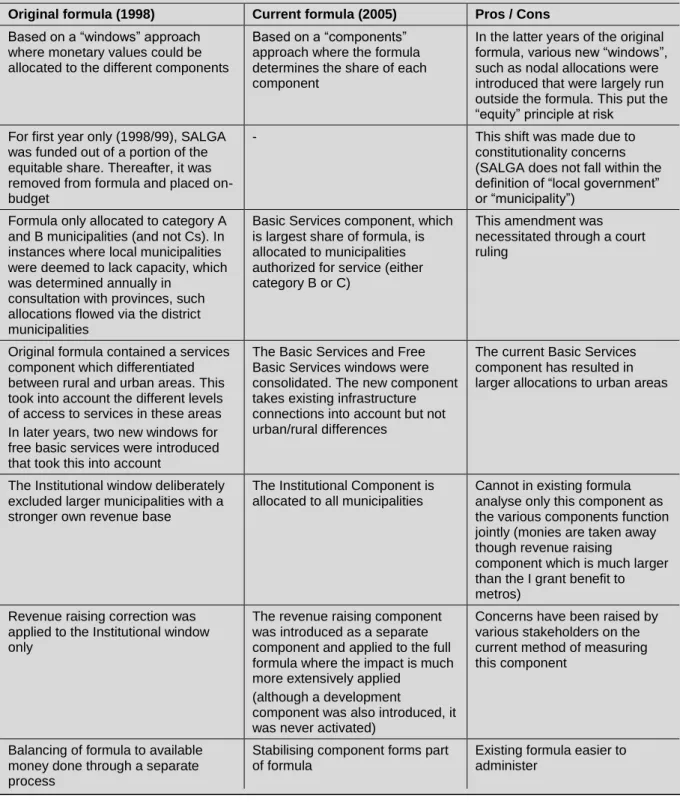
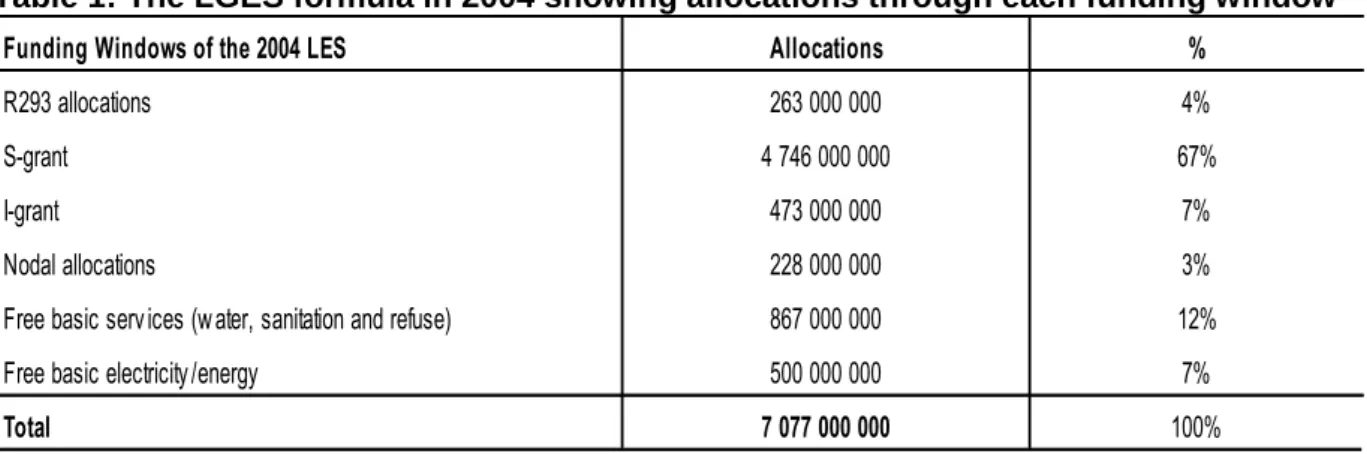
Details of how stakeholders can contribute to the revision of the LGES formula are provided in the final section of the paper. This is an inevitable consequence of the tight timelines in which the review of the LGES formula must be completed. The basic services grant (S) aimed to meet the cost of providing basic services to poor families, while the municipal institution grant (I) supported the financing of the municipal institutional and political structures.
The relative weights of the different components
In the 2012/13 formula, the value of the adjustment factor was 4.95, which means that the allocations in the basic benefits and institutional components are multiplied almost five times before the RRC and C components are applied to them. This component is by far the largest in the formula, accounting for 92.4 per cent of the value of final LGES awards in 2012/13. The purpose of the basic services part is to assist municipalities with providing free basic services to poor households and with the financing of municipal health services2.
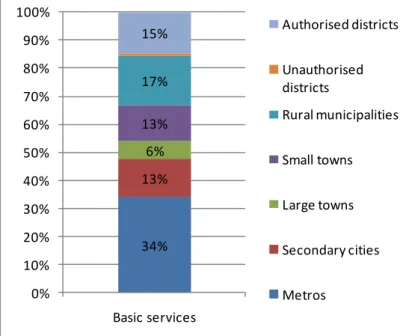
This includes all five of the basic services above, as well as firefighting, stormwater management and municipal roads. Note: figures reflect the size of the basic services component before the deduction of the RRC correction. The figure below shows the proportions of the basic services component allocated to different groups of municipalities.
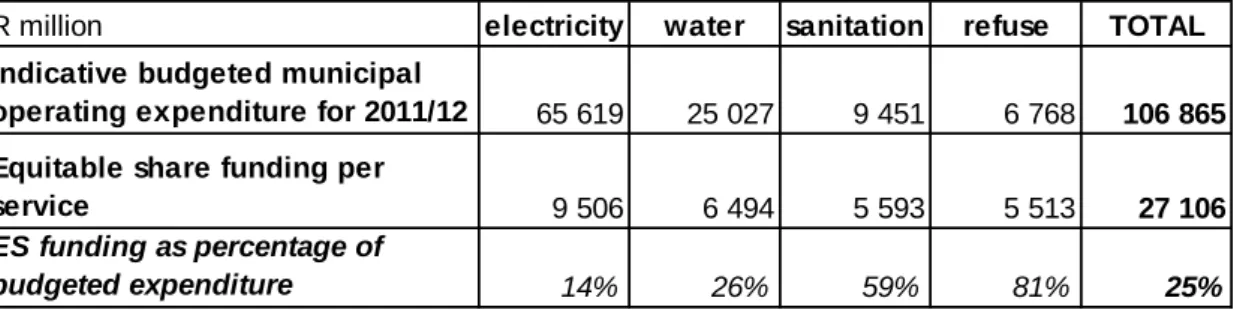
This means that the amounts allocated to services in the current LGES formula are unlikely to be very accurate reflections of the costs of providing those services. Part of the reason for this is that the funds available in the current basic services component are allocated based on a ratio of the costs of different services rather than exact costs of the services. The actual value of the allocations per household used in the formula is determined by multiplying this ratio by the available funds.
The table below shows the actual average allocations per household for each of the basic services during the 2012 Medium Term Expenditure Framework (MTF) period.

The Institutional Component
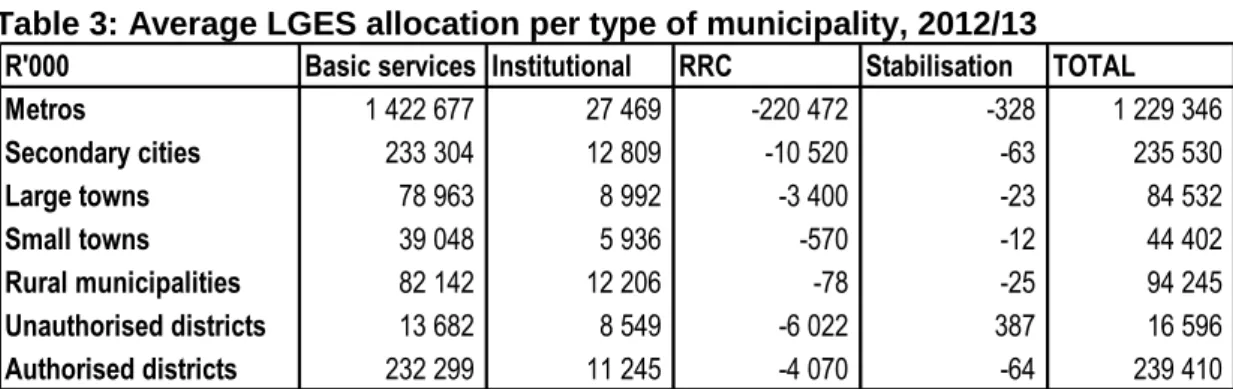
If we assume that bulk water only accounts for 50 percent of the cost of municipal water supply to households, this would mean that water would cost up to R14/hr. to deliver to households. It should be noted that in the current LGES formula, the subsidy levels for municipalities are not adjusted to take into account that the costs of providing services are different in the different municipalities. Although the institutional component of the formula is much smaller than the basic service component, it is still worth more than R2.6 billion in 2012/13 before the subtraction of the RRC correction (after the RRC correction is subtracted, the institutional component is still worth more than R2.5 billion).
This demonstrates the impact of including an element of poverty in the calculation of the component, as secondary cities are on average much larger than rural municipalities (with secondary cities having an average population of 318,000 and 66 councillors, and rural municipalities having an average population of only 179,000 and 41 councillors). Note: Figures reflect the size of the institutional component before subtracting the RRC correction. The figure below shows that of the R2.6 billion allocated through the institutional component, the majority (57 percent) goes to rural and small town municipalities.
Metros receive only 8 percent of the total value of the I-component, and their I-component allocations are less than the amounts deducted from the RRC component (see the next subsection on RRC). This is an area that will need further investigation as part of the LGES review.
The development component
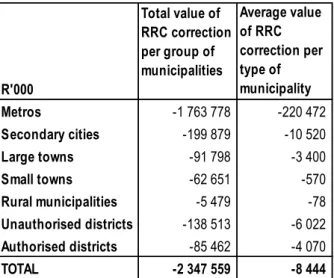
Unlike the other components of the formula discussed so far, the RRC correction is subtracted from the LGES allocation to municipalities. The net effect of this is that municipalities with a substantial revenue base receive smaller LGES allocations and municipalities with a limited own income base receive larger LGES allocations than without the RRC correction. Since 2011/12, the RRC correction rate for municipalities between these two ends of the spectrum is calculated using a formula that calculates an individual rate between 1.5 percent and 7.5 percent based on that individual's expected own income per resident. local authority.
The figure below clearly shows the disproportionate impact of the RRC correction on metropolitan municipalities, which account for 75 percent of all funds drawn from the component. District councils have the RRC applied to the RSC tax refund grant and this accounts for 10 per cent of the value of the RRC. RRC on rural and small town municipalities is too small to have data marks in the figure below, small town municipalities account for 3 per cent. of RRC and rural municipalities for only 0.2 per cent.
The RRC correction provides a way to account for the different abilities of municipalities to raise their own revenue. However, subtracting from the components already described above, the way the RRC correction is structured greatly increases the complexity of the formula and makes its operation much more difficult to understand and work with.
Stabilization component
As such, it makes a major contribution to improving the differentiation in the way the formula handles different municipalities. Guarantees are provided as a means of giving stability and predictability to the system of LGES transfers so that municipalities can plan their future budgets with greater certainty about the value of their future LGES transfers. However, the stabilization component can also result in delays in the impact of changes in the formula, with increases and losses due to changes in the formula being moderated by the need to cover the cost of funding the guarantees.
Where guarantees must be fulfilled, the funds to increase a municipality's grant to fulfill the guarantee are deducted proportionally from the grants to all other municipalities. This means that larger amounts are deducted from municipalities with larger LGES grants, but funds are taken from all municipalities to cover the costs of maintaining the LGES guarantees. The effect of these reductions on a single municipality is very small, with the average impact on metros in 2012/13 being just 0.03 per cent of their average allocation.
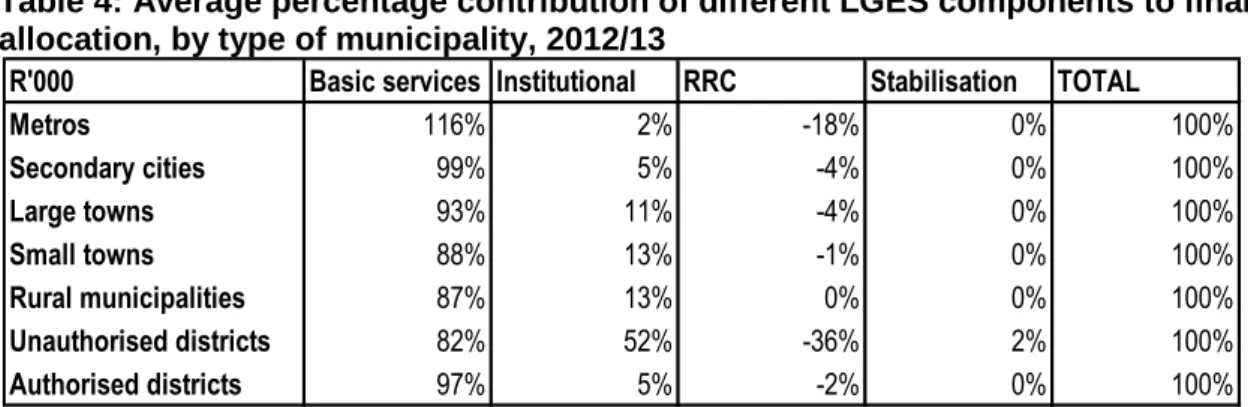
The final allocation to each municipality is determined by adding their allocations through the basic services and institutional components and then multiplying them by the adjustment factor that ensures that all available resources are used. The RRC correction is then subtracted and the stabilization factor is applied, yielding the final allocation of the LGES formula for each municipality.
ANALYSIS OF LGES ALLOCATIONS 1 Growth and Distribution of the LGES 2002 - 2012
Comparing the LGES allocations to different groups of municipalities
The trends depicted in Figure 5 must be analyzed in light of the several political and structural changes to the LGES formula and to the local government system during the period. Metropolitan municipalities received 20 percent of LGES, while secondary cities and smaller cities both received 17 percent of LGES. The other municipalities' shares have been relatively constant during the period (i.e. secondary cities around 17-18 per cent, larger cities with 7 per cent and smaller cities around 15-17 per cent).
The above trends can be explained by various factors and changes that occurred during the period under review. First, after the changes in the functional framework and the reorganization between expenditure responsibilities between category B and C municipalities, the share of rural municipalities in LGSQ decreased to 22 percent in 2003/04 (from 27 percent in 2002/03). The introduction of the current formula in 2005/06 and the subsequent introduction of the municipal health services function in LGES (separated for metros and district municipalities) may also have contributed to a gradual decline in the weight of LGES for rural municipalities.
The increase in the share of metros is also the result of updating the basic data of the formula from the 1996 census to the 2001 census. The gradual increase in the share of metros in the LGES moderated in 2009/10 with the introduction of a differentiated tax system in the RRC component.
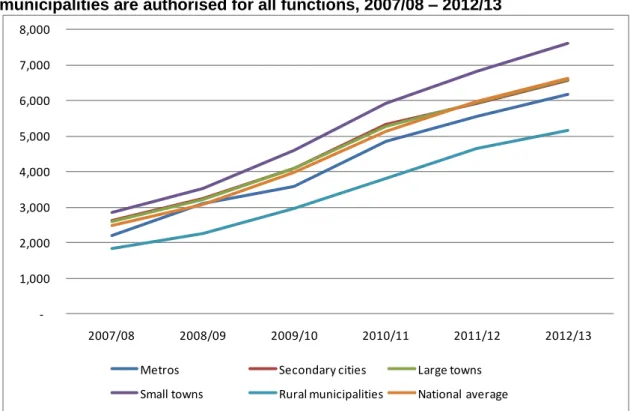
Comparing allocations on a per poor household basis, assuming the same functions were allocated to all municipalities
Although the above analysis attempted to relate the various changes in relative LGES shares among different groups of municipalities to specific policy changes, the guarantee mechanism that was part of both formulas causes the effect of formula changes to be gradually felt in the system. The guarantee mechanism protects LGES from large shocks or sudden changes in allocation levels. The same will apply to changes due to the current review process of the LGES formula, new allocations will need to be phased in taking into account the guarantees on current allocations for the 2012 Medium Term Expenditure Framework.
The rural municipalities consistently receive the lowest allocation per poor households, mainly as a result of the low access to services in these municipalities, which results in them receiving only the lower basic service subsidy for unserved households for most of their poor households. The impact of the changes to the formula in 2009 and 2011 can be clearly seen in these tables. However, in 2009 the calculation of the RRC correction was changed and as a result the growth in metro allocations fell below that of other municipalities, and their average per poor household allocation fell back below the national average in 2009/10.
In the year 2011/12, we can see the impact of the changes to the inclusion of the poverty factor in the institutional component and the increase in the subsidy rate for unserved households in the basic services component. These changes have resulted in funding for rural municipalities per poor household increasing from 74 percent of the national average to 78 percent.
SUMMARY OF THE PROBLEMS AREAS IN THE CURRENT LGES FORMULA
The following tables show the increase from year to year in the average allocations per poor family for each group of municipalities (table 12) and the size of each group for the allocation of poor families in relation to the national average (table 13). In Table 13, metros in 2012/13 receive slightly less than the national average (93 per cent of the national average), while allocations to secondary cities and large cities are in line with the national average (both 99 per cent), cities small are significantly above the national average (115 percent) and rural municipalities (78 percent) receive significantly less than the national average allocation for poor families. The RRC in its current formula does not adequately measure fiscal capacity as it is based on past actual income data.
Provides high level of stability and predictability (three year indicative allocations with 100% guarantee for year one and 90% for year two) Includes basic services delivered through both clutch and non-clutch delivery mechanisms (eg VIP sanitation).
WAY FORWARD