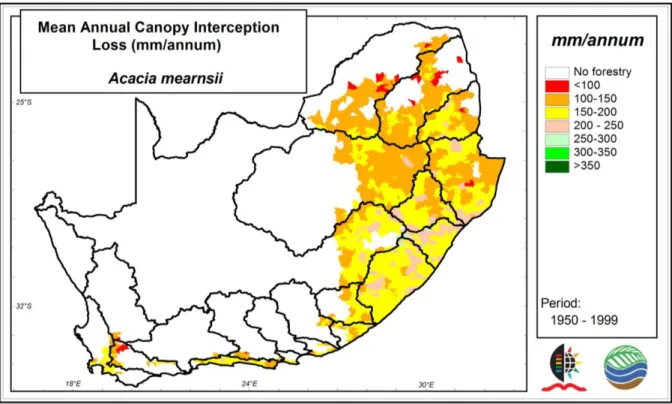
111 Figure 4.6 Representative average annual canopy interception loss for Acacia mearnsii per quintal catchment in South Africa. 112 Figure 4.7 Representative average annual canopy interception loss for Pinus per penta catchment in South Africa.
INTRODUCTION
Aims and Objectives
The overall aim of this study was to improve knowledge and perception of the impact and amount of canopy and litter interception in commercial and native forests in South Africa. To assess the use of remote sensing to determine LAI as an aid in estimating canopy storage capacity and canopy interception. f) Applying tools/models to assess the potential impact of climate change on canopy interception in South Africa.
Thesis Structure
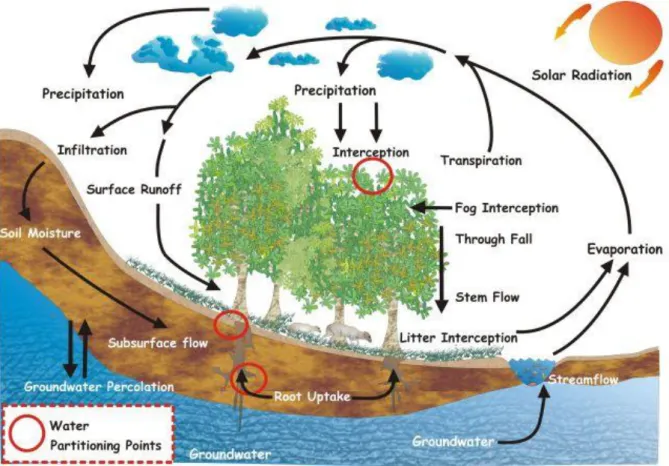
PARTITIONING OF PRECIPITATION IN FORESTS
WOOD VERSUS WATER: A SOUTH AFRICAN PERSPECTIVE
Legislation
Since forestry has been declared an SFRA, it is therefore important to understand all forest processes that affect the amount of water reaching the stream. One such process that has not received enough attention in South Africa is canopies and litter interception, as highlighted in the next section.
CANOPY INTERCEPTION
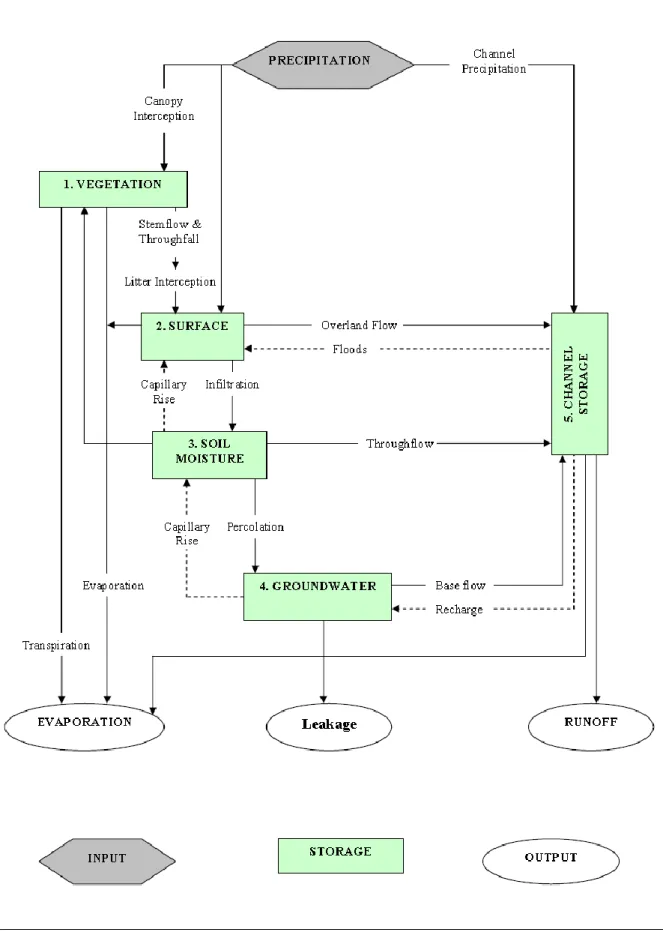
Canopy Interception and the Water Balance
The observed results for the water that drains to the ground, i.e. the "usable water", is a good indication of how the canopy and debris interception models performed together as a whole/system. Where, r is the radius at the base of the cone (m), and h is the height of each cone (m). The volumes of the truncated cones were calculated using Equation 5.2.
Factors Affecting Interception
- Climatic parameters
- Canopy storage capacity
- Throughfall and stemflow
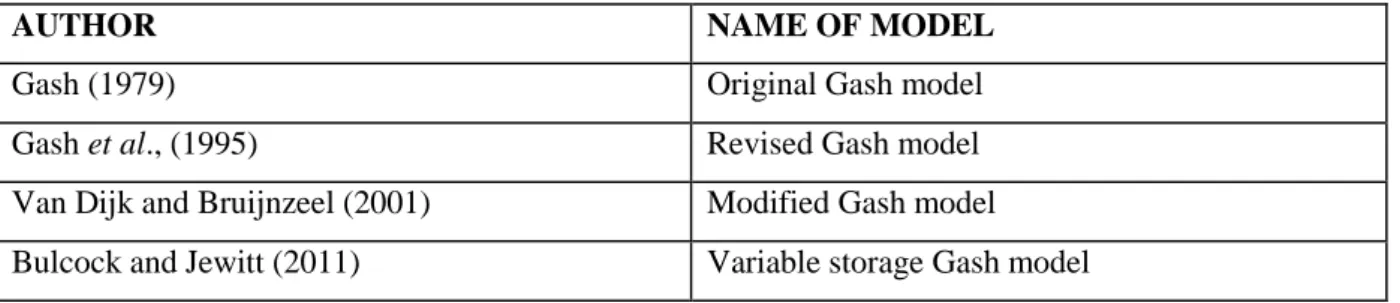
Canopy Interception Models: From Origin to State-of-the-Art
This led to the development of a 'sparse canopy' variant (Gash et al., 1995), in which evaporation from the wet canopy was linearly dependent on the proportion of canopy cover (van Dijk and Bruijnzeel, 2001a). Van Dijk and Bruijnzeel (2001a, 2001b) then modified the revised Gash et al., (1995) model to allow its application to fast-growing vegetation where the leaf area index (LAI) varies over time.

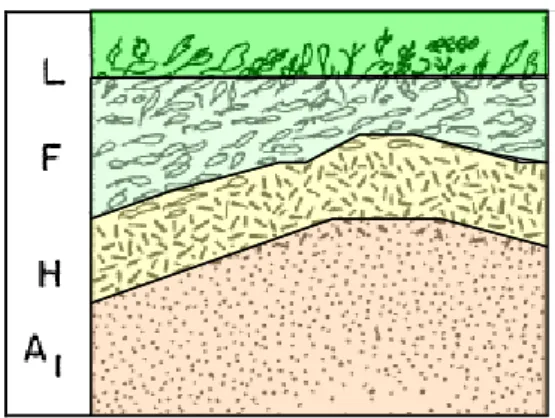
LITTER INTERCEPTION
Forest Litter Classification
The hydraulic mechanisms of the forest floor interception are similar to the canopy interception process. The type and composition of litter on the forest floor can also vary within the forest.
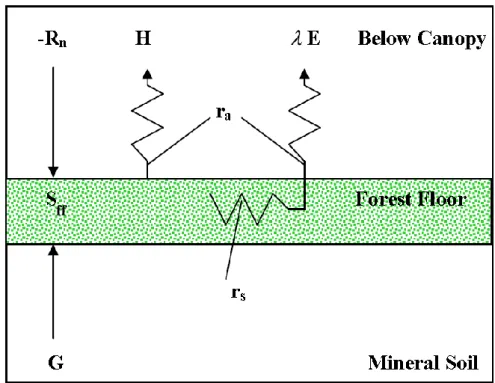
FOREST FLOOR EVAPORATION MODELS
Forest Floor Water Dynamics
An assumption of the LITEM model is the absence of plant water uptake (Park et al., 1998). Although rainfall interception and transpiration through the trees' canopy account for most of the transfer of water and energy, a smaller but significant role is played by forest floor litter interception (Schaap and Bouten, 1997).
MATERIALS AND METHOD
- Site Description
- Forest Stand Description
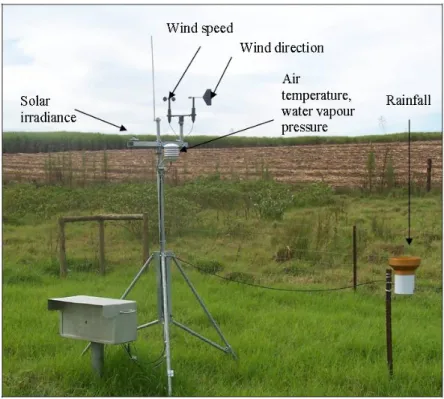
- Weather Data
- Canopy Interception Measurements
- Leaf Area Index Measurements
- Litter Interception and Water that Drains to Soil
- Possible errors in litter interception measurements
The radial arrangement of the three bowls is also responsible for the linear variation within the canopy. Due to the height of the trees, it was not possible to take measurements above the canopy. Two litter interceptor bins were placed at each site to account for the spatial variation of litter thickness.

RESULTS
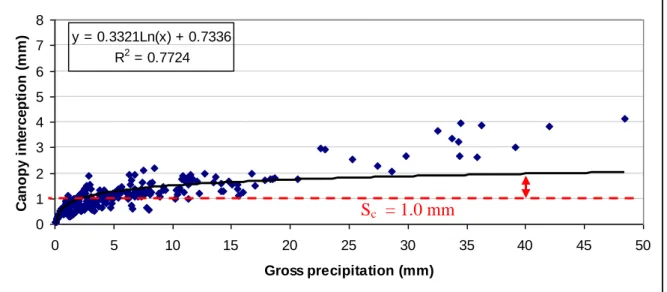
Canopy Interception and Storage Capacity
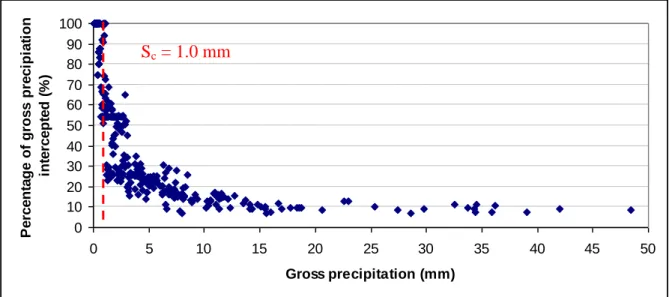
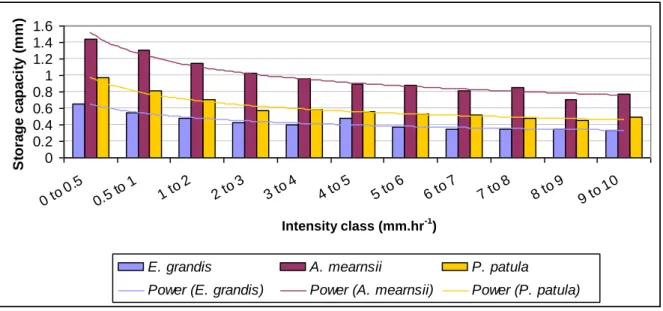
This is illustrated by the arrow showing evaporation after the storage capacity has been reached. The maximum amount of gross precipitation that can be completely captured by the canopy is the storage capacity of the canopy, as illustrated by the red dotted line in Figures 2.10 to 2.12. The storage capacity of the canopy was also found to vary with rainfall intensity, as shown in Figure 2.13.
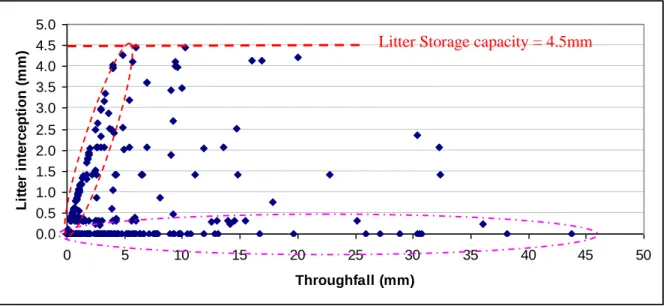
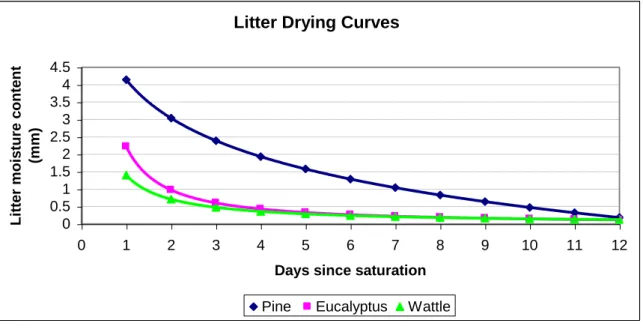
Litter Interception
The circled values closest to the y-axis represent the increasing litter interception with increasing throughput. The storage capacity is illustrated by the horizontal dashed red line and was determined by analyzing the data for events that occurred after a long dry period where the litter was completely dry and resulted in water draining out of the bottom of the waste basins (i.e. where drained to the ground). The debris intercept results reported in this study may be slightly too high due to the potential errors reported in Section 2.6.1.
Relative Contributions of Canopy and Litter Interception and Water that Drains to
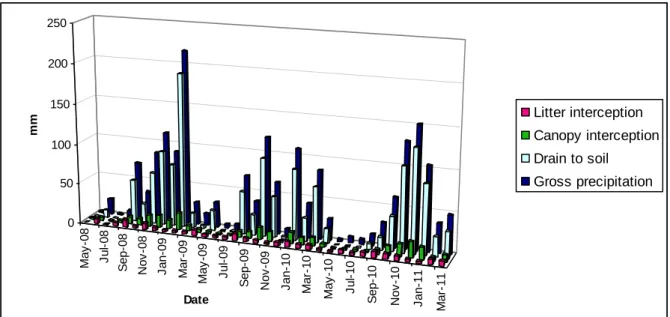
During the summer months, more water flows to the ground than is collected (cover + litter). The total amount of water draining to the soil during the study period is summarized in Table 2.7. After the canopy and litter have been intercepted, the remaining water drains to the ground (net precipitation).

DISCUSSION AND CONCLUSION
The canopy structure is described by the slump coefficient (p), streamflow partition coefficient (pt), canopy storage (Sc) and trunk storage (St). The model is essentially based on the dynamic calculation of canopy and trunk water balance through equations 3.2 and 3.3. A shortcoming of earlier versions of the Gash model is that they consider the canopy storage capacity to be constant.
VARIABLE STORAGE GASH INTERCEPTION MODEL
- Interception Parameters
- Analytical Model Equations
- Canopy Structure Parameters
- Storage Capacity and Drop Size
- Climatic Parameters
Trunk flow is the product of trunk flow distribution coefficient (pt) and the difference between gross precipitation and trunk fill rain. Additionally, the "Variable Storage Gash Model" introduces a vegetation/species-specific parameter called maximum elemental volume ( ve . max ) that accounts for canopy water retention characteristics. The maximum elemental volume (ve . max) does not change with the growth of the tree due to the linear relationship between Sc.
LITTER INTERCEPTION MODEL
Litter Model Conceptualization
The drying curve equations, litter storage capacity and litter thickness for each of the three genders are summarized in Table 3.2. The litter model, which is programmed in a Microsoft® Excel spreadsheet, is site-specific, as litter characteristics will vary between species, age and climate region. An "accounting" method is then used to calculate litter moisture content depending on the previous dry days following litter moisture from the drying curves in Table 3.2.
STUDY SITE
FIELD DATA COLLECTION
- Throughfall and Canopy Interception Measurements
- Litter Interception and Water Drained to Soil Measurements
- Canopy Interception
- Litter Interception
- Water that Drains to the Soil
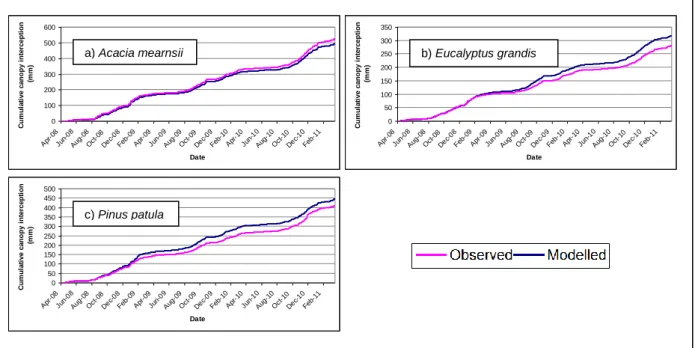
The results of the litter interception study are shown in Figure 3.5 and summarized in Table 3.5. The results of the modeled data for the period September 1998 to March 2011 are summarized in Table 3.9. The difference in the results of the modeled water runoff to the bottom for the two periods is and 2.0% for E.
CONCLUSION
National estimates of canopy interception using the Variable Storage Gash Analytical Interception Model in South Africa. National estimates of canopy interception using the Variable Storage Gash analytical interception model in South Africa. In this paper, we aim to assess the importance of canopy interception from commercial forestry across South Africa.
METHODOLOGY
Climatic Parameters
- Precipitation
- Reference evaporation by the Penman-Monteith Method
- Temperature
- Mean rainfall rate
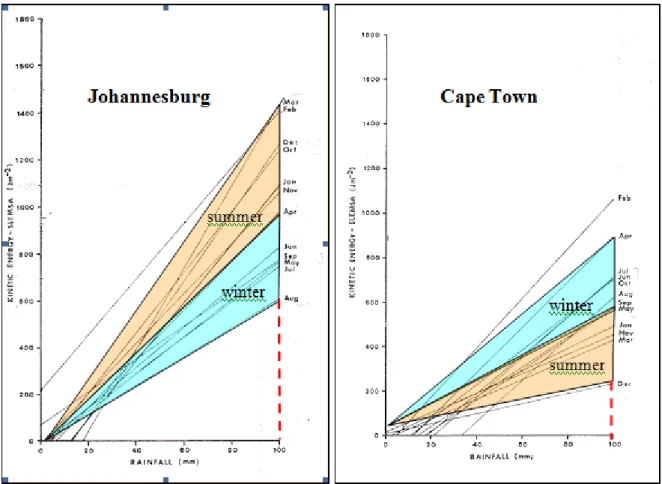
These stations were then overlaid on a rainfall seasonality map of South Africa as shown in Figure 4.2 (Schulze and Maharaj, 2007). In this study, this methodology was applied to the QC database to determine an updated map of rainfall seasonality using mean monthly rainfall (Schulze and Kunz, 2010). The normalized correction factors set out in Table 4.2 were then averaged for each of the six rainfall seasonality regions as obtained by Schulze and Maharaj (2007) to obtain the rainfall intensity correction factors as shown in Table 4.3.
Canopy Structure Parameters
- Leaf area index
- Canopy cover fraction
- Storage capacity
Ages for each genus are as follows; 4-year-old Eucalyptus, 7-year-old Pinus and 4-year-old Acacia mearnsii (Gush et al., 2001). The relationship between c and LAI is thus given by Equation 4.1 and is illustrated in Figure 4.4, where the extinction coefficient k = 0.5 (Landsberg and Waring, 1997; Battaglia et al., 2004) was used in. The maximum elemental volume (vemax. ) does not change with tree growth due to the linear relationship between Sc.
RESULTS AND DISCUSSION
On the east side, canopy interception by Eucalyptus (Figure 4.8) is between 10% and 20% of gross precipitation. A useful indicator of canopy interception is the average annual canopy interception per rainy day as illustrated in Figures 4.11 to 4.13. The average canopy interception loss per rainy day for Acacia mearnsii is higher than that of Eucalyptus, with more values between 2.0 and 2.5 mm in all forestry zones.
CONCLUSION
- Tree Samples
- Canopy Interception
- Litter Interception
- Canopy and Litter Interception Models
- Sap Flow Measurements
- Stem Growth Measurements
- Relative Contributions of Transpiration, Canopy and Litter Interception
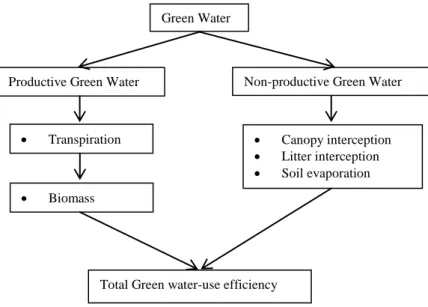
- Productive Green Water Use Efficiency
- Total Green Water-Use Efficiency
The purpose of the measurement methodology was to determine the relative contributions of sap flow (transpiration), canopy interception and litter interception, as well as the "productive green water" and. Transpiration is responsible for the largest green water use at 41% and 95.9% of gross precipitation for both P. Canopy interception is the second highest green water use with 29.8% and 22.1% of gross precipitation for P.
DISCUSSION AND CONCLUSION
While it is the total flow of green water that must be considered from a water resources management and planning perspective, the importance of considering the individual components of productive and non-productive green water cannot be overlooked. Investigating the feasibility of using stem growth increments to estimate water use of Eucalyptus grandis and Pinus patula plantations. Water use efficiency of a selection of native and exotic tree species in South Africa as determined using seed flow and biomass measurements.
CANOPY INTERCEPTION AND LEAF AREA INDEX
The dependence of the storage capacity on the LAI is emphasized by Eq. 6.1) developed by von Hoyningen-Huene (1981) and is still recognized as an accurate, non-crop specific estimate of maximum storage capacity (Scmax) (mm), as highlighted by Kozak et al., (2007). Van Dijk and Bruijnzeel (2001a, 2001b) adapted the well-known revised model of Gash et al. (1995), allowing it to be applied to fast-growing vegetation where the LAI changes over time. The water retained on the leaves is then evaporated from the wet canopy surface, which has been found to evaporate at rates greater than the available net radiation and potential evaporation due to advection and the low aerodynamic drag of wet canopies (Schulze, 1995 ; Davids et al., 2005).
METHODOLOGY
- Site Description
- Hyperion Hyperspectral Satellite
- LAI Measurement
- Atmospheric Correction of Hyperion Image
- Vegetation Indices
- Accuracy Assessment
Atmospheric correction is a preprocessing procedure undertaken to compensate for the effects of atmospheric particles through absorption and scattering of the radiation. The "red edge" is a term used to describe the steeply sloping region of the vegetation reflectance curve between 690 nm and 740 nm caused by the transition of chlorophyll absorption and near-infrared leaf scattering. The use of near-infrared measurements, with much greater penetration depth through the canopy than red measurements, allows estimation of the total amount of green material in the column (RSI, 2005).

RESULTS
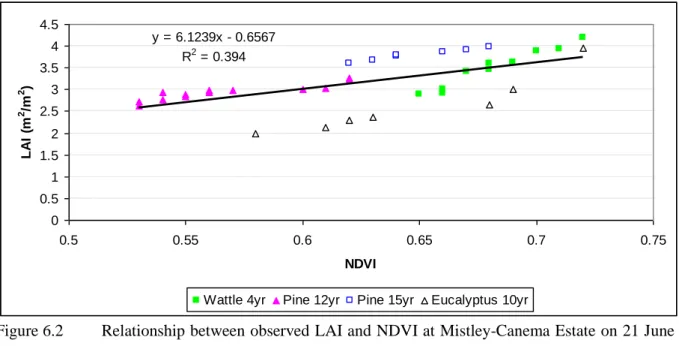
Figure 6.2 shows that the Pine 12yr and the Wattle 4yr can be estimated well using the NDVI. Using this information, the data obtained from the Hyperion image can be converted into an image of LAI for the study area, as shown in Figure 6.6, which is performed using the Vogelmann index 1. In addition, the image obtained for the LAI was created (Figure 6.6) can be used to estimate the maximum storage capacity, as shown in Figure 6.7, by applying the von Hoyningen-Huene (1981) equation (Equation 6.1).
DISCUSSION AND CONCLUSION
From this study, it can be concluded that remote sensing is a valuable tool for estimating LAI for applications in hydrology such as canopy interception modeling. Although the results obtained in this study suggest that remote sensing techniques can be used in interception studies, further field work is needed to validate the model. Determining water use and forest plantation growth by integrating remote sensing and field data in a GIS-based 3-PG model.
Introduction
A study of the impact of climate change on canopy interception and transpiration in commercial forests in South Africa. However, fears of climate change remain, and the many uncertainties surrounding it mean that its full effects are still insufficiently understood to date. To simulate changes in LAI and transpiration under different climate change scenarios using the CABALA model, and.
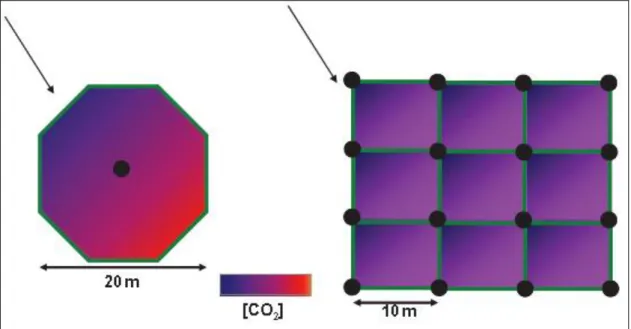
Free-Air CO 2 Enrichment (FACE) Experiments
- A Review of FACE Experiments: Ainsworth and Long (2005)
- CABALA (CArbon BALAnce) Model
- Verification of the CABALA model
- Basis for the selection of the CABALA model
- Approach to simulation of leaf area index
- Variable Storage Gash Model
- Climate database
- Scenario Modelling Process
- Site selection
- Baseline leaf area index data
- Data analysis
The CABALA model has been validated under a wide range of conditions in Australia (Sands, 2003; . Battaglia et al., 2004). The CABALA model has also been used in a climate change vulnerability and adaptation study in Australia (Bataglia et al., 2009). A detailed description of how the CABALA model calculates LAI can be found in Battaglia et al., (1998) and Battaglia et al., (2004).
RESULTS AND DISCUSSION
Leaf area index
Transpiration
Canopy interception
CONCLUSION
THE IMPORTANCE OF HYDROLOGICAL MEASUREMENTS
HYDROLOGY AS AN INTERDISCIPLINARY SCIENCE
THE IMPORTANCE AND IMPERFECTIONS OF MODELS
MODEL UNCERTAINTY, VERIFICATION AND VALIDATION
CONCLUSION