As a nation, South Africa must develop anticipatory policies for the management and guidance of the environment. This thesis attempts to assign a monetary value to the recreational use of the environment.
Problem Statement, Hypothesis And Objectives
Economics is a science of choice and one of the fundamental goals of economics is to address the problems associated with scarcity. The modus operandi of the thesis will be to firstly estimate the demand for recreation at Midmar, and then secondly, using the derived demand curve, determine the consumer surplus associated with Midmar.
Organization Of The Study
It therefore leads to a situation where the fee applied underestimates the true value of a visit to the resort, thereby creating a consumer surplus.
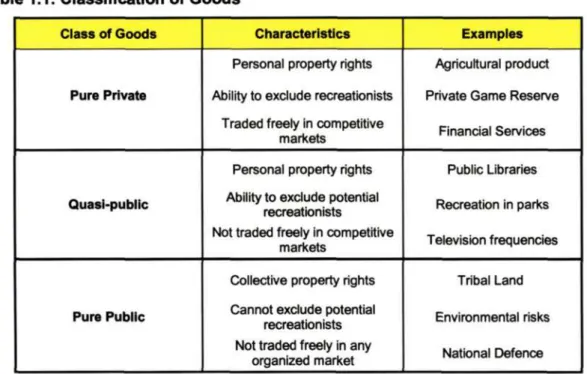
Classification Of Goods (Private Vs Public Goods)
Midmar has certain property rights that have been granted to a trustee (although in a strict sense the trustee does not own the property, but only manages the property). This administrator may have the power to exclude potential users, although in reality this may be difficult as environmental resources are usually open for use by all consumers.
The Concept Of Price / Value In Environmental Assets
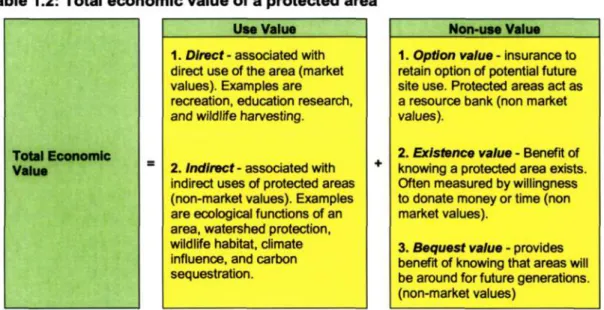
It should be emphasized that this research is concerned with the use value of the resort and ignores the non-use value. There may also be issues such as externalities, problems of free riding and property rights which may affect the monetary value of the resort, but which are ignored in this thesis.
Study Area Under Review
While the researcher attempts to attribute a monetary value to recreation at Midmar, he does not take into account these 'effects' that exist outside of the market and may call into question the monetary value this thesis provides. Suffice it to state, therefore, that while this thesis seeks to estimate recreational demand on Midmar, the estimation may suffer from a problem of underestimating the TEV, as non-use effects are ignored in the thesis.

S&*
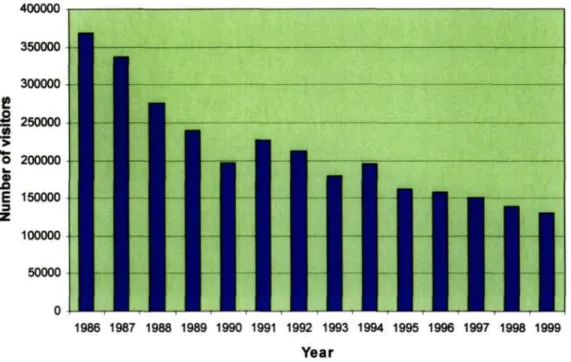
Problem Of Visitor Numbers At Midmar Resort
It is clear from the histogram that there is a downward trend in visitor numbers over the years in question. It seems that the number of visitors in the warmer months (Oct - Feb) is significantly higher than in the colder months (Mar - Sept).
The Travel Cost Method
Garrod et al (1999:7) state that the Travel Cost method is mainly used to estimate the demand or marginal valuation curve for recreational sites. By determining the relationship between the travel cost (explanatory variable) to Midmar and the number of visits per year (dependent variable), the travel cost visit rate function can be identified.
The Zonal Travel Cost Method
TCM is therefore an ideal approach that can be used to assess the demand for recreation in Midmar. This is due to the fact that visitors from other areas have higher travel costs when visiting Midmar. This function can then be used to derive the demand for recreation in Midmar, which in turn can be used to estimate the monetary value of Midmar using the concept of consumer surplus.
The Travel Cost method can be broadly divided into 2 subcategories, namely the Zonal Travel Cost method and the Individual Travel Cost method.
Zonel
- The Individual Travel Cost Method
The simplest form of the Zonal Travel Cost method is based on straight line distances from the recreation area. The Zonal Travel Cost method is usually used at recreational sites where there is no access restriction (ie: there are no entry fees). The Zonal Travel Cost method is ideal for estimating consumer surplus for recreation in places where visitor origins are relatively evenly distributed.
However, from a practical point of view, the implementation of the zonal travel cost method in Midmar can be problematic.
Truncation
Therefore, the OLS estimate may not always be appropriate for the calculation of the individual travel cost method, and its use may sometimes affect the consumer surplus estimate. Some authors (eg, Maddala 1983) indicate that the problem of truncation can be solved by using the maximum-likelihood (ML) estimation method, which corrects the bias that could arise from the OLS estimation. It is important to note that the recognition of truncation and the use of ML estimation (rather than OLS estimation) significantly changes the consumer surplus estimates.
Accepting that the OLS estimation may bias the consumer surplus, a thorough examination of the OLS assumptions and their significance is discussed in chapter 4.
IMPLEMENTATION OF THE TRAVEL COST METHOD AT MIDMAR
- Multiple Purpose Trips
- The Opportunity Of Time
- Homogeneity Of Marginal Costs
- Apportioning The Travelling Costs
- Congestion
The travel cost method typically estimates a trip generation function where the number of visits (dependent variable) is a function of one or more factors (independent/explanatory variables). As travel costs increase, the number of visits (per year) of visitors is expected to decrease. It is also expected that the visitor's income (Y) will affect the number of times a person chooses to visit Midmar.
If Midmar were considered a 'normal' good, an increase in the visitor's income would have a positive effect on the number of visits.
SURVEY RESULTS AND DISCUSSIONS
Testing Of The Different Functional Forms
- Linear Models
In the log-lin model, the slope coefficient measures the constant proportional or relative change in Y for a given absolute change in the value of the regressor. An attractive feature of the double-log model is that the slope coefficient (/?„) measures the elasticity of Y with respect to X. Partial transformation models - Double-log models are sometimes partially transformed by transforming the regressand, and only some of the the regressor(s).
In such a case (where explanatory variables are left as natural numbers), the slope coefficient (/?„) will not measure the elasticity of V with respect to X, but rather will measure the constant proportional or relative change in V for a given absolute change in the value of the regressor.
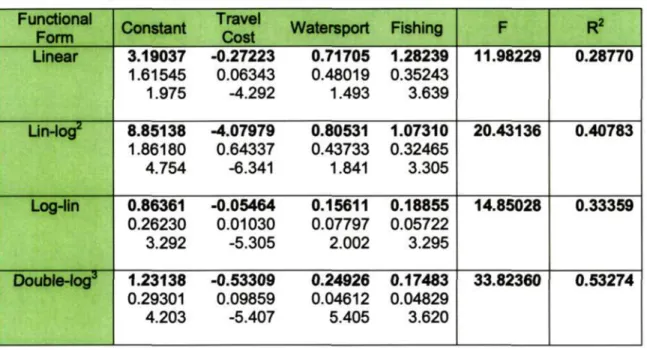
Regression Estimates For Midmar
The linear model explained just under 29 percent of the variation in the number of visits. The log-lin model explained 33 percent of the variation in the number of visits to Midmar. 3 The double-log model was partially transformed with only travel costs transformed by natural logarithms.
This means that 53 percent of the number of Midmar visits made by an individual can be explained by the three explanatory variables considered in the double log model.
Estimation Of The Predicted Number Of Visits
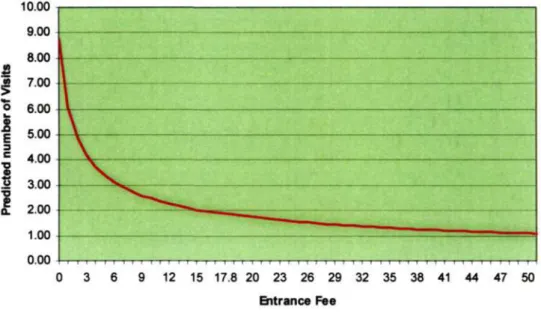
A relationship was established between the estimated number of visits per individual per year and the 'admission fee', which is shown graphically in Figure 4.1 below. It is obvious that there is a negative relationship between the "admission fee" and the number of visits. According to the demand curve, the number of visits per visitor per year will approach 1 as the entrance fee approaches R50.
Similarly, with an entry fee of R1, the number of trips per year will be approximately 8.75 visits.
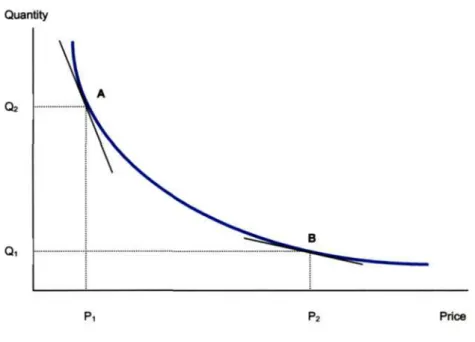
The Elasticity Of Demand At Midmar, 1999
This is due to the change in the slope of the curve, which is fully or completely "compensated" by the change in coordinates. Therefore, in the case of the double logarithm function, the coefficient of the price variable shows the price elasticity of demand. The price elasticity of demand in the case of Midmar measures the proportional change in the number of visits per year due to the proportional change in the entrance fee.
That is, a proportional change in travel costs would lead to a less than proportional change in the number of visits per
Heteroscedasticity
More specifically, while Midmar was a sought-after location for windsurfing (and other water sports) during the second half of the 80s, this consumption pattern faded during the 90s. It could also be argued that, in terms of standard t and F statistical tests, the double-log model was relatively significant. Therefore, an investigation of heteroscedasticity, multicollinearity and serial correlation of the model was undertaken, and this is recorded in the following sections.
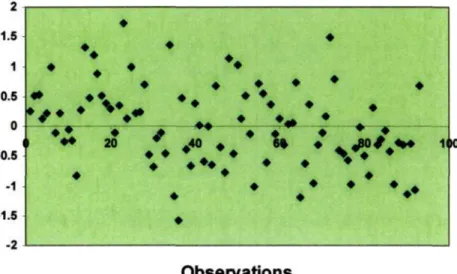
This test involved regressing the square of the residuals u,2 (from the original regression) with the original explanatory variables, the square of the original explanatory variables and the cross products of the regressors in an auxiliary regression, and deriving an auxiliary regression. R2.
Multicollinearity
When comparing the calculated value (13.8012) with the critical value, the null hypothesis that there is no heteroscedasticity was not violated, so the model can be considered homoscedastic. It suggests that the OLS estimators in the double-log model are efficient, unbiased, and consistent. Gujarati (1978) suggests that if a model has traces of multicollinearity, then either by performing ridge regression, transforming the variables, or combining the variables, the problem of multicollinearity can be mitigated.
Fortunately, the double-log model discussed in this thesis is free from the problems of multicollinearity and therefore no transformation was necessary.
Serial Correlation
Perhaps the most successful of all tests is the Durbin Watson d test and therefore, this test was used. The Durbin Watson d statistic was calculated using the following formula which was suggested by Gujarati (1995:421). Calculation of the Durbin Watson d statistic can be found in Appendix 3A of the dissertation.
The calculated d (1.764) and the critical d values obtained from the Durbin Watson tables (for 93 observations and 3 explanatory variables) were compared.
Estimation Of The Demand Function
This means that the null hypothesis of no autocorrelation, positive or negative, cannot be rejected, and consequently the double-log model can be considered free of autocorrelation. This is considered important as the model can now be considered not only unbiased and consistent, but also efficient and that the normal t- and F-tests can be legitimately applied in the results. As previously explained, as the entrance fee approaches R50, visits per person per year approach 1 visit, while the number of visits per person per year approaches 8.75 visits as the entrance fee approaches R1.
The model also predicts that the visitor will make exactly 1 visit if the entrance fee is R59.98 (see Appendix 4A).
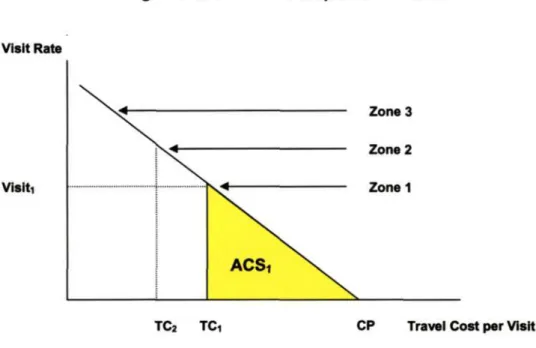
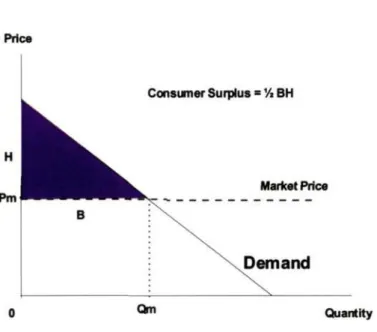
Consumer Surplus
The Hicksian or income-compensated consumer surplus is measured as an area to the left of an individual's compensated or Hicksian demand curve. The calculation of consumer surplus is relatively simple for a linear demand model, while it is more complicated for nonlinear functions. Appendix 5A provides a detailed description of the procedures and calculations for estimating consumer surplus.
This means that the total area between the price levels of R17.81 and R59.98 is consumer surplus for Midmar.
CONCLUSION
In this case, the absence of substitution effects in the model may have overestimated consumer surplus. This would likely affect the consumption surplus of the downstream city, as individuals may be reluctant to spend larger amounts of money on travel. If these non-visitors are included in the sample, estimates of consumer surplus could be significantly reduced.
However, having flagged some of the concerns, it is acceptable that the estimate of consumer surplus derived by the model is still realistic.
ANNEXURES
BIBLIOGRAPHY
C, 1999. The role of price sensitivity and pricing in the demand for