A variety of semi-quantitative techniques were evaluated for their ability to prioritize ethnic taxa in the Flora of Southern Africa (FSA) region. Statistical analyzes of the weighting processes used were not possible in the absence of screening results, which will only be expected in December 2006.
List of tables
EthmedDBM terms (from secondary regression analysis) 124 Table 4.31 Statistics from least squares regression analysis of EthmedIMM orders. EthmedIMM terms obtained by secondary regression analysis 130 Table 4.36 Taxa shortlisted for tuberculosis and corresponding weighted results.
List of abbreviations
Introduction
- Bioprospecting - history and current global overview
- Bioprospecting in the flora of southern Africa
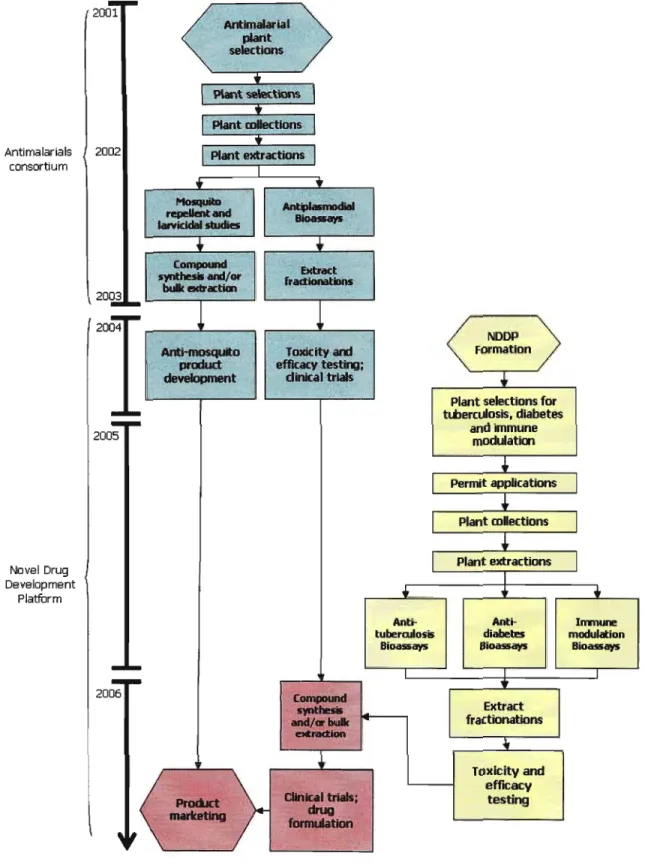
- The Antimalarials Consortium (Figure )
- Plant selection for antimalarial drug development
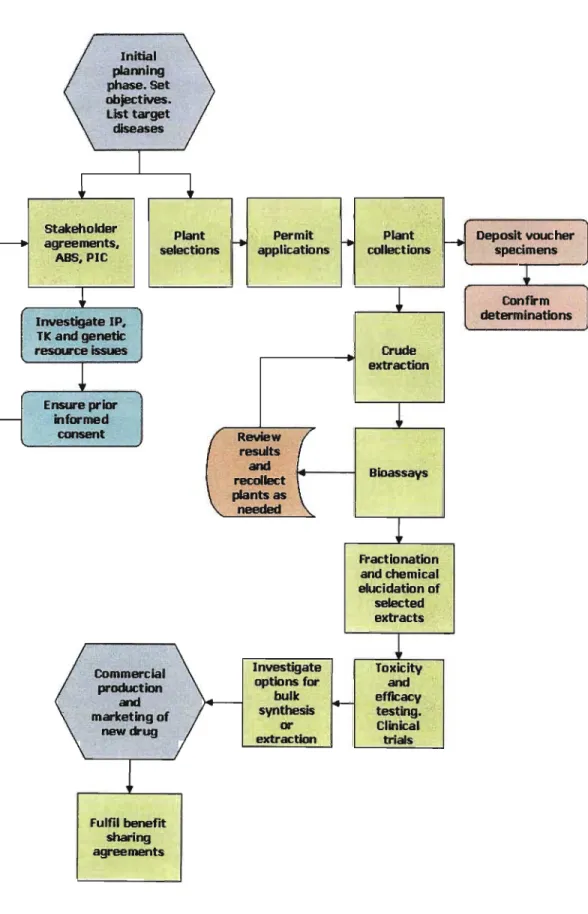
- The Novel Drug Development Platform (Figure 1.3)
- Plant selection by the NDDP
- Approaches to selecting plants for bioprospecting
- Focused plant selection methods
- Chemotaxonomy, phylogeny and the search for novel drugs
- Plant selection in current bioprospecting programmes
- Bioprospecting legislation in South Africa
While there are reports of the creation of successful partnerships (eg investment by Merck .. amp;Company of Rathway, New Jersey and the government of Costa Rica) (Joyce, 1991)/. Noristan Ltd., the only major such company to have existed in the region, closed in the early 1990s after 15 years of bioresearch operations (Laird and Wynberg, 1996).
Prioritisation of ethnomedicinal plants for bioprospecting: a multi-disciplinary
Abstract
Introduction
Analysis of ethnomedicinal taxa in the warm families should therefore be carried out, with a view to identifying the occurrence of similar plant organ characteristics in utilized taxa. A direct comparison of the present results with those presented by Moerman (1991) was not undertaken, due to the very different floras present in the two regions (North America and Southern Africa).

Methods
- Data source and organisation
- Primary regression analyses
- Residual values
- Plotting regression data
- Analysis of families within selected orders
- Secondary regression analyses
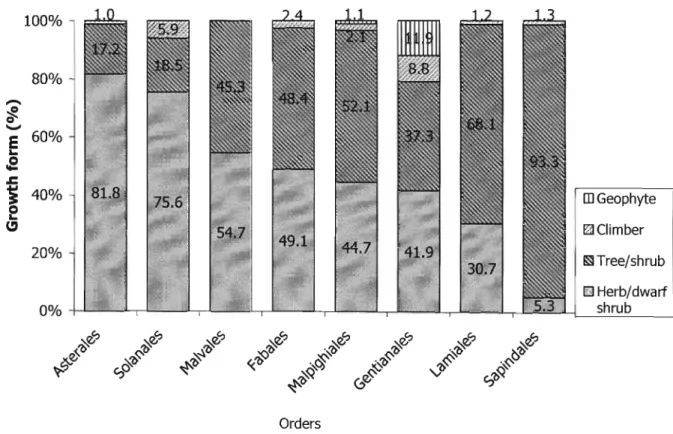
- Analysis of plant growth forms
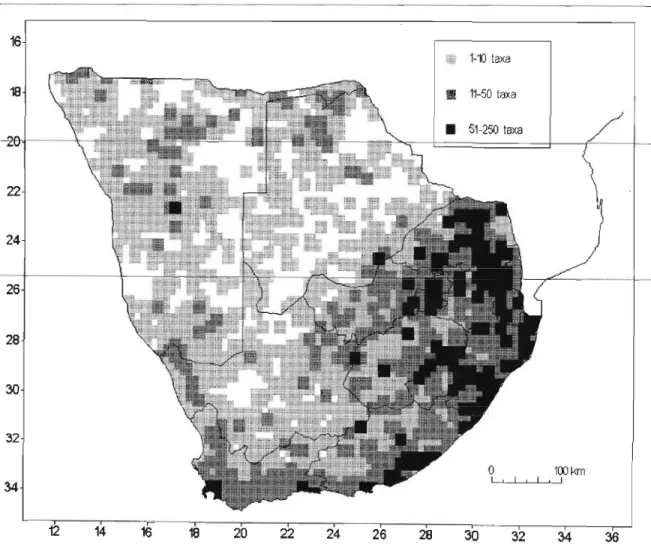
- Regional distribution, endemicity and Red Data List status
- Evaluation of phytochemical trends in 'hot' families
In addition to the above analyses, a survey of plant growth forms was carried out for plants present in the highly selected orders. The number and distribution of native (SANSI, 2005), endemic (Germishuizen et al., . 2006) and naturalized (SANSI, 2005) ethnomedicinal taxa were compiled and presented together with the proportions of Red Data (SASONET, 2003) ethnomedicinal taxa in that.
Results
- Primary regression analyses
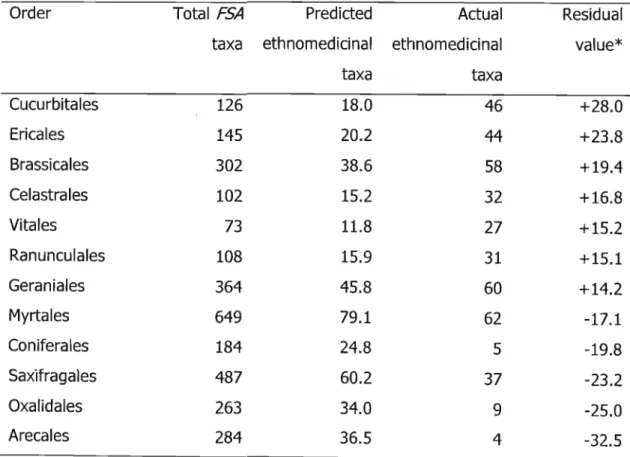
- Residual values
- Plotting regression data
- Analysis of families within selected orders
- Secondary regression analyses
- Analysis of plant growth forms
- Regional distribution, endemicity and Red Data List status
- Evaluation of phytochemical trends in 'hot' families
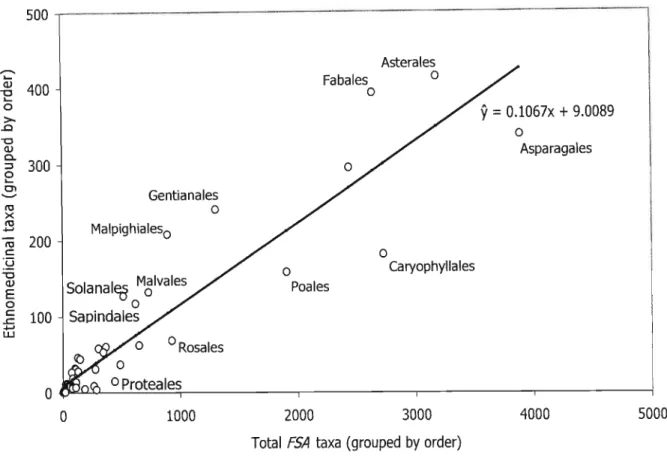
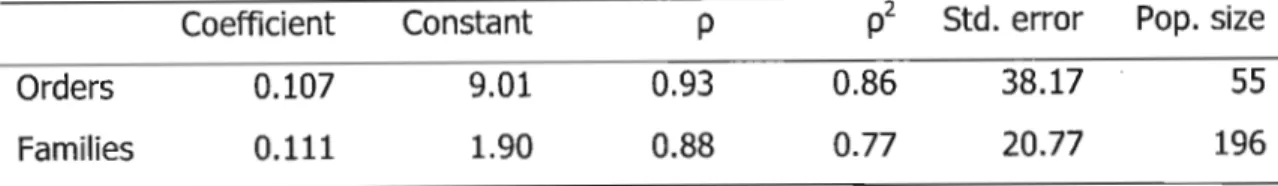
The results show a strong linear relationship (p = 0.96) between ethnomedicinal taxa (grouped by order) and common taxa within those orders (Table 2.10). This is broadly comparable to the taxon composition of the FSA regional flora (Table 2.13) (Germishuizen and Meyer, 2003).
Discussion
- Statistical evaluation
- Growth form
- Regional distribution, endemicity and Red Data List status
- Historical use of ethnomedicinal plants in the FSA
- Phytochemical evaluation
It is possible that the same is true for ethnomedicinal plants in the FSA region. Given the above, it is remarkable that the Asterales have much of their diversity in the West Coast deserts and Fynbos/Renosterveld.
Conclusion
Most alkaloids commonly found in plants as salts of malic, tartaric, citric or other acids act on the nervous system (Kretovish, 1966). Rubiaceae) have been particularly widely researched because of their invaluable role in the treatment of malaria (Warhurst et al., 2003). Terpenoid natural products (Figure 2.9) and their derivatives were the dominant compound class for the Asteraceae and Euphorbiaceae (Table 2.17).
The relative frequency with which compound classes occur in plants probably has a significant bearing on the way in which these plants are traditionally used. Statistical analyzes of ethnomedicinal plant use data are particularly relevant due to the extent of historical and current medicinal plant trade and consumption in the region: direct market trade of medicinal plants and plant-derived drugs is of significant economic value. This more streamlined approach to supporting plant selection has the distinct advantage of basic statistical analysis and the flexibility to include a range of taxonomic levels.
Bioprospecting antimalarials in southern Africa: retrospective analyses of plant
Introduction
The project decided to investigate primarily South African flora in the hope of identifying compounds from which to develop new antimalarial drugs. Project members included CSIR, MRC, SANSI, UCT, UP, all involved in research and development of new antimalarial drugs. Crude plant extracts were tested for in vitro activity against the human pathogen Plasmodium fa/ciparum (chloroquine-sensitive 010 strain) using the parasite lactate dehydrogenase assay (Makler et al., 1993).
The plant selection procedure resulted in more than 50% of plants yielding crude extracts with promising antiplasmodial activity (ICso =:; 10 /lgjml) (Clarkson et al., 2004). Focused plant selection for bioprospecting as used by the Antimalaria Project often includes ethnomedicinal knowledge (Cox, 1990; Fourie et al., 1992; Hamilton, 2004) because of the greater likelihood of finding positive leads. We also asked whether ethnomedicinal practitioners show preference bias towards the use of certain taxa in the treatment of MAFEV-related conditions.
Methods
- Selection of plant candidates
- Primary regression analyses
- Residual values
- Plotting regression data
- Analysis of families within selected orders
- Assessing bioassay results from taxa in 'hot' families
- Secondary regression analyses
Taxa occurring in the malaria endemic region (defined by the MRC) in the FSA were weighted. Taxa were weighted if listed in MedList (SANBI, 2004) and/or in Arnold et al. 2002) as ethnomedicinal in the FSA region. 1 if it is in the families Loganiaceae (Strychnaceae, Gentianaceae, Buddlejaceae), Chenopodiaceae, Rhizophoraceae, Euphorbiaceae, Cyperaceae, Bignoniaceae, Moraceae, Anacardiaceae, Verbenaceae (Avicenniaceae).
A least squares regression analysis was performed, measuring the association between MAFEV plant taxa (grouped by order) (Table 3.1) and the total number of taxa present in those orders in the FSA region. The data therefore includes i) all taxa used to treat MAFEV conditions in the FSA (grouped by order), and ii) the total number of taxa in the FSA (grouped by order). Outlying orders identified in the primary regression analysis were removed from the data set and the analysis was rerun to allow for further partitioning of the data.
Results
- Selection of plant candidates
- Primary regression analyses
- Residual values
- Plotting regression data
- Analysis of families within selected orders
- Assessing bioassay results from taxa in 'hot' families
- Secondary regression analyses
The population variance of the residuals (12.6) was used as a cut-off, leaving eight orders as outliers. A plot of the 43 orders containing MAFEV taxa against the total number of taxa in these orders (Figure 3.2) showed a positive correlation (p). The names of the positive and negative outliers are included on the plot for easy interpretation.
The results of least squares regression analysis of all families containing MAFEV taxa (Table 3.7) indicated that particular families within each order yielded significantly higher residual values. The genera appearing most frequently in the heat families (from Table 3.7) were listed first in order and then alphabetically (Table 3.8). The linear relationship (p = 0.74) (Table 3.10) between MAFEV taxa grouped by order and total taxa in those orders was stronger than the corresponding result obtained before removing outliers.
Discussion
- Keyword associations
- Primary regression analyses
- Secondary regression analyses
When considered in light of the costs of biological research, the need for techniques that prioritize taxa—especially ethnomedicinal taxa. One of the main reasons for including regression analyzes in the evaluation of antimalarial data is the need to understand whether the selection of plants by ethnomedical practitioners in the region is in any way related to current taxonomic constructs. The falsification of the hypothesis, as shown here, points to a higher than predicted ethnomedicinal use of some families; plants in such families are likely to be.
Ethnomedical practitioners are also unlikely to be familiar with the epidemiological basis of many diseases, including malaria (Randrianarivelojosia et al., 2003), and therefore ethnomedical literature is unlikely to reflect bona fide associations between the symptoms of malaria (characterized by cyclical) febrile seizures) and the Plasmodium pathogen. The selection of the taxonomic levels used here was made on the basis of certain published phylogenies (Bowe et al., 2000; Chaw et al., 2000; APG 11, 2003), although different classifications may have produced different results. The use of least squares regression analyzes to compare ethnomedicinally used anti-MAFEV higher taxa (Table 3.5) resulted in a falsification of the null hypothesis.
Conclusion
The secondary regression analyzes (Table 3.10) served to illustrate the potential for identification of additional higher taxa that could be prioritized for bioprospecting. However, the orders identified (Table 3.11) lie closer to the regression line, and as such may not yield candidates with particularly significant efficiency. The . repeating regression analyzes after removing outliers can be undertaken several times, but depending on the variability of the data, the data points will tend to move closer to the regression line.
It is recommended that such assays not be performed beyond the secondary step, as has been demonstrated. 1986). This is accentuated by low hit rates generally associated with such studies; one in 250,000 samples is likely to yield a commercial drug (Macilwain, 1998). The reliability of the methodology will improve with the advent of more detailed phylogenies, making such analyzes even more appealing and beneficial.
Bioprospecting for anti-tuberculosis, anti- diabetes and immune-modulatory plants in
Introduction
The NDDP took forward the development of antimalarial drugs initiated by the Antimalarial Project (Figure 1.3 and Chapter 3) and considered the identification and screening of plant taxa for the development of anti-tuberculosis, anti-diabetes and immune-modulating drugs (Figure 1.3). Following the success of plant selection procedures used in the Antimalaria Project (Clarkson et al., 2004) (> 50% of taxa showed IC50 values of :$ 10 I-Igjml) similar procedures were used in the new program. These modifications included the incorporation of regression analysis techniques (Figure 2.1) (after Moerman, . 1991) which allowed for additional weighting of 'hot' orders and families, Le.
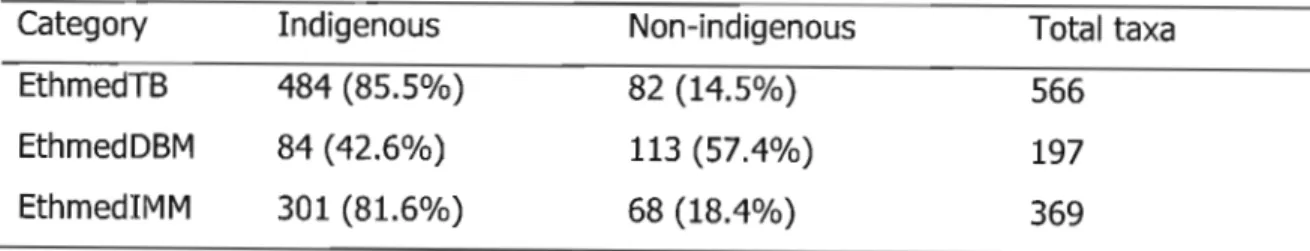
The use of mainly ethnomedicinal data for shortlisted plants in cluster 1 (Figure 4.2) was considered a limitation due to the significant bias that ethnomedicine recorded. This inconsistent use of indigenous plants in the FSA region (Figure 2.10) is most likely due to the skewed historical settlement of the Bantu tribes on the wetter and more fertile east coast (Figure 2.12). In addition, the many plants in South Africa that are becoming endangered (Van Wyk and Smith, 2001; . Golding, 2002), highlight the urgency with which taxa in the region must be assessed.
Plant Drug
Technology
Research and development progress
Research and development costs
Methods
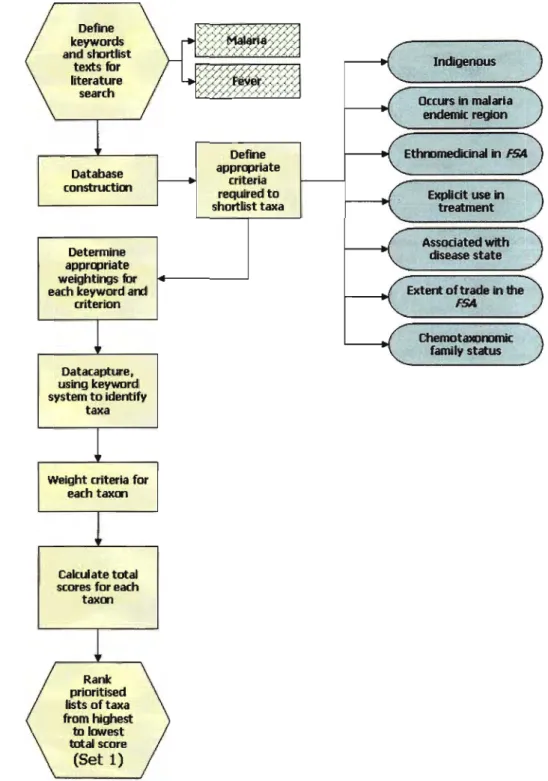
- Generation of an ethnodirected plant candidate list (Set 1)
- Keywords (Column N)
- Taxon names (Column B)
- Family (Column C)
- Indigenous status of taxa (Column D)
- Endemic status of taxa (Column E)
- Explicit use of taxa for disease treatment (Column G)
- Documented positive or negative associations (Column H)
- Toxicity of recorded taxa (Column I)
- Red Data Listed taxa in the FSA region (Column l)
- Plant taxa traded in regional markets (Column K)
- Taxa in families with biological activity of interest (Column L)
- Taxa in 'hot' ethnomedicinal families (Column M)
- Total score (Column 0)
- Rank Number (Column A)
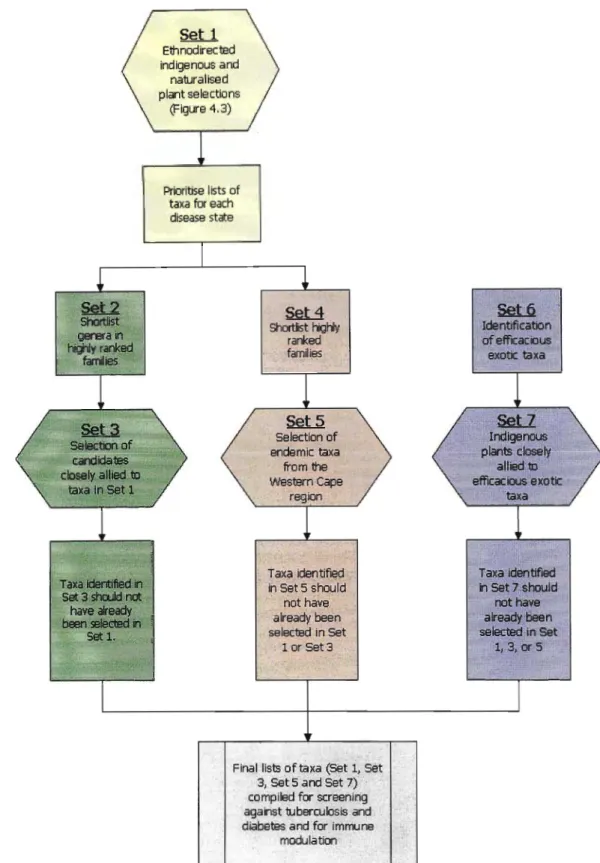
- Candidates allied to high ranking plants (Set 3)
- Endemic taxa from the Western Cape subregion (Set 5)
- Candidate taxa related to efficacious exotics (Set 7)
- Selection of randomly identified control taxa
- Proposed statistical evaluation of plant selection methods
- Normalise the distribution of initial screening results
- Correlate IC 50 and total score
- Evaluate focused and random plant selection
Inflammation of the nose and throat with increased production of mucus Any ailment in the chest. Disease of the small blood vessels in the retina that can cause vision impairment. Irritation of the cutaneous tissue causes a desire to scratch Ability of the joint to move.
Taxa were weighted by family (Table 4.2) according to the results of least squares regression analyzes (Figure 2.1). Statistical analyzes of the plant selection methods were not performed due to the lack of initial bioassay results. Probability plots of screening results versus each of the (now-binary) selection criteria should be prepared and the one-sample Kolmogarov Smirnov statistical test used to assess the distribution of the screening results (the Lilliliefors test option is incorporated to obtain a standard normal distribution).
Results
- Ethnodirected plant candidates (Set 1)
- Taxa in ethnomedicinally 'hot' families
The residual values dictated the extent to which the predicted number of EthmedTB taxa differed from the actual number of taxa in each family (Table 4.23). After the above analyzes were completed, outlying orders and families were removed from the data sets and a secondary regression analysis was performed (Table 4.24). This value was used as a cutoff, resulting in nine new orders (Table 4.25) being identified as outliers (five positive and four negative).
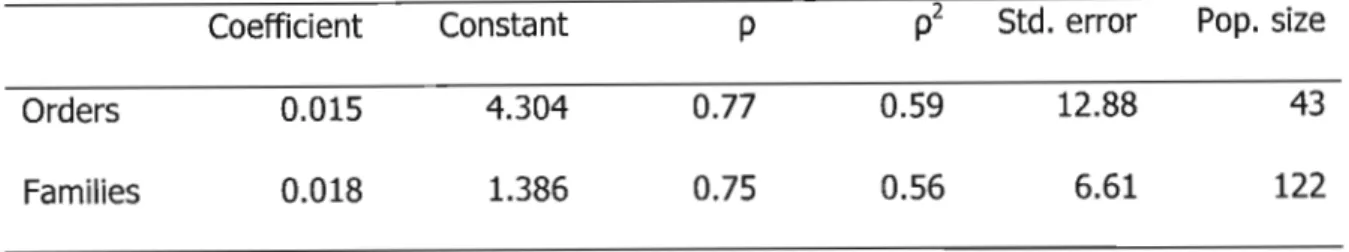
The model obtained from the regression analysis of plant orders (Table 4.26) was able to explain 59% (p2 = 0.59) of the variation in the y-values. Following the above analyses, outlying orders were removed from the data sets and a secondary regression analysis was performed (Table 4.29). This value was used as a cutoff value, resulting in a further eight orders (Table 4.30) being identified as outliers (five positive and three negative).
After completing the above analyses, outliers were removed from the data set and a secondary regression analysis was performed (Table 4.34). This value was used as a cutoff, which resulted in a further eight orders (Table 4.35) being identified as outliers (four positive and four negative).