Managing the transport used by travelers in developing countries has become more problematic especially in large metropolitan areas. Little research has been conducted in South Africa on minibus taxi management, service improvement and taxi routing.
Basis for minibus taxi and public transport in South Africa
According to (Sohail, Maunder and Miles (2004)), urban public transport is a key link to access other services and livelihood assets. The majority of public transport users in urban areas use transport to go to work and to access other services such as shops and schools.
Current public transportation system in Pretoria
Public transport began to grow, carrying more commuters each year from the late 1970s until now, developing into a critical industry in South Africa's economy. Most urban users of public transportation complain about its availability, cost, quality, and its safety (Sohial, Maunder, & Miles, 2004).
Minibus-taxi performance
The minibus-taxi industry started operating in the late 1970s to meet the demands of passengers for transportation. Most passengers who use taxis work between 7:30 and 16:00, early morning and late afternoon, so they are the busiest times.
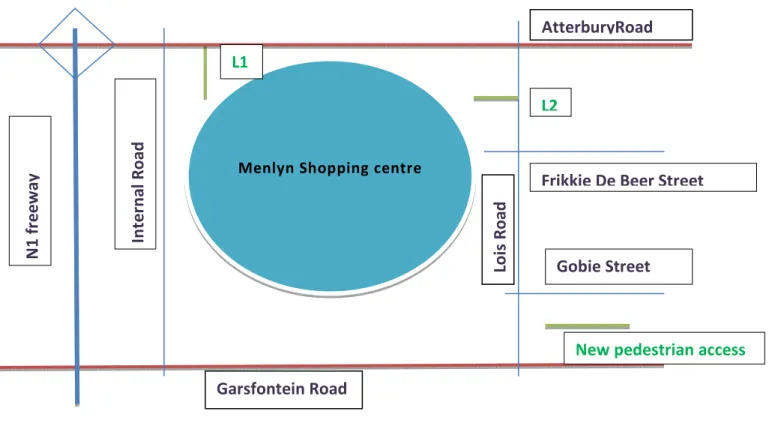
Background of Menyln Taxi Association
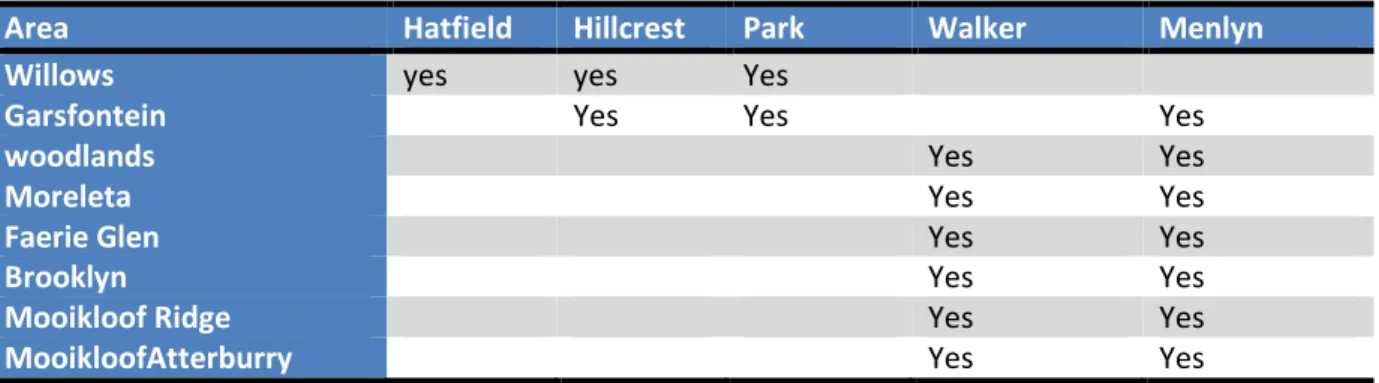
Present state
Most of the time seven destinations are loaded, but Mooikloofridge is loaded when there are many commuters going to that destination. If one of the seven taxis is full, the next passenger to come goes to taxi number eight in line.
Project outline
- Project aim
- Project objectives
- Project scope
- Project research questions
- Project deliverables
Other factors to consider are: what is the capacity of the taxi and how routes are linked. Finally, how does entering many destination points affect taxi lead time and passenger travel time.
Summary
For the second loading option, they must wait for the taxi to be full before driving to their destination. Drivers who choose loading option three need to know which route is occupied at which time of day.
Problem Identification
Loading and clustering commuters
Managing minibus-taxi
Type of public transport and how they functions
Bus Rapid transport [BRT]
Buses and all other roads bounded by public transport are dedicated colored lanes in the area to reduce delays and lack of public transport during peak hours when there are traffic jams. To make public transport more accessible to passengers using all modes of transport and also to avoid walking long distances to the stations/lines.
History of Third World cities
Color coding of all modes of transport depending on the type of service they provide and the routes they use to make transport easier to access by all types of passengers even those who are illiterate. An integrated public transport facility at the stations are all modes of public transport will be at the service of the public with the purchase of tickets at the entrance and a closed system with free transfer between the corridors of all modes of transport.
Managing traffic to gain less cycle time
Bus and taxi service
Control and supervision of bus services
Telecommunications - the greater emphasis given to the improvement of the telecommunications system can be expected to bring significant benefits to urban transport. Third, many high-tech transportation systems such as area traffic control and surveillance use telecommunication networks for data transmission (Armstrong-Wright, 1993).
Taiwan
History for Taiwan
Second, poor telephone systems tend to inhibit balanced land use, as in the case of Caracas, where bad congestion is partly due to the concentration of offices in the city center due to the widespread practice of relaying messages by carrier rather than by telephone . The general vehicle scheduling problems are problems in which a number of vehicles starting from one or more ranks must jointly visit a number of demand points and then return to the rank from which they started (Ali, Mohauzadreza, & Kun-Hung, 2003). .
Current state
The model
Lisbon Metropolitan Area
An initial phase assessed the behavior of potential users in the study area, using a decision tree model to estimate travelers' willingness to use new service. The phase was based on characteristics of their current travel chain configuration and lifestyle designated as demand estimates. The second phase calculates the potential location of the system's stops based on the estimated potential demand from the various locations in the study and demand periods designated as stops.
In the third stage, the model estimated the potential demand of each link between the defined minibus stops and set the system potential O/D matrix referred to as Minibus Link Load Estimation. In the first phase, the main variables were identified that could have a greater influence on the willingness to switch to this new service [number of daily journeys, possession of a public pass, daily distance, car availability, daily activity time and the al then no existence of a subway commute], a simplified Delphos method was used in the second phase to estimate the weight each selected attribute would have in the choice.
Introduction
Type of study
Participant responses are very important because they show how the industry works and also provide public opinion on the minibus taxi industry.
Data collection and Type of data
Primary research
Secondary research
Data collection methods and research tools
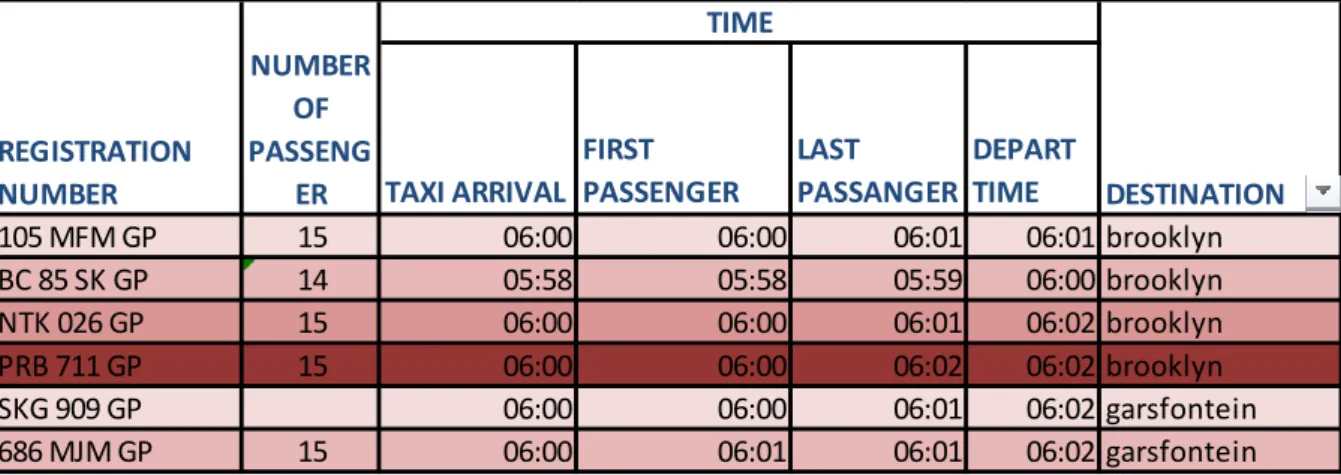
The second type of data sheet is called data form 2, it was used to collect information to show the distribution of passengers from the country of origin to the destination, which contains the following information. Number of passengers with whom the driver started, Number of passengers inside the taxi in the middle,. Number of passengers joining the taxi between the origin and the midpoint Number of passengers joining the taxi after the midpoint.
Comment information is important because more detailed information can be extracted, for example if a driver turns on the road because he/she had no passengers in the taxi. Number of passengers minibus taxi departed with, Number of passengers transferred to other minibus taxis, Minibus taxi departure time.
Data process
Summary
Introduction
Findings obtain during data collection
Information from data table 1
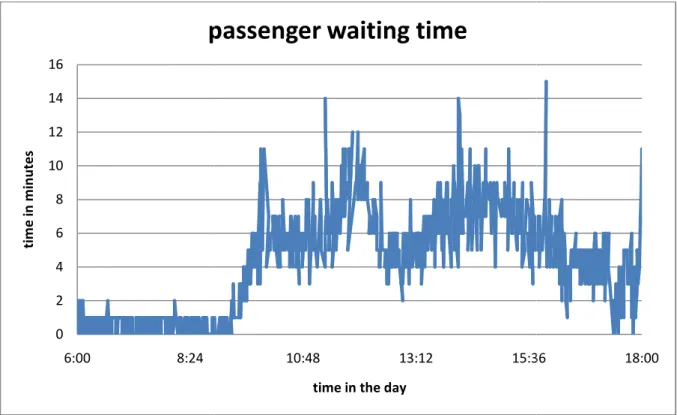
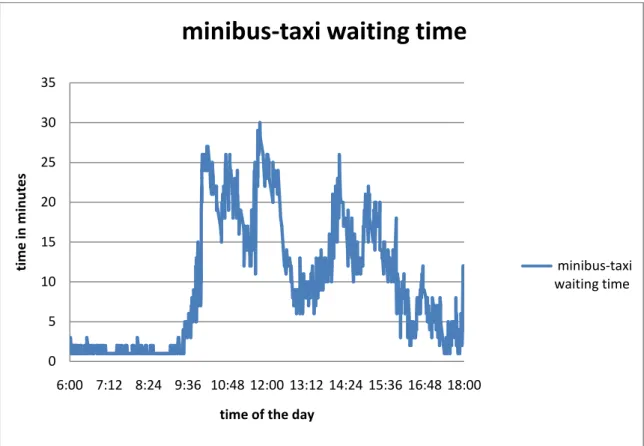
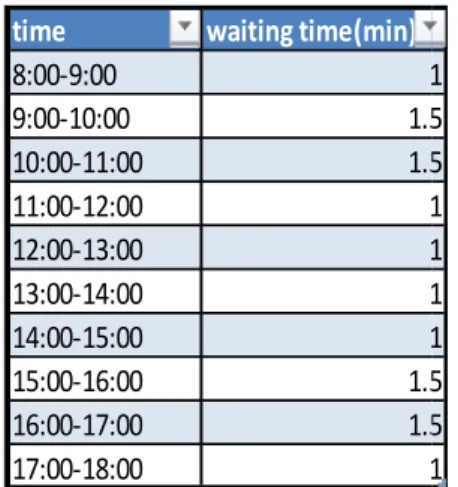
- Passenger waiting time
The waiting time between 06:00-09:00 is very short, because a large number of commuters who are in order to be loaded. The number of commuters carried each hour differs from the next due to the capacity of the vehicles and the speed at which commuters arrive at the rank. The number of commuters carried each hour differs from the next due to vehicle capacity and which commuters come to the rank.
The number of commuters transported each hour differs from the following due to vehicle capacity and. The same number of taxis were used on Tuesday and Wednesday, and in figure Lforsame used, but different numbers of passengers were carried.
Information from data table 2
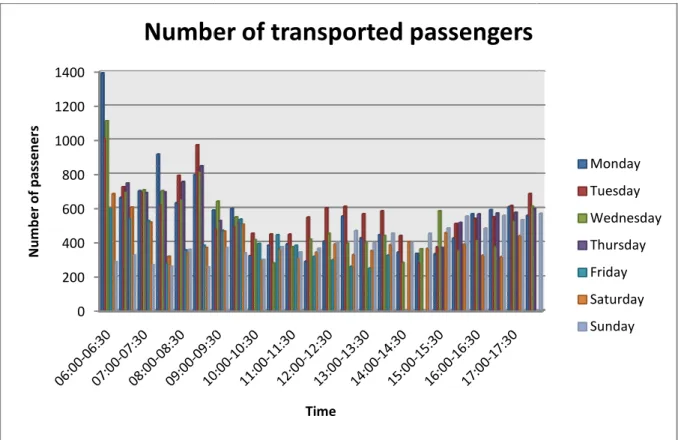
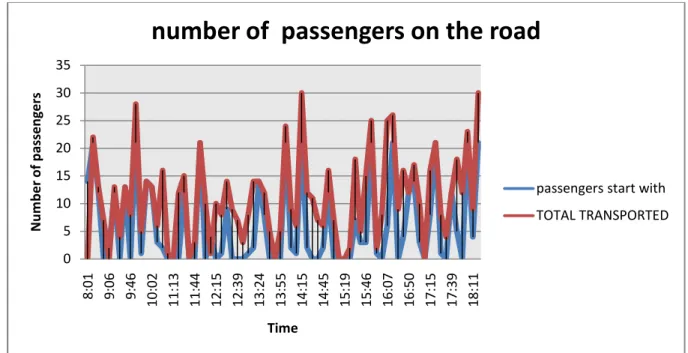
Number of passengers in the road varies from time to time; sometimes the driver can drive from origin to destination without having any passenger in the taxi. So the driver must be strategic to know which areas have passengers around which time of day. Figure Below shows the number of passengers picked up by taxis and the number of passengers the taxi starts with to the destination. Figure 2. The blue line shows the starting number of passengers and the red shows the total number of passengers transported when the taxi arrives at the destination.
A negative area indicates that it started with no passengers or less than the number of passengers. A negative area indicates that it started with no passengers or less than the number of passengers that were released.
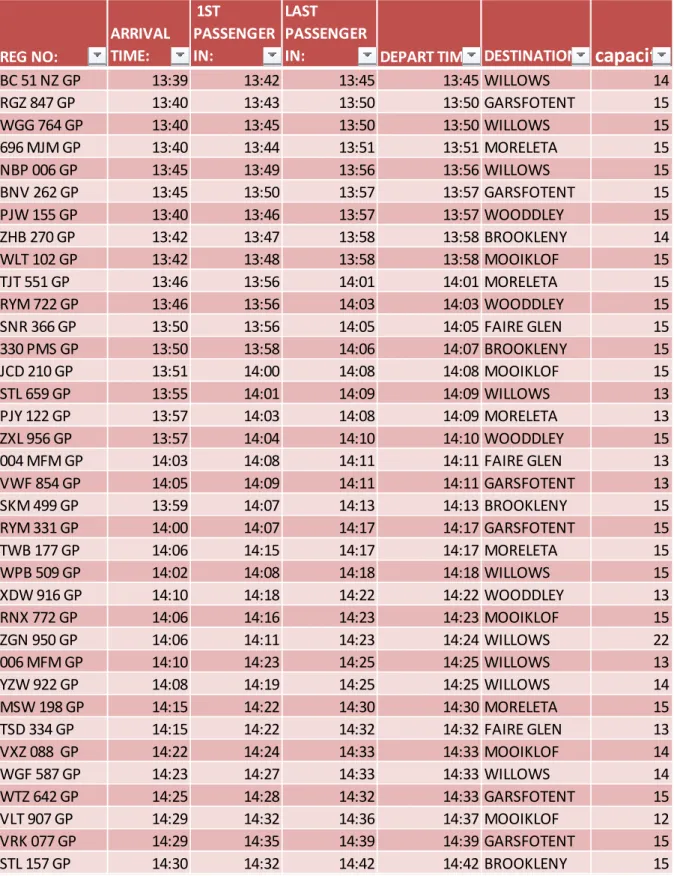
Information from data form 3
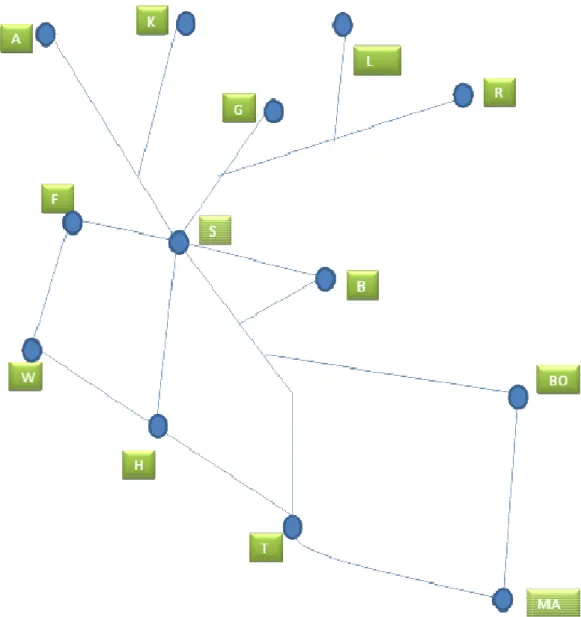
The number of taxis arriving at interchange points varies from hour to hour due to the number of passengers available to transport (point or out. The number of taxis that live at interchange points go to different destinations, which are Bosman, the city which is Pretoria Central and Marabasad The number of passengers at the interchange point go to different destinations the passengers going to each destination differ to the other destination.
The number of passengers at the interchange point goes to different destinations, the percentage of passengers going to each destination differs from the other destination. W below shows the number of passengers transported to different destinations and how many passengers go to each destination per hour.
Summary
Introduction
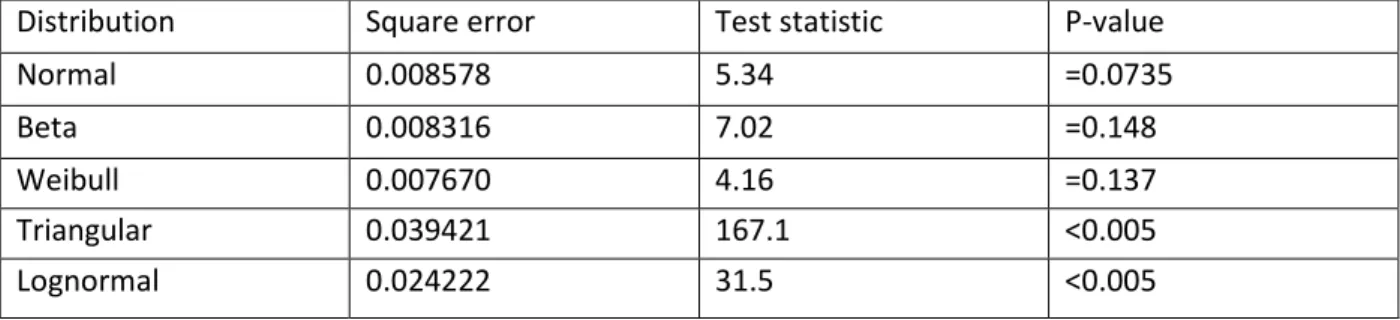
Input analyser
The results from Table L show that the best result when comparing the distribution fits in the table is the Weibull distribution with an error squared of 0.004119, a test statistic of 14.1, and a P-value of .0241. In the first part, the distribution has a beta distribution fit, and the second part, which is the afternoon, has a triangular distribution fit. To increase the utilization of excess taxi capacity during off-peak hours, taxis in the tourism sector can.
The Menlyn Taxi Association is around the Union Building and in the center of the capital of South Africa where tourists always come. Using taxis during the day will increase the productivity of both taxi companies and drivers in the taxi industry. Good communication with the taxi industry, especially the association and official in the transport department.
Study to be done in total time taxis are not used in the ranks. More information should be collected in sub-ranges.
Results
Introduction
Taxi improvement and development of a better public transport in South Africa still needs to be developed to reach the best public transport in the world class. Survey can be given to passengers to help with information or possible way to improve the public transportation system. Information about rank capacity must be added in the research because it affects the use and utilization by changing the arrival time shown in the data form.
Information on ranks and sub-ranks must be obtained at a time so that taxis can be tracked from one station to another. Public transport is growing in South Africa mainly in the large metropolitan area, due to the effect of urbanization.
Future work
Recommendations
Conclusion
The purpose of this project is to investigate the effect of the passenger grouping model on customer travel time, taxi utilization level, taxi cycle time and customer waiting time. Data can be used to improve the current state of the Menlyn Taxi Association, but future project can be undertaken for research in areas not covered that can be used to improve and simulate the taxi system.