This work was possible thanks to the efforts of the entire CBASS team and the hands of members of the Astrophysics and Cosmology Research Unit of this university, in particular Dr. This thesis describes the characterization of the primary reflector using photogrammetry, a non-contact technique that uses photographs to determine the exact position of the panels that make up the mirror surface.
The Cosmic Microwave Background
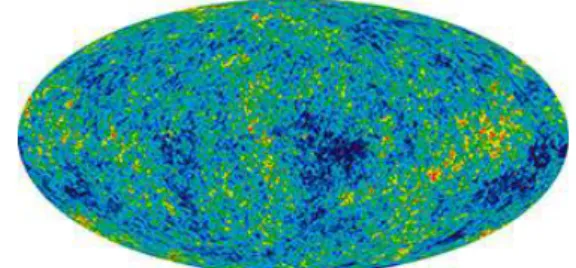
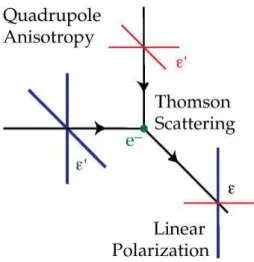
This discovery proved that the Big Bang was the preferred model for the origin of the universe. Since hot or cold incoming radiation shown in figure (1.3) interacts with a free electron by Thomson scattering, the scattered radiation will be perpendicularly polarized to the direction of the incident radiation.
Foregrounds
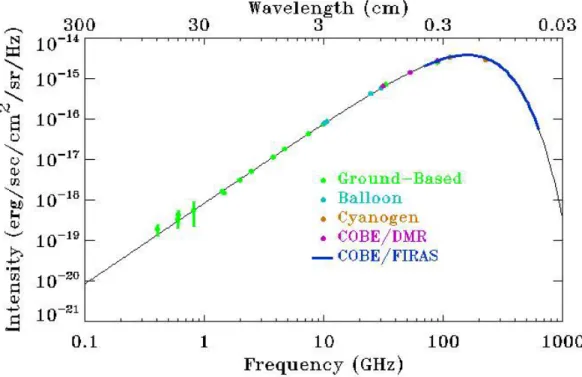
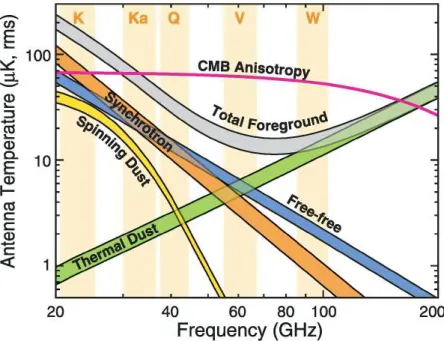
These accelerated electrons emit photons whose energy depends on the magnetic field and the energy of the electron itself. Synchrotron radiation comprises most of the observed galactic radiation at low frequencies, as shown in Figure (1.5)a.
CBASS Science Goals
A strong correlation was observed between the distribution of excess emission and Astronomical Infrared Satellite 100µm maps of far-infrared dust emission, indicating that the 'strange' emission was associated with dust [16] . The AME spectrum is most prominent between 10 GHz - 100 GHz as shown in figure (1.5)a, and rotating dust is a proposed mechanism to explain this emission. It has been proposed that the emission may arise from the electric dipole due to the internal dipole moment of the molecules and the uneven charge distribution of small rapidly rotating dust particles [17].
CBASS's 5 GHz survey is high enough not to be affected by Faraday's rotation, but low enough to map the synchrotron emission from our Milky Way. Foregrounds are highly relevant to CMB experiments and CBASS will produce synchrotron maps of the entire sky. CBASS is unable to detect CMB photons due to its lower operating frequency, as the CMB peaks at ~300 GHz, but the full-sky synchrotron radiance maps will be useful for accurately subtracting the galactic synchrotron emission from B-mode polarimetry studies.
The telescopes received by the CBASS team were without detailed diagrams and documentation, leaving the instrument's optics unknown.
The CBASS Instruments
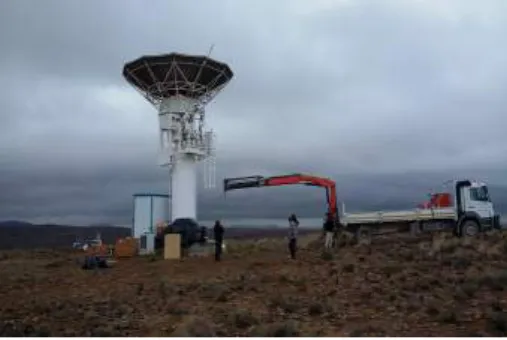
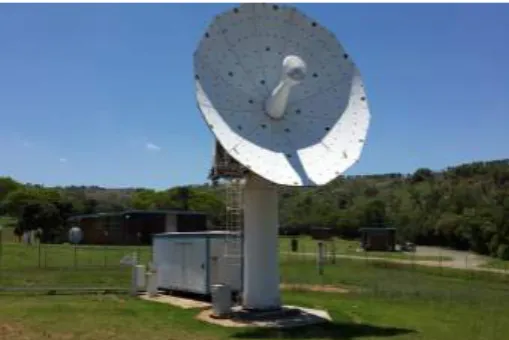
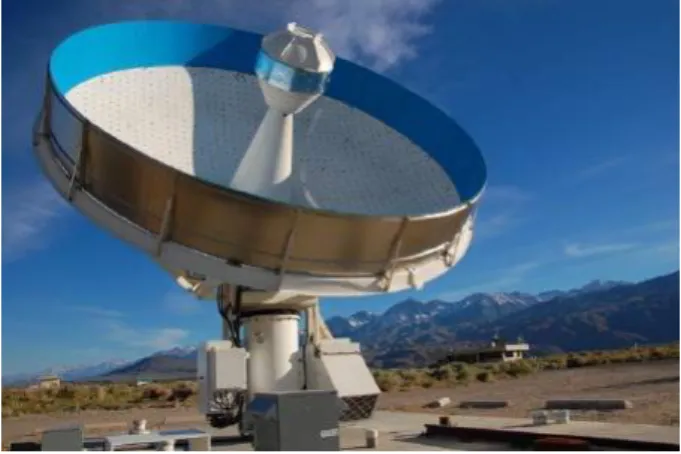
The telescope was donated by the Jet Propulsion Laboratory and developed by the CBASS imaging team. Metal absorbing baffles are mounted around the primary reflector, as shown in Figure (2.1), which minimizes the spillover of incoming radiation to earth. Circularly symmetrical 7.6m low Earth orbit communications telescopes were donated to the CBASS team by Telkom SA SOC Limited.
The first telescope was moved from the Telkom site to the Hartebeesthoek Radio Astronomy Observatory (HartRAO), Gauteng, South Africa for receiver commissioning as shown in Figure (2.2)a. The second telescope was moved to the MeerKAT support base in Klerefontein, Northern Cape Province and the receiver was recommissioned in May 2014, which served as the observing telescope for CBASS-S as shown in figure (2.2)b. The southern system is a continuous comparator radiometer receiver that removes the effect of gain changes in the amplifiers from the system.
In the continuous comparison radiometer, the air signal is referred to a stabilized load in the signal chain with a 180◦ hybrid.
Close Range Photogrammetry
Camera Calibration
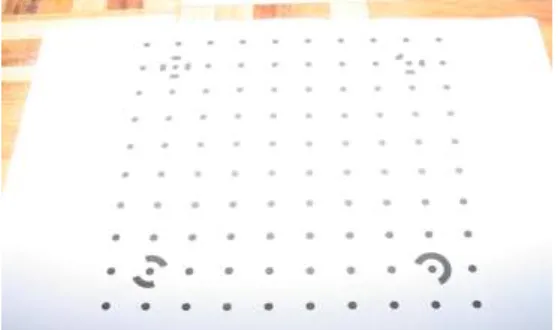
Photogrammetry Targets
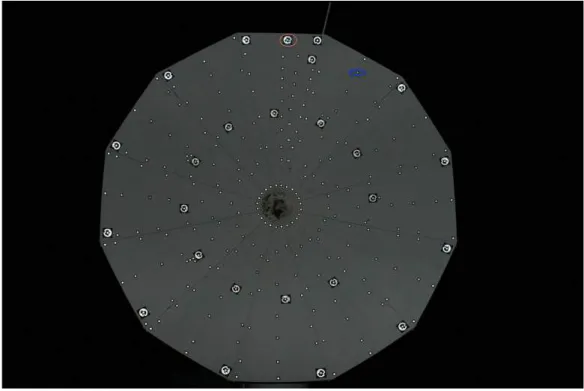
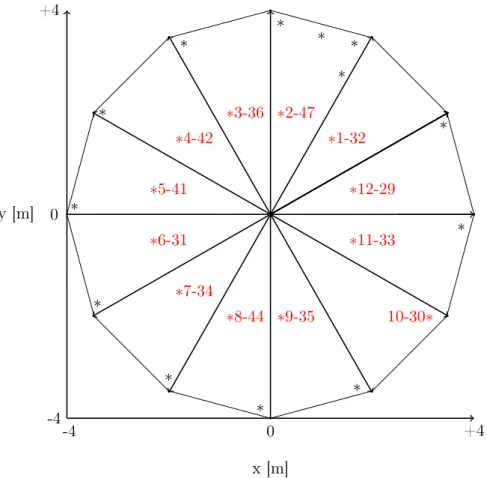
The positions of all geometrically coded targets in the primary reflector are indicated by the black and red stars in figure (2.5). The red stars in the figure are used to identify the panel with the label; the panel number to the left of the dash and the target ID to the right of the dash. It is very important that we scale our project in PhotoModeler to match the dimension of the primary reflector.
The two-point method measures the distance between two selected points in a panel, while the three-point method measures the positions (in degrees) of three selected points in a panel. Two coded targets in Panel 9 were selected and a tape measure was used to measure the distance between them. We have always used the three-point method for our scaling and cross-checked with the two-point approach for all photogrammetry measurements.
The targets used for the three-point scaling are marked as blue asterisks on panel 2 in Figure (2.6) and their positions are shown in Table (2.2).
Photographing of the Primary Reflector
The processing of primary reflector photographs in PhotoModeler is referred to as reduced photogrammetry. Geometrically coded targets on the primary reflector are easily recognized by PhotoModeler through a least-squares fitting approach, and uncoded circular target positions are determined by the central fitting. The data from PhotoModeler is a seven-column dataset showing the ID numbers of the targets, the 3D positions of the points, and their corresponding errors.
Surface Function Measurement
Specification for CBASS
The panels comprising the primary reflector were removed separately at Telkom's site and transported to Klerenfontein. The panels were then assembled to form the primary reflector of the observation telescope, as shown in Figure (3.1). Photogrammetry was performed to determine panel misalignments (deviation from the modeled shape as described in equation (2.1)).
This chapter describes the techniques used to obtain the modeled shape and surface profile of the primary reflector. a) Assembly of all panels in the primary reflector.
Analysis of the Primary Reflector Surface
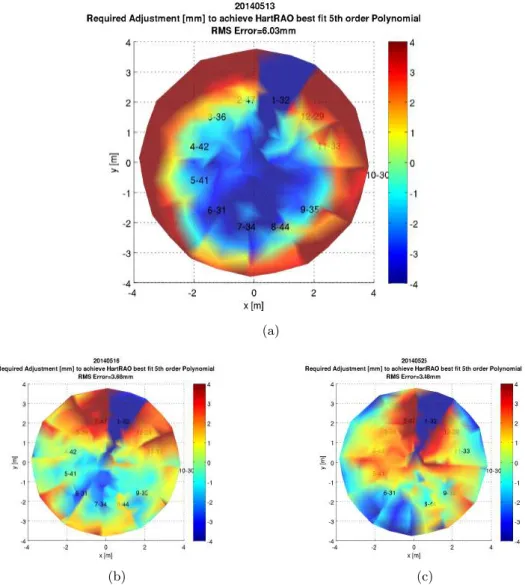
As shown in figure (3.3)a, the deep blue color of panel 1 shows that a lowering of the panel is required. 85◦ and panel iteration was performed between them, which improved the panel alignments as indicated by the minimal decrease in RMS error as shown in Figure (3.5). a) Surface profile of the primary reflector after iterating panels with data from figure (3.4)e. After panel iteration with data from Figure (3.5)e, panel 7 position improved, but panel 1, 11 and 12 position worsened at the edges, leading to a 0.02 mm improvement in RMS.
The panel positions and RMS error did not change from Figure (3.5)b, which shows that the panel positions were unaffected by ambient conditions (wind, rain and temperature). The effect of lifting the reference panel was seen as deep blue in Figure (3.7)c and contributed to a further increase in RMS error. With strong wind and heavy rain, we repeated only some of the bolts on a few panels that were largely misaligned in Figure (3.8)a, and the result is shown in Figure (3.8)b. a) The surface of the primary reflector after iteration was done by eye.
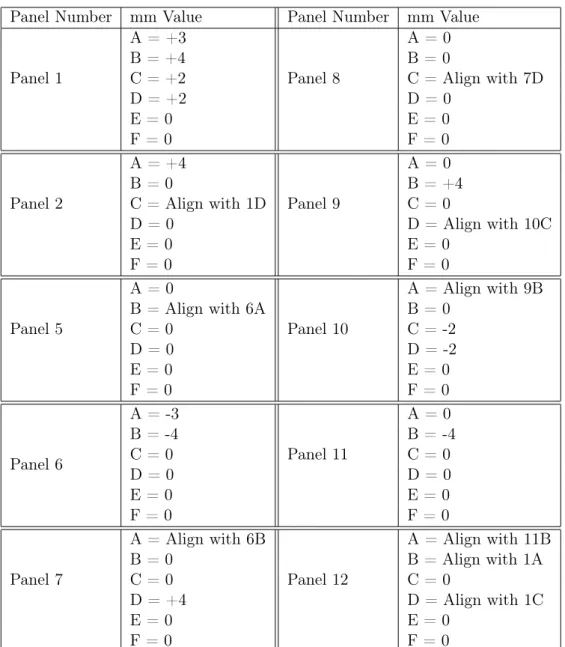
The adjustment values made on some bolts (bolt positions shown in figure (3.9)) of some of the panels are shown in table (3.1).
Separation of Overlapping Panels
Automating the Iteration Procedure
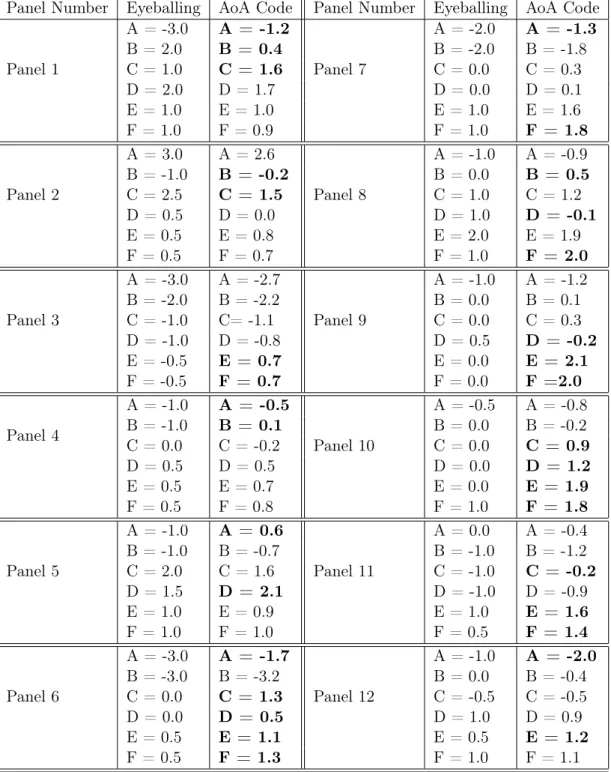
A graph of the adjustment values predicted by the AoA code and the adjustments made by eyeballing for the measurement of June 21, 2014 in Figure (3.10)a. The adjustment values are more skewed towards that predicted by the AoA code and therefore indicate the human error associated with adjusting panels of the primary reflector by 'watching' adjustment values from the color bar.
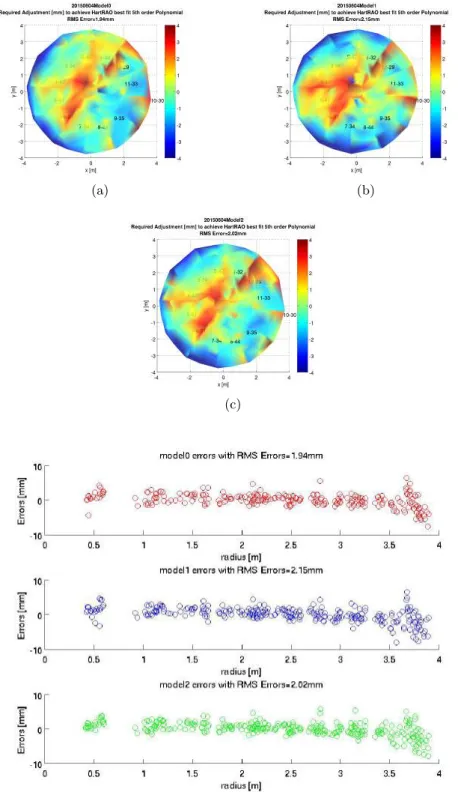
Primary Surface Analysis using Different Photographs
These deviations are the required adjustment values in different panels to achieve the desired shape described in equation (2.1). The RMS errors varied by a maximum of ~0.2 mm which is comparable to the result in Figure (3.4). There are slight variations (within 0.5 m and 3.5 to 4 m radii) in the required adjustment values proposed by each of the models as shown in Figure (3.11)d.
In future measurements, we will take multiple photogrammetry measurements at a single height on the same day and compare the results so that we can quantify whether the error is due to our measurements or systematics. Possible systematics that can cause panel misalignments are fractional number of bolt turns that are difficult to achieve (eg 0.6 bolt turns) and inaccurate directional turning of bolts resulting in inaccurate lowering or lifting of panels. In future measurements, we will generate color profiles using different photographs and quantifying the source of the errors due to different models will help identify which model is best for panel iteration.
November 2015
In the future, more panel iterations will be made to achieve the desired RMS error of 0.5 mm.
Summary of all Photogrammetry Measurements
The primary reflector is currently in a state described in Figure (3.12)c with average panel deflections of 2.46 mm. Average panel deviations of 0.5 mm were unattainable because only a few panels were repeated after overlapping panels were split. Iterating just a few panels was mainly to test the accuracy of the AoA code.
The AoA code was good and accounted for the sharp drop in panel mean deviations for the nighttime 25 November - 26 November 2015 measurements shown in Table (3.5) even though only a few panels were considered. In the future, all primary reflector surface profile analysis will be done using the AoA code and all twelve panels of the primary reflector will be iterated to quickly achieve 0.5mm RMS.
General Reflector Antenna Software Package simu- lations of the Primary Reflector
GRASP took into account the blockage caused by the sub-reflector, which affects the shape of the main light beam and the inner side beam, and the forward gain. The GRASP model also accounted for subreflector blocking with the primary, giving a low rear reflector. The first sidelobe is highly asymmetric, with an amplitude of -15 dB relative to the peak, compared to -21 dB in the ideal case.
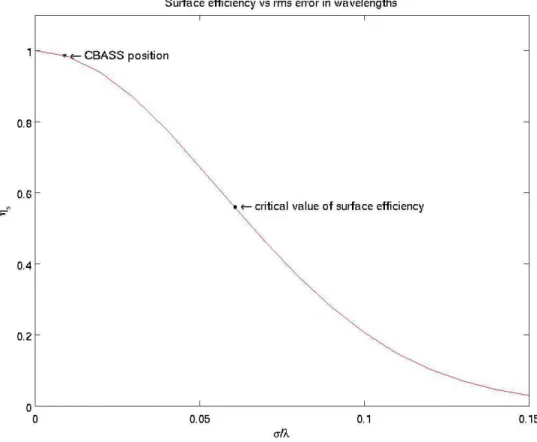
In Figure (3.14)b, the deviation from the ideal performance ranges approximately logarithmically with respect to surface distortions; forward gain loss is 0.6 dB (ηs of 0.87) for half-scale errors and 0.3 dB (ηs of 0.92) for quarter-scale errors. a) Solid line: Ideal beam pattern.
Future Outlook of CBASS Southern System
Air temperature and pressure and relative humidity charts generally indicate a darkening of the atmosphere. Water vapor and raindrops increase the thickness of the ionosphere and reduce the intensity of incoming signals from the sky. CBASS sky-diving scans are observations used in the study of atmospheric transparency, and data from these scans can be cross-referenced with weather data in these plots for compatibility.
High winds affect telescope pointing and the purpose for which the wind speed diagram is placed below the errors in the az/el scan diagram in Plate 14 for quick reference. The plot of Az/el versus time in panel 13 of Figure (3.15) shows a scanning strategy such as telescope raster scans during observation. The author of this dissertation showed that weather conditions such as wind, rain and heat at the site do not affect the alignment of the plates of the CBASS-S primary reflector.
These twenty-hour time plots of various parameters in the system will help to quickly monitor the telescope's performance.