The Mvula Trust is a leading South African NGO in the water and sanitation sector. The manual all consists of four components. The main focus of the model is on the financial viability and sustainability of the water supply.
Study Objectives and Activities
A questionnaire was developed to facilitate pilot data collection in 10 existing, self-contained communities managing water supplies, with assistance from Mvula Trust, a leading non-governmental organization in the KwaZuluNatal province of South Africa. An algorithm coded into a computer program is developed that can be used in calculating the monthly fees to be paid depending on the needs of the individual communities.
Chapter Two
Information in developing countries
This lack of information reduces the ability of water managers in developing countries to make informed decisions (Kibata, 1996). On the other hand, while the exchange of information among developing countries is low, the most practical solutions to water and environmental hygiene challenges are to be found among developing countries themselves.
Promising Solutions
The lack of sufficient capacity to draft or enforce regulations in developing countries makes this difficult. This is especially the case where inexperienced developing countries negotiate long-term contracts with highly experienced foreign companies.
The Demand - Responsive approach
Operating and maintenance costs of various water supply facilities in rural areas (excl. caretaker allowance/salary) (1990 prices). The efficient operation of a local water supply depends on the competence of the water committee, which is elected from the local community.
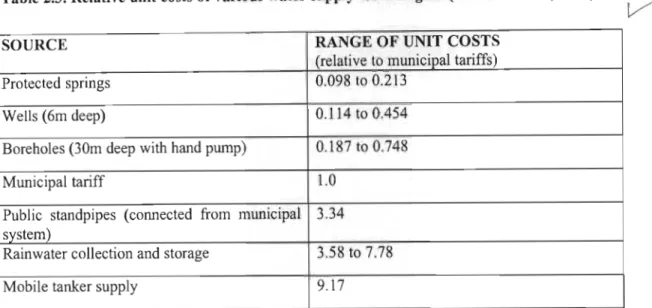
Relative water costs
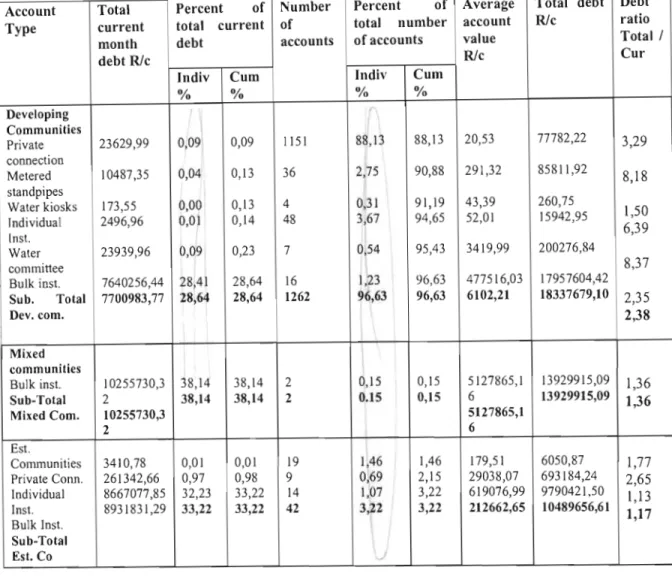
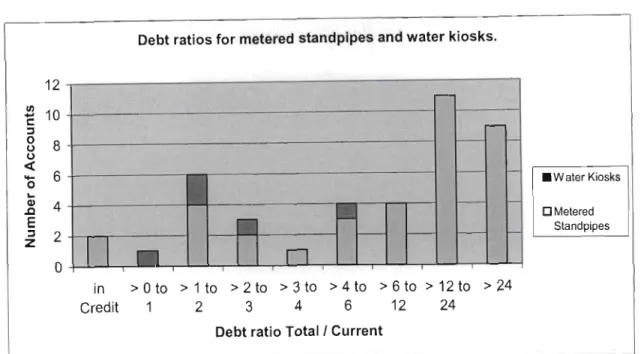
This indicates that more than 28% of Umgeni Water income comes from water supplied to developing communities. The columns on percentage of the total number of accounts illustrate that, while the value of accounts from which Umgeni Water is responsible for recovering costs directly.
Cost Recovery Methods in Umgeni Water
- Flat Rate Standpipes
- Costs for and income from Umgeni Water schemes to Developing Communities
- Financial costs
- Indirect costs (overheads)
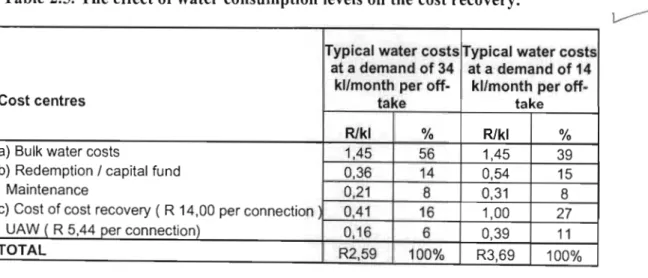
There are indications that the cost recovery for these links is high and Table 2.5 shows that full operation and maintenance. The main disadvantage of this type of connection is the high costs associated with construction, operation and maintenance. In such schemes, the locally elected water board is responsible for managing and thereby organizing the management of the reticulated pipes, collecting revenue from community members and paying for the amount of water delivered by Umgeni Water.
Involvement of statutory bodies III the operation and maintenance of community water supplies has been found to be ineffective and costly. This can be done when the community accepts a central role in paying operating and maintenance costs. Table 2.6 shows the average monthly operation and maintenance costs for a range of Umgeni Water schemes supplying developing communities as supplied by.
Average monthly operation and maintenance costs during the period June 1994 to May 1995 for 10 water schemes. Comparison between average monthly operation and maintenance costs and revenues during the period June 1994 to May 1995 for 10 water schemes. Institutional arrangements for the operation and maintenance of water supplies within developing communities that are not integrated with established urban communities.
Draft Tariff Regulations for Water services tariffs in South Africa
- Revenue requirements
Direct costs typically include administrative costs, operation and maintenance costs, pumping costs, labor costs, and overhead costs directly attributable to a particular water system. These are costs that cannot be directly attributed to a particular scheme, but contribute to the management and operation of the water resources of the entire country. Catchment management includes activities that are necessary and maintain the water resource in a condition that is satisfactory from an ecological and water supply point of view.
To support the provision of water services, it is important that the costs of renewing and replacing water assets are built into tariff structures (DWAF, 1999). Regardless of the amount of water consumed, there are fixed costs incurred by a water utility authority that must be covered. Moreover, these costs are defined as fixed in the sense that they are not related to the amount of water consumed.
Therefore, local commitment to maintenance through local contribution of resources (monetary and/or human) can be crucial to the sustainability of water supplies. There are many different ways in which joint participation in the maintenance of common water supply facilities can be ensured. Meters can be installed on common standpipes or a water bailiff can be used to ensure funds are recovered.
Existing Computer based Cost Calculation Models
- DW AF's Study to determine a Cost Effective and Sustainable Method to provide Rural Communities with Yard or House
- Observations
- Mvula Trust's Help Manual for Rural Water Credit
- Social development dimensions
- Technical options
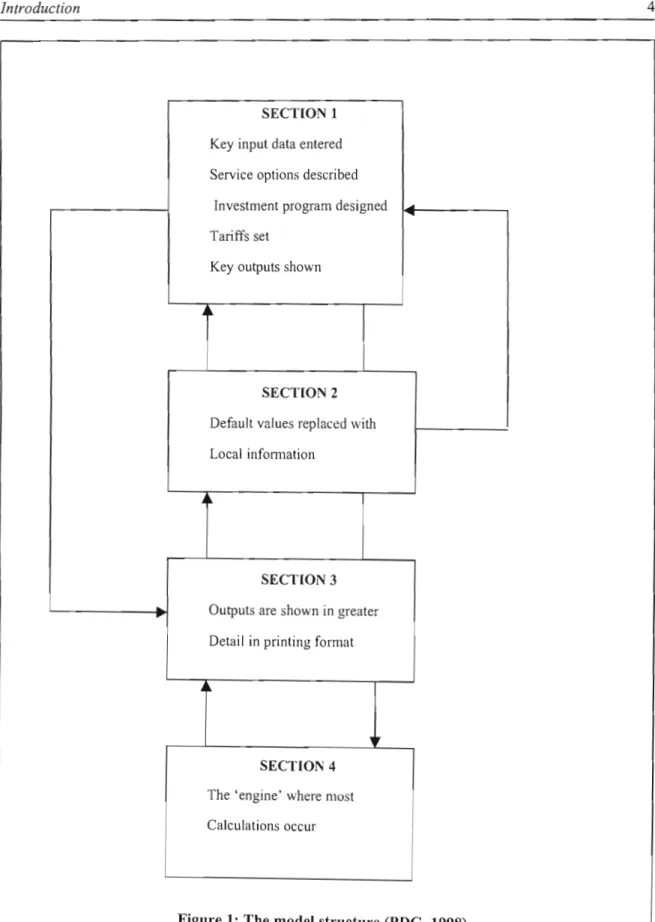
- Structure of the model
- Observations
- Water supply services model manual
- Model Description
- Investment program
- Net cash flows, non-payment, costs and prices
- Raftelis Model for Water Pricing Structure
- Characteristics of an Effective Pricing Structure
- Approach to Establishing User Charges (Tariffs)
- Identifying Revenue Requirements
- Determining Cost of Service
- Designing a Rate Structure
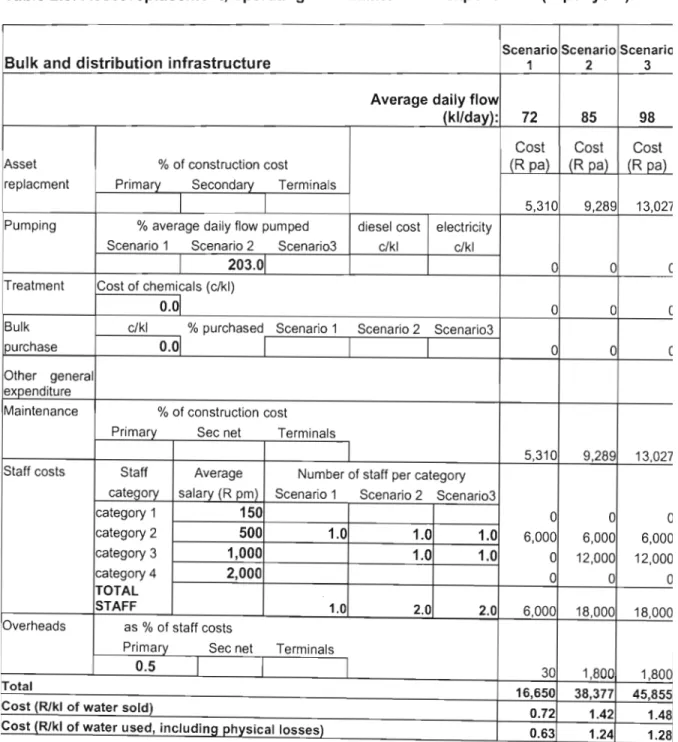
The summary indicator of viability is the net cash flow of the scheme for the year. Asset replacement costs are entered as a percentage of the construction costs of the infrastructure, the secondary network and terminals. The total costs per year for the three scenarios are shown in the last three columns of the table.
Bulk purchase costs are recorded by entering the cost per kl of purchased water (c/kl) and the percentage of the total consumed quantity that is purchased. Maintenance costs are entered as a percentage of infrastructure construction costs, just as in the case of asset replacement. The model then calculates the total cost per year for each of the scenarios in rand.
The replacement costs of the assets are calculated as a percentage of the construction costs as indicated in the previous paragraph. Maintenance costs are calculated as a percentage of the infrastructure construction costs, just like for asset replacement. The main focus of the model is on the financial viability and sustainability of the water supply service.
Discussion
Chapter Three
Operation and Maintenance costs calculations
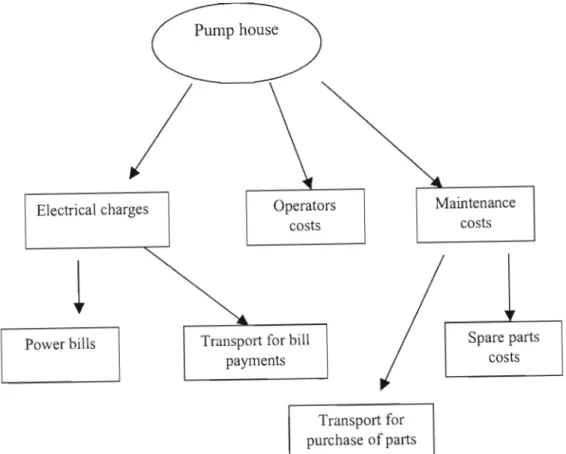
The elements taken into account in the calculation of operating and maintenance costs were developed into a basic algorithm, which was then used to create a research questionnaire. The number of visits to the bank, the cost of transporting fuel, transporting sand for filters, the costs associated with paying bills and the costs associated with the purchase of spare parts. Pipes used per year, total number of taps in the scheme replaced per year, cement used, operator/plumber repair costs.
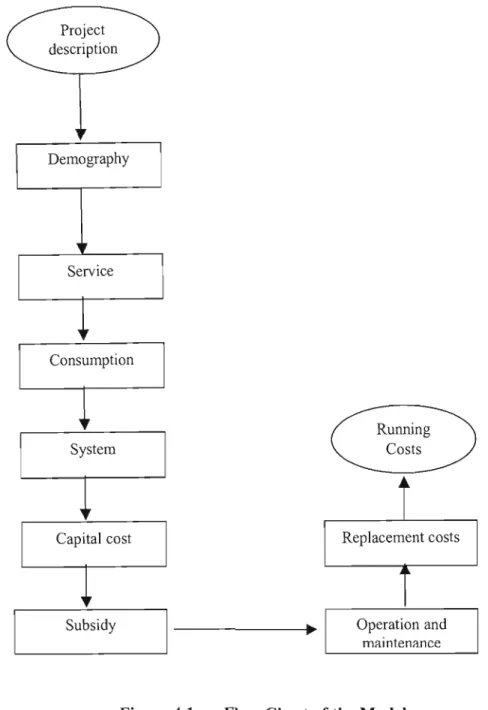
In order to create a cost model, it was necessary to include all versions of the water scheme. This was achieved by using a matrix that aimed to cover the different possible versions and types of community water supply systems. The model is based on the financial framework used in the Water Supply Services Model and the Rural Water Credit Assistance Manual, which are described in the literature review.
The framework is divided into tables that deal with different aspects of the water supply scheme. An example is the data on the number of household connections that is entered in the project description sheet, which can then be accessed by all sheets through the equation link in the cells of the spreadsheet. Once the sheet frame is in place, information about the various water supply projects is entered into the cells.
Chapter four Model development
- Model Guidelines and Operation
- Project description
- Demography
- Service Level
- Meter reading
- Consumption
- System description
- Capital costs summa ry
- Capital cost
- Tariffs and income
- Expenditure
- Subsidy
- Operation and Maintenance
- Assets replacement
- System variants
- Model Operation
- Project description
- Demography
- Service Level
- Meter Reading
- Estimated Water Consumption
- System Description Summary
- Capital Cost Summary
- Accounts - Rates and income in Base year
- Capital Cost
- Scheme Variants
The estimated capital costs are divided into the bulk and distribution aspects of the water supply plan. This gives the capital cost of the scheme along with the capabilities of the components. This breakdown is necessary to gain insight into the nature of the maintenance costs later in the model.
The prices charged for different levels of water supply services are listed on this sheet. This efficiency is later used in water costing as an additional factor to administrative costs. The purpose of this sheet is to calculate project costs per consumer unit.
Therefore, the use of subsidy is primary or secondary as shown in the table. This is the main output data sheet that uses the data from the rest of the spread sheets. The output data are the cost of water per liter and the monthly cost of water per household.
Chapter Five
Community Water Supplies Analysed in the Model
- Kwa Zulu Natal Province
- Mvunayane Water Supply
- Draylott Water Supply
- Nhluwgwane Water Supply Scheme
- Kopi Water Supply Scheme
- Zawumphilo Water Supply Scheme
- Montebello Water Supply Scheme
- Emayelisweni Water Supply Scheme
- Esidumbini Water Supply Scheme
- Ezigeni Water Supply Scheme
- Dicks Water Supply
- Nomponjwana Water Supply
- Northern Province
- Mars Water Supply
- Claremount Water Supply
- Fairlite Halt Water Supply
- Makweya Water Supply
The model shows from the analysis that the operating cost for the water supply scheme is R3.5 per household per month. The model shows from the analysis that the operating cost for the water supply scheme is R12 per household per month. The model shows from the analysis that the running cost for the water supply scheme is R13.6 per household per month.
Analysis from the model shows that the running costs for the water supply program are R9.2 per household per month. Analysis from the model shows that the running cost for the water supply program is R6.2 per household per month. Analysis from the model shows that the running cost for the water supply program is R3.7 per household per month.
Analysis from the model shows that the running cost for the water supply program is R7.3 per household per month. Analysis from the model shows that the running cost for the water supply program is R2.3 per household per month. Analysis from the model shows that the running cost for the water supply program is R2.1 per household per month.

Chapter Six
Umgemi Water's cost recovery research was found to contain generic cost approaches to the sustainability of water supply services. The T e-inham Shand model was unique in its shared resource perspective of water supply management. While the costs of administration were well illustrated, the source of operation and maintenance were not given figures.
Maintenance cost was a percentage of construction costs like the rest of the models. The Palmer Development Group model was a manual on the financial viability and sustainability of water supply service. Replacement costs were therefore worked out from the magnitude percentages shown in the literature review.
Due to this shortcoming the replacement charges were left out of the final cost of the model. Most projects have inventory left over from the construction period, which subsidizes maintenance costs. This was inferred from the observation that the calculated cost was approximately 75% to 80% of actual rates.
Socio-economic consequences of water restrictions on local authorities, selected industrial and commercial enterprises and other private agencies. Urbanization Working Group of Water Supply and Sanitation Cooperative Council, Report adopted at the Rabat meeting of the council 7-10 September 1993, Water Supply and Sanitation Cooperative Council, 1993. World Health Organization, Overcoming Suffering, Enriching Humanity, The World Health Report, Report of the Director -General, Geneva, 1997.
Has the tariff increased since the start of the project - how often and by how much. Is there a limit to the amount of water a household can pump daily? How much water you pump (eg the commission may say they fill the tanks twice a week).