The results of this subsurface investigation highlight the dynamics of surface and subsurface water in the transects on the slopes. Using the monitored data and 2D vadose zone modeling, the dominant processes on slopes have been defined and used to assist in the selection of critical parameters to be used in estimating catchment runoff.
INTRODUCTION
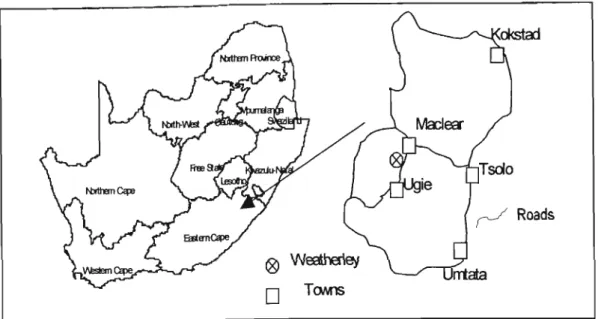
To be sure that the altered responses have been accurately modeled, the modeler must have a concise understanding of the subsurface processes. For this reason, the Weatherley research catchment in the northern East Cape Province was established to obtain a clear and concise understanding of the subsurface processes occurring at a hillslope scale.
LINKING HILLSLOPE PROCESSES AND RUNOFF
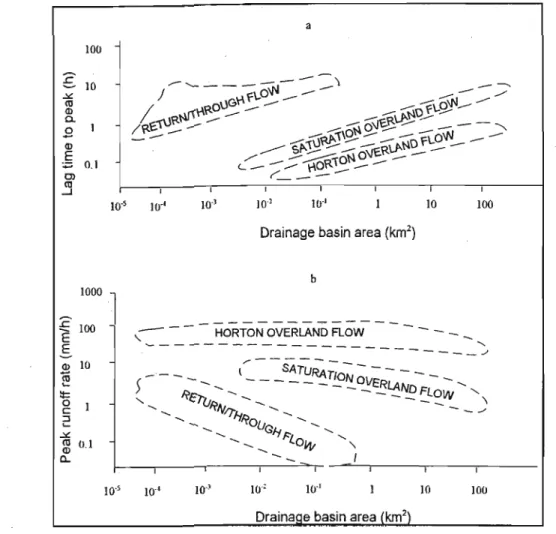
Overland Flow
The subsurface flow is restricted in these areas and forced to leave the soil layer on the surface and become return flow. The delay times to the top of the hydrograph are lower for overland flow than return/flow due to the fact that movement through the soil medium delays water flow to the stream. Delay times for saturated overland flow are also less than for return flow due to return flow occurring only after the soil has become saturated.
Subsurface Flow
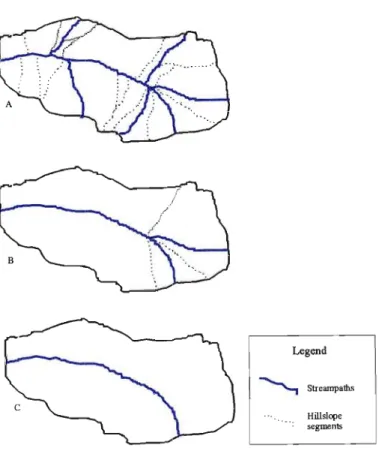
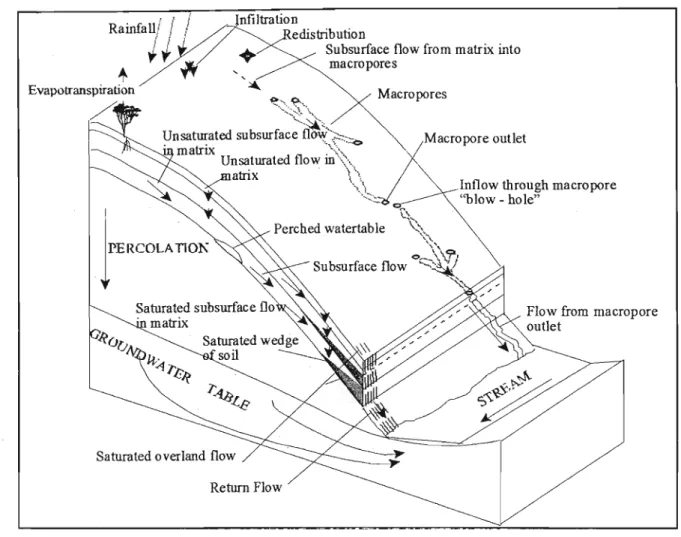
Since these soil properties often have a high degree of spatial variation on a hill, subsurface flow contributions from the different parts of the hill do not. Localized or prostrate water tables (Figure 2.2) can develop in areas where a layer of lower conductivity occurs.
CATCHMENT SCALE MODELLING APPROACHES USING HILLSLOPE PROCESSES
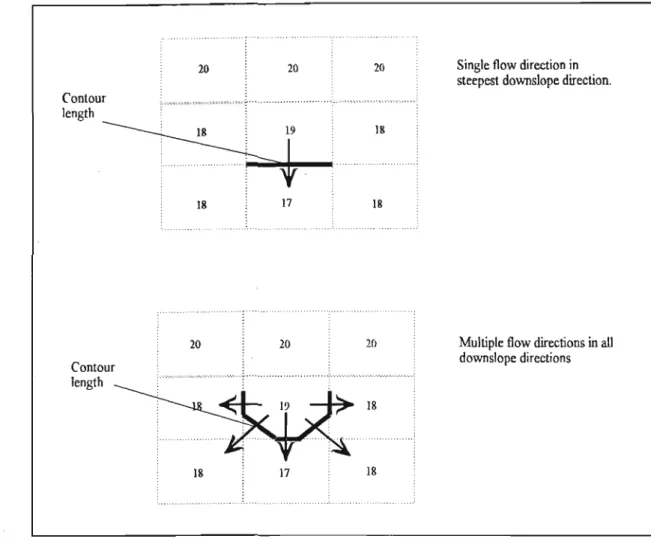
- The Topmodel Approach
- The Contributing Hillslope Sections Approach
- The Detailed Distributed Surface and Subsurface Modelling Approach
- The Hydrological Response Unit (HRU) Approach
This approach uses isotopic separation of the stream with a unit slope and the river as a basis. Streams. 1993) also discussed determining trends in soil properties in relation to topographic position (i.e. the existence of a catenary).
THE HILLS MODEL
Introduction to the HILLS Model
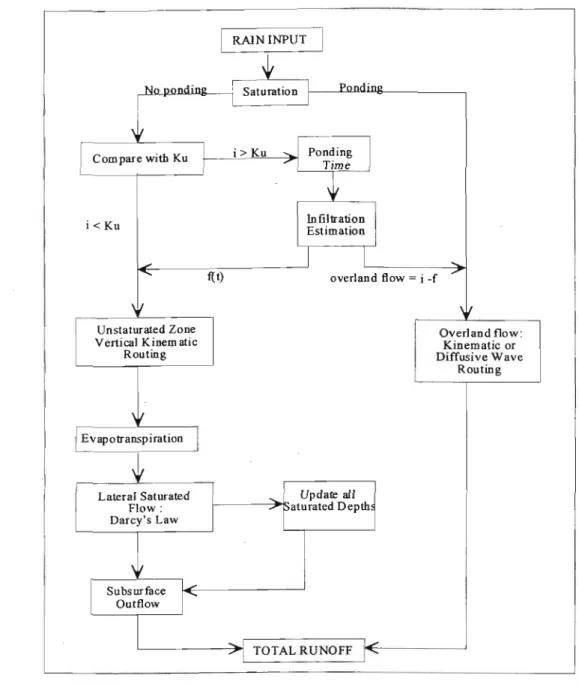
K (i » K) is dominated by soil diffusion properties, and analytical approximations of infiltration are used to describe the partition between overland flow and infiltration. Conversely, if < K, precipitation will infiltrate the soil and the unsaturated flow will be calculated accordingly.
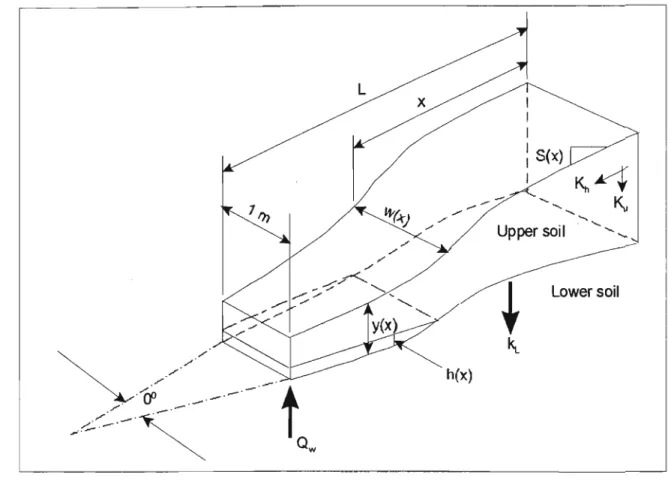
Flow in the Saturated Zone
Since the hydraulic conductivities of the bottom layer can vary downslope, the user must enter the hydraulic conductivities of the upper boundary of the slope. Between these two points, two other intermediate points can be entered and the hydraulic conductivity of the subsoil is calculated by linear interpolation.
DETERMINING SUBSURFACE PROCESSES AND RUNOFF AT THE WEATHERLEY CATCHMENT
Soil Physical Properties
Bulk density, which by Rawlset al. 1992) as the ratio of the weight of dry solids to the bulk volume (volume of solids and volume of pore spaces) of the soil, was determined using the core method. Soil porosity (the total volume occupied by pores per unit volume of soil) is calculated from the bulk density and particle density, which normally has a value of 2,650 kg.m" (Rawlset al., 1992). These properties provide information regarding how the flood is likely to react' in soils with different physical properties.
For example, as bulk density increases, water retention and hydraulic conductivity near saturation decrease (Rawls et al., 1992).
Soil Hydraulic Characteristics
The equation used to determine the saturated hydraulic conductivity is given as (Amoozegar and Warrick, 1986). The water retention characteristic (WRC) of a soil is an indication of the soil's ability to store and release water and is defined as the relationship between soil water content and matric potential (Rawlset al., 1992). WRC data are presented along with a curve-fitting procedure in which functions from Brooks and Corey (1964) are fitted to the actual data. From the procedure, properties such as pore size distribution, bulk density and porosity can be determined indirectly.
This method was developed at Colorado State University, USA (Lorentzet al., 1991) and involves placing a core sample of saturated soil in a closed chamber and applying air pressure to the chamber. The following subsection describes the instrumentation used in the monitoring network at the Weatherley catchment. The controlled tensiometry experiment was carried out to enable a better understanding of the factors affecting the tensiometers in the field and the tracer study to provide an insight into the underground floods at Weatherley.
Field Monitoring
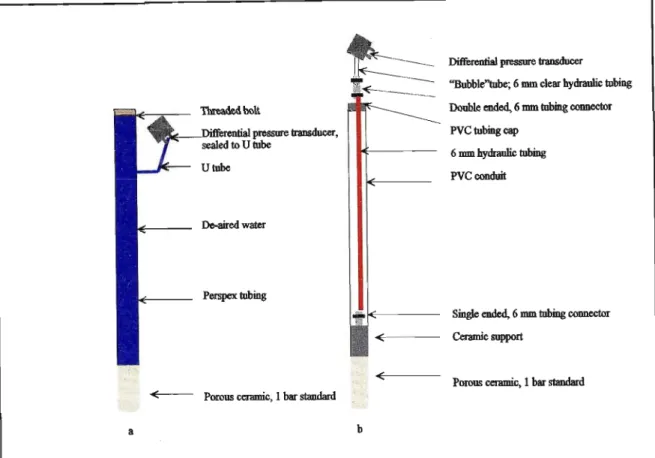
- Tensiometers
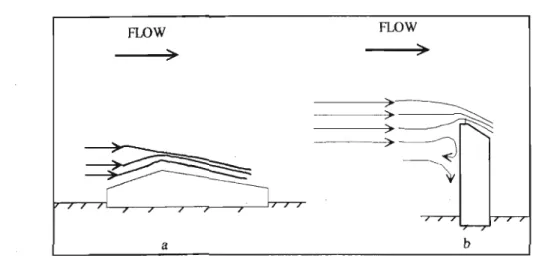
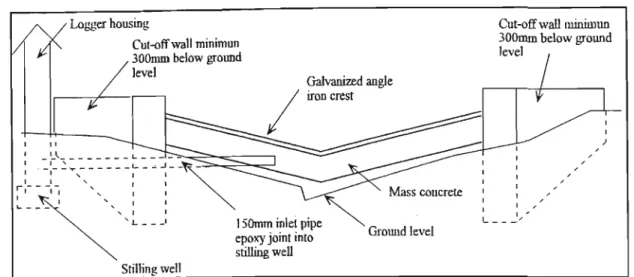
- Runoff Weirs
- Pilot Tracer Experiment
All components are separated during transport and only the ceramic needs to be attached to the ceramic support in the laboratory. The transformer has a temperature-compensated silicon diaphragm that responds to differential pressure changes across the ports and is not affected by temperature changes during operation. The transducer voltage signals are then recorded on a recorder and converted to matrix pressures on a spreadsheet by means of calibrations. These piezometers consisted of a Motorola MPX5050 low pressure transducer, similar to those used in tensiometers.
The transducer was then attached to the same four-channel logger used for the tensiometers. These automated piezometers could only be placed in the vicinity of existing tensiometer nests due to the lack of loggers. In order to ensure minimal disturbance of the litter flow and wetland-stream interaction, the weir had to be a submerged type.
Rain and streams were recorded at the upper catchment which is near the locality.
RESULTS AND DISCUSSIONS
Fieldwork
- Soil Data Results
- Monitored Results
- Controlled Tensiometry Experiment
- Pilot Tracer Experiment
Transect 2, also in the upper catchment, intersects transect 1 and runs from nest DC8 at the top of the slope down to the dam (cf. Figure 5.3). Transect 3 in the lower catchment runs from the top of the slope at Nest 1, down past Nest 4 and the Molteno rock outcrop, through the marsh to the stream rather than up the opposite slope. Another reason for such a rapid response is the presence of macropores and tubes in the surface soil.
There is a rapid response to the rainfall event up to a depth of 0.84 m as indicated by the rapid decrease in S.M.P.s. The toe of the slopes in the valley shows that the soil is in a state of saturation. Since macropores were only present in the soil surface to a depth of approx. 1 m (Esprey, 1997), and the soils below this depth appear to have lower hydraulic conductivity (cf. Figure 6.9), the water moves laterally through the surface soils.
At Nest 2 and Nest 3, groundwater levels remain near the bedrock at about 2.5 m below the surface, while saturated conditions exist to a depth of about 1 m. Deep soils contribute to runoff when subsurface flow occurs at the top of the slope near the VC4 nest and wetland. The dry month (July 1999) shows a marked increase in the depth of groundwater on the summits and slopes, with the depth of groundwater falling to 2.4 m on some slopes.
Modelling results
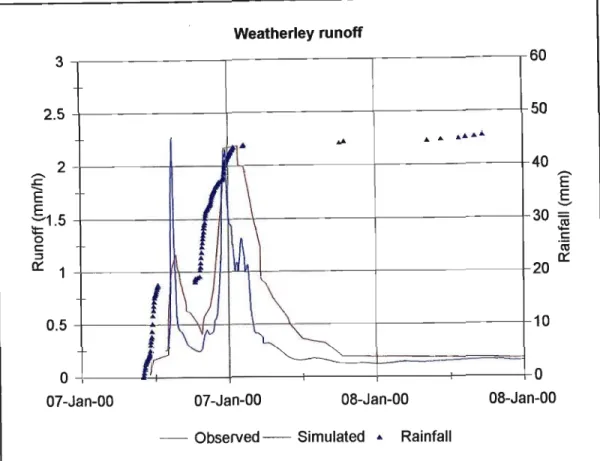
The reason could be that the HILLS model assumes that water in the unsaturated zone only moves in a vertical direction at the rate specified by the vertical conductivity, K; (cf. Figure 4.1), and saturated flow occurs first, reaches the depth to the soil bedrock interface. has been saturated, and is doing so at the rate specified by the horizontal conductivity (Kh). •In reality, the upper catchment has numerous macropores and pipes which enable rapid infiltration into the deep soils (cf. discussion of Figure 6.20). The absence of soil infiltration due to macropore flow is also evident in the fact that the receding portion of the simulated runoff (Figure 6.29) does not show the slow release of subsurface flows into the marsh and stream as seen in the observed runoff. The shape of the cumulative runoff graph also shows that the simulation does not account for initial infiltration into the soil, but shows rapid runoff from the hillslope into the marsh.
The observed results indicate a slow desorption of water from the soil into the marsh and stream. The fact that the total volume of simulated runoff is similar to the total observed runoff three days after the event, after the retreating arms of the hydrograph have reached equilibrium, indicates that the model is performing satisfactorily in the Weatherley catchment. This chapter presents and discusses the results of extensive fieldwork and monitoring networks in the Weatherley catchment.
The results show that catchment runoff can be accurately simulated using hillslope hydrological processes, provided a clear understanding of the subsurface processes at the hillslope scale is obtained.
SUMMARY AND CONCLUSIONS
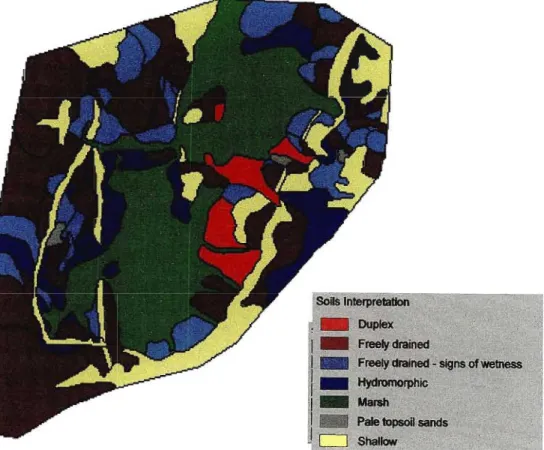
This, coupled with the fact that high porosity values were obtained in the swamp areas, leads to the conclusion that the swamp. The lower catchment wetland showed a deviation from the general trend, with bulk density increasing downhill toward the stream from beneath the rock at nest 6. The presence of macropores causes fast-draining soils near the stream, which allows rapid drainage. flows from the swamp area into the stream.
Tensiometer data from wetlands indicate a consistently saturated or nearly saturated condition throughout the year. Runoff data from the two Crump weirs indicated that the basin has a rapid response to a rainfall event. A low-intensity event allowed a slow continuous release of water into the stream from the marsh, while a high-intensity event produced results associated with a rapid overland flow.
In light of the proposed afforestation of the Weatherley catchment, this thesis aims to provide a good understanding of the processes taking place in the Weatherley.
RECOMMENDATIONS FOR FUTURE RESEARCH
The Future of Distributed Models: Model Calibration and Uncertainty Prediction. editors) Terrain Analysis and Distributed Modeling in Hydrology. An emerging perceptual model of the Maimai catchment.InAnderson,M.and Brooks, S. Capabilities and limitations of detailed hillslope hydrologic modeling. Hillslope experiments in the North Eastern Cape to measure and model subsurface flow processes. Unpublished M.Sc Dissertation, Department of Agricultural Engineering, University of Natal, Pietermaritzburg, South Africa.
In Anderson, M and Burt, T. John WHey and Sons, Chichester, UK Describing catchment hydrological response using the catchment function. editors). Determination of the flow and transport parameters of the unsaturated zone using dye tracers.In Leibundgut,C. editor) Tracer Technologies for Hydrological Systems. Predicting hillslope flow paths for distributed hydrologic modeling using digital terrain models. InBeven, K. editors) Site Analysis and Distributed Modeling in Hydro10gy.John Wileyand Sons U.K. Rawls, W., Ahuja, L., Brakensiek, D., and Sirmohammadi, A. Infiltration and groundwater movement.
A call for hydrological models based on remote sensing, tracers and other modern hydrometric techniques. editors) Integrated methods in catchment hydrology - tracers, remote sensing and new hydrometric techniques.
APPENDIX A
APPENDIXB
APPENDIXC
APPENDIXE
APPENDIXF
APPENDIXG