DETERMINANTS OF INVESTMENT ACTIVITIES: A COMPARATIVE ANALYSIS OF THE BRICS AND SOME SELECTED SADC COUNTRIES
by
LOURENCE LETSOALO
Dissertation submitted for the requirements for the degree of
MASTER OF COMMERCE IN ECONOMICS In the
FACULTY OF MANAGEMENT & LAW (School of Economics and Management)
at the
UNIVERSITY OF LIMPOPO
SUPERVISOR: PROF T NCANYWA
2021
ii DECLARATION
I declare that “DETERMINANTS OF INVESTMENT ACTIVITIES: A COMPARATIVE ANALYSIS OF THE BRICS AND SOME SELECTED SADC COUNTRIES” is my own work, and all sources used and quoted are indicated and acknowledged by complete references, also this work has not been presented to other institutions before for any other degree.
……….. ……….
Full names Date
iii DEDICATION
This dissertation is dedicated to Annah Mochinye Letsoalo and Harrison Theophilus Masedi, my loving mother and late father, for their unwavering support since I began University. Thank you for your love and patience for me, and for believing in me. God bless you. May your soul rest in complete peace to my late grandmother and dad.
iv ACKNOWLEDGEMENTS
The following bible verses have guided me throughout my life, and I would not be where I am today if it weren't for them;
“With God, all things are possible” Mark 10:27
“All things are possible if you believe” Mark 9:2
“As soon as I pray, you answer me, you encourage me by giving me strength” Psalm 138:3 First and foremost, I want to thank the Almighty God and my Ancestors for this opportunity, blessings and safety that they have bestowed upon me. I never cease to be surprised by the confidence I have in God. Thank you for your courage and strength to write this report to the Man above. Hope actually gives us confidence. Thanks sincerely to my supervisor, Prof. Thobeka Ncanywa, I thank you for the quality of your valuable guidance and commitment on this journey. I thank you for the competent supervision.
Thank you very much, and may God continue to bless you. My family, particularly my mother Annah Mochinye Letsoalo and late father Harrison Theophilus Masedi, my two lovely sisters Kholofelo and Maggie Letsoalo, and last but not least, my nephews (Thabang and Tumelo Letsoalo) and nieces (Refilwe and Joyce Letsoalo), for their unwavering support. All thanks to the University of Limpopo for allowing me to pursue and conduct my Masters in Economics study. Finally, I'd like to express my gratitude to my friends for their motivation and support.
v ABSTRACT
Investment as one of the main macroeconomic variables can ensure development of infrastructure and economic growth through increasing productivity and attracting investors.This study examined key determinants of investment activities by means of a comparative analysis between the SADC and BRICS groups during the period 2004- 2019. The key variables were the real exchange rate, real interest rate and trade openness.
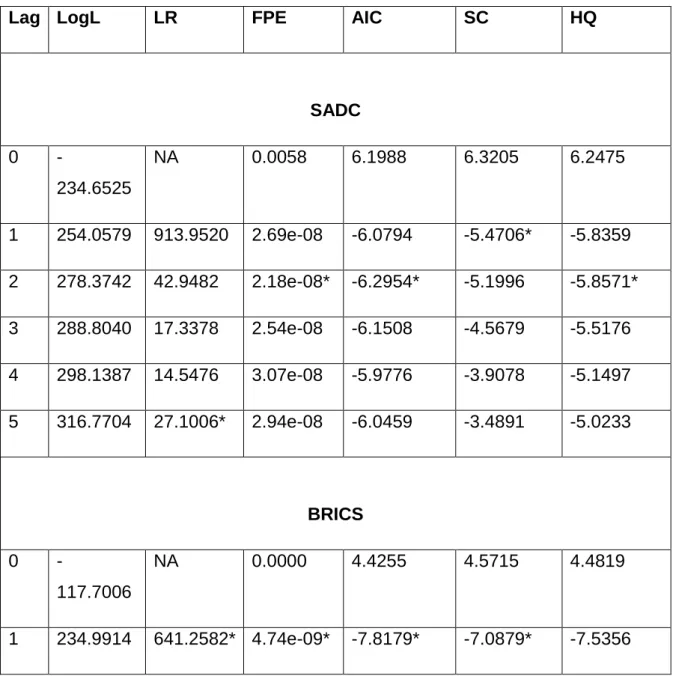
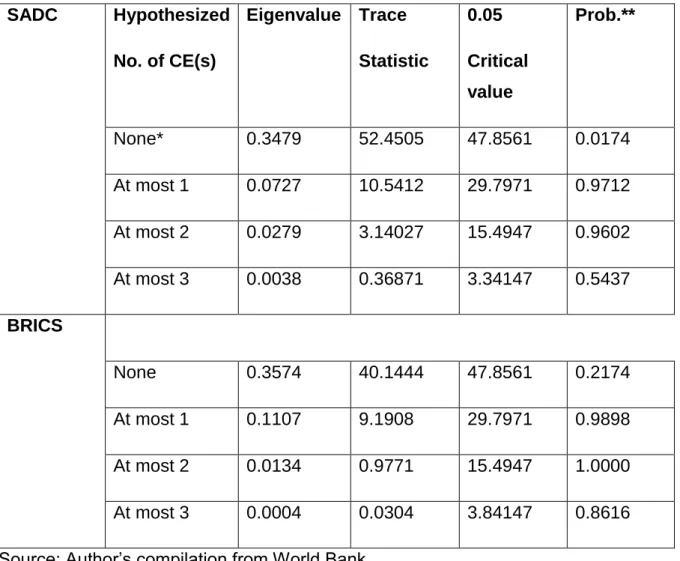
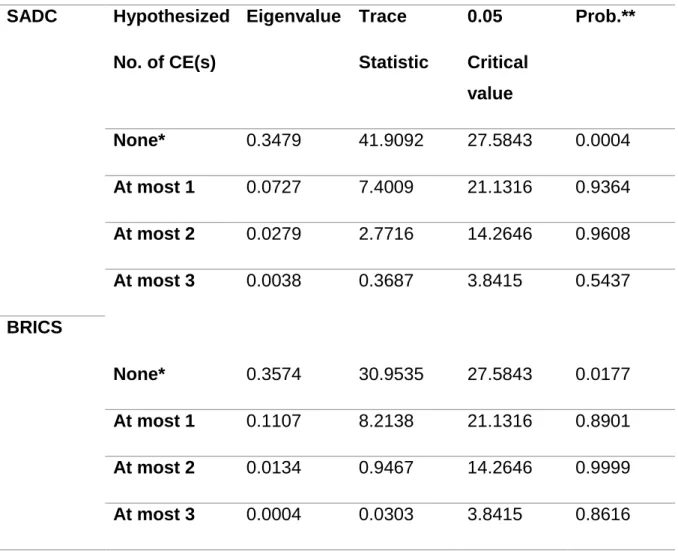
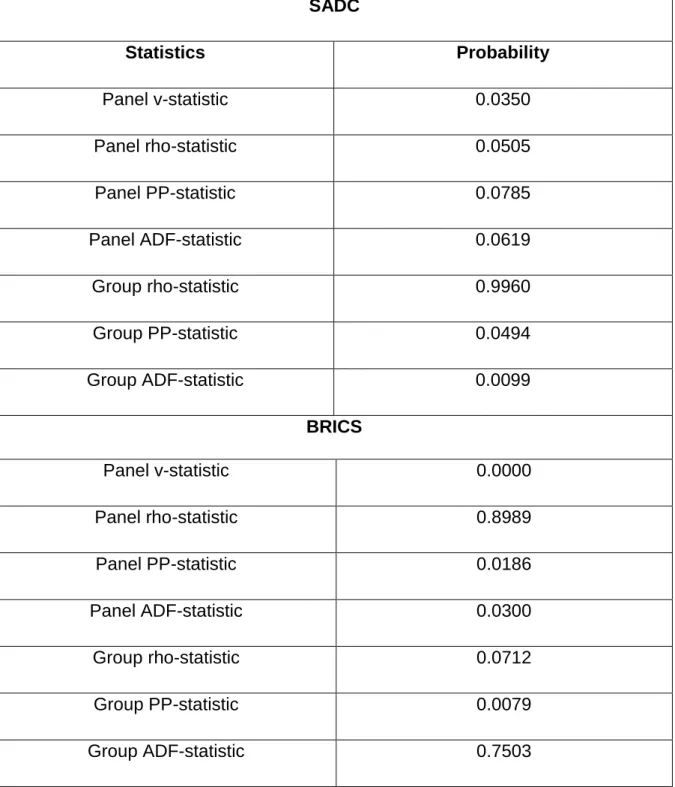
The analysis began by reporting unit roots tests, which paved way for employing Panel Autoregressive Distributive Lag (PARDL) methodology in the existence of different orders of integration. To estimate the long run relationship between the variables, we made use of the panel Johansen cointegration test, Pedroni test, Kao test and the Johansen Fisher cointegration test. Through the PARDL, the exchange rate and trade openness were found to be positive and statistically significant determinants of investment in SADC although statistically insignificant in the BRICS group. In addition, interest rates yielded insignificant results in the SADC region while, on the contrary, yielded a negative and statistically significant relationship in the BRICS group. The Granger causality test indicated a bi-directional causality in the exchange rate-investment and trade openness- investment nexus for the SADC group while there was no causality in the BRICS group.
It can be concluded that trade openness and exchange rate are key determinants of investment in the SADC region while interest rates are key in the BRICS group. It is therefore recommended that in order to attract investors and boost investment activities the SADC group need to focus more on exchange rate stability and trade openness while the BRICS group need to pay more attention to the flexibility of interest rates. This is beneficial on trading patterns, more for South Africa as it can be found in both groups.
KEY CONCEPTS: Investments, real exchange rate, trade openness, SADC, BRICS, Panel-ARDL
vi TABLE OF CONTENTS
DECLARATION ... ii
DEDICATION...iii
ACKNOWLEDGEMENTS ...iv
ABSTRACT ... v
LIST OF FIGURES ...ix
LIST OF TABLES ...xi
LIST OF ACRONYMS ...xii
CHAPTER 1 ... 1
ORIENTATION TO THE STUDY ... 1
1.1 Introduction and background ... 1
1.2 Statement of the problem ... 4
1.3 Research aim and objectives ... 4
1.3.1 Aim of the study ... 4
1.3.2 Objectives of the study ... 4
1.4 Research questions ... 5
1.5 Definition of concepts ... 5
1.6 Ethical considerations ... 6
1.7 Significance of the study ... 6
1.8 Structure of the dissertation ... 7
CHAPTER 2 ... 9
TRENDS OF INVESTMENT ACTIVITIES IN SADC AND BRICS ... 9
2.1 Introduction... 9
2.2 The analysis of investment trends in SADC ... 9
2.3 The analysis of investment activities in BRICS ...19
2.4 BRICS total investment and trade with SADC (US$ millions) ...28
2.5 Conclusion ...31
vii
CHAPTER 3 ...32
LITERATURE REVIEW ...32
3.1 Introduction...32
3.2 Theoretical literature ...32
3.3 Empirical literature ...37
3.4 Conclusion ...46
CHAPTER 4 ...47
RESEARCH METHODOLOGY ...47
4.1 Introduction...47
4.2 Data ...47
4.3 Model specifications ...47
4.4 Estimation techniques ...48
4.4.1 Panel unit root test ...48
4.4.2 Panel cointegration ...50
4.4.3 Panel Auto Regressive Distributive Lag ...51
4.4.4 Diagnostic and stability tests ...53
4.4.5 Engle-Granger causality test ...53
4.4.6 Generalised Impulse Response Function ...55
4.4.7 Variance Decomposition ...55
4.5 The priori expectations ...56
4.6 Conclusion ...56
CHAPTER 5 ...57
INTERPRETATION OF FINDINGS ...57
5.1 Introduction...57
5.2 Empirical tests results ...57
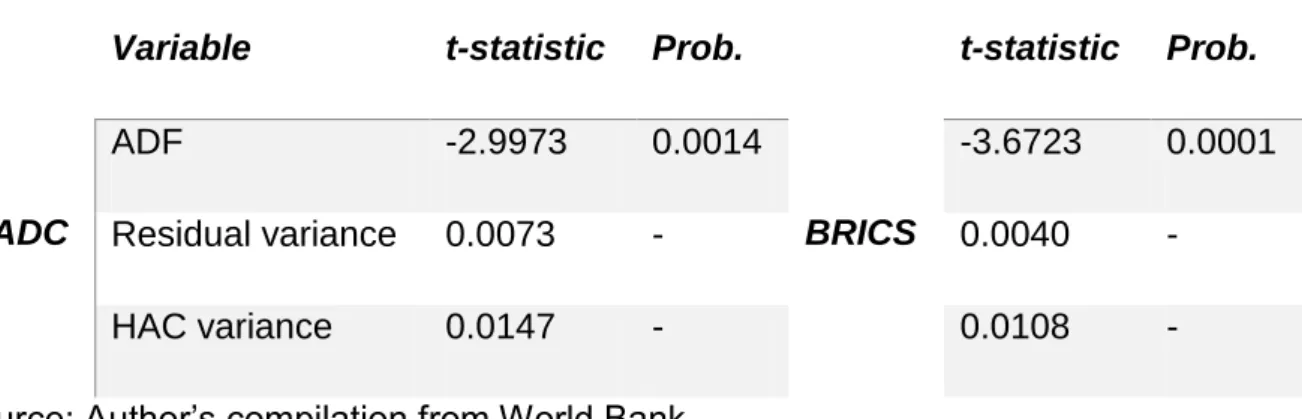
5.2.1 Unit root tests results ...57
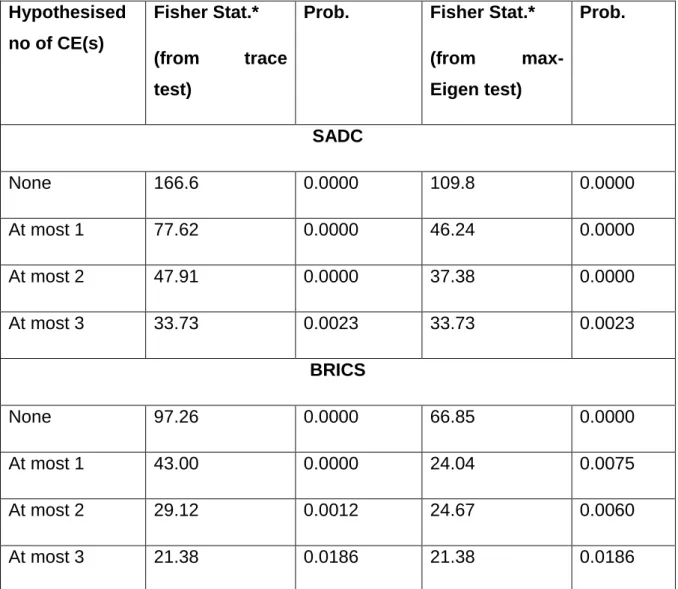
5.5.3 Panel cointegration tests results ...69
5.5.4 Panel Autoregressive distributive lag results ...78
viii
5.5.5 Diagnostic tests results ...83
5.5.6 Granger Causality tests...86
5.5.7 Generalised Impulse Response Function results ...88
5.2.8 Variance Decomposition results ...91
5.3 Conclusion ...93
CHAPTER 6 ...95
SUMMARY, RECOMMENDATIONS, CONCLUSION ...95
6.1 Summary and interpretations of findings ...95
6.2 Conclusions ...96
6.3 Limitations of the study ...97
6.4 Recommendations ...98
6.5 Areas of future research ...98
LIST OF REFERENCES ...99
APPENDICES... 110
APPENDIX A: DATA ... 110
APPENDIX B: PANEL UNIT ROOT TESTS ... 113
APPENDIX C: SELECTION LAG LENGTH CRITERIA SADC LAG LENGTH ... 129
APPENDIX D: JOHANSEN COINTEGRATION TEST ... 130
APPENDIX E: PANEL COINTEGRATION TESTS ... 134
APPENDIX F: JOHANSEN FISHER PANEL COINTEGRATION TEST ... 137
APPENDIX G: PANEL AUTOREGRESSIVE DISTRIBUTIVE LAG ... 139
ix LIST OF FIGURES
Figure 2.1: Investment trends in SADC………09
Figure 2.2 Trade openness trends in SADC………...12
Figure 2.3: Real exchange rate trends in SADC……….15
Figure 2.4: Real interest rates trends in SADC………...17
Figure 2.5: Investment trends in BRICS………...19
Figure 2.6: Trade openness trends in BRICS……….22
Figure 2.7: Real exchange rate trends in BRICS………24
Figure 2.8: Real interest rates trends in BRICS………..26
Figure 2.9: BRICS total investment in SADC….……….27
Figure 5.1: Informal testing of SADC gross fixed capital formation……….57
Figure 5.2: Informal testing of BRICS gross fixed capital formation………58
Figure 5.3: Informal testing of SADC trade openness………...59
Figure 5.4: Informal testing of BRICS trade openness………..………60
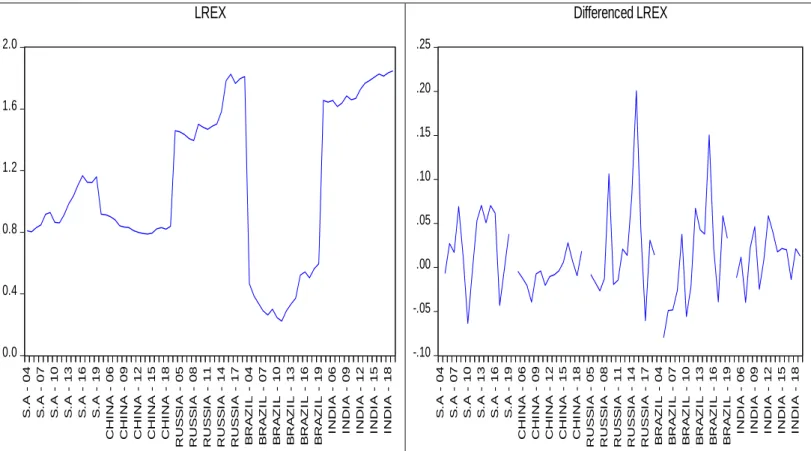
Figure 5.5: Informal testing of SADC real exchange rate………..61
Figure 5.6: Informal testing of BRICS real exchange rate……….62
Figure 5.7: Informal testing of SADC real interest rate………..………63
Figure 5.8: Informal testing of BRICS real interest rate………..………..64
Figure 5.9: Normality test for SADC……….82
Figure 5.10: Normality test for BRICS………..83
Figure 5.11 VAR stability test results for SADC and BRICS………84
Figure 5.12: Impulse response function results for SADC………88
x Figure 5.13: Impulse response function results for BRICS………..89
xi LIST OF TABLES
Table 5.1: Summary of unit roots test results (SADC & BRICS)……….65
Table 5.2: VAR Lag Order Criteria results………..67
Table 5.3: Panel Johansen Cointegration Trace test results………..69
Table 5.4: Panel Johansen cointegration Maximum Eigenvalue test results……….70
Table 5.5: Pedroni cointegration test result………...71
Table 5.6: Kao panel cointegration test results………..72
Table 5.7: Johansen Fisher panel cointegration test results……….73
Table 5.8: Individual cross section for SADC………..75
Table 5.9: Individual cross section for BRICS………76
Table 5.10: Long run relationship in SADC……….77
Table 5.11: Short run relationship in SADC………78
Table 5.12: Long run relationship in BRICS……….79
Table 5.13: Short run relationship in BRICS………81
Table 5.14: Granger causality test for SADC………..85
Table 5.15: Granger causality test for BRICS………86
Table 5.16: Variance decomposition test results for SADC………..90
Table 5.17: Variance decomposition test results for BRICS……….91
xii LIST OF ACRONYMS
GDP: Gross Domestic Product SEZ: Special Economic Zone
SADC: Southern African Development Community BRICS: Brazil, Russia, India, China & South Africa
OECD: Organisation for Economic Co-operation and Development FDI: Foreign Direct Investment
IMF: International Monetary Fund USD: United States of America Dollar SARB: South African Reserve Bank ADF: Augmented Dickey Fuller PP: Phillips Perron
IPS: Im, Perasan & Shin
ARDL: Autoregressive Distributive Lag VAR: Vector Autoregressive
AIC: Akaike Information Criterion FPE: Final Prediction Error
SC: Schwarz information Criterion HQ: Hannan-Quinn information criterion VAT: Value Added Tax
WTO: World Trade Organisation
COMESA: Common Market for Eastern and Southern Africa
xiii SACU: Southern Africa Customs Union
CMA: Common Monetary Area EU: European Union
CMA: Common Monetary Area
1 CHAPTER 1
ORIENTATION TO THE STUDY 1.1 Introduction and background
It has been debated nationally and internationally that investment activities can be beneficial to boost the countries’ economy by accelerating growth and creating employment (Gilal, Ajmar & Farooq, 2019; Sibanda, Gonese & Mukarumbwa, 2018;
Ncanywa & Makhenyane, 2016). When investing money or other resources in anticipation of future benefit, this act is referred to as investment. Investment activities involve investments in fixed income such as bonds, fixed deposits, preferential shares and business ownership of property (Acosta & Loza, 2005). Fixed investment calculated by gross fixed capital formation was adopted in this study (StatsSA, 2019).
According to StatsSA (2017), fixed investments can be seen from three main viewpoints, first during the global financial crisis of 2008/9, where it was gradually expanding. Second, despite being slower as a percentage of gross domestic product (GDP) growth, it remained above its long-term average of 18.3 per cent in South Africa from 1990-2016. Lastly, during the global financial crisis, the capital investment system by form of organisation, represented a marked shift in both economic activity and asset size. Hishongwa (2015) further claimed that, in terms of aggregate investments, growth reached 9.2 per cent per annum during the pre-crisis period from 2000 to 2008 but decelerated to a mere 0.6 per cent per annum following financial crisis.
South Africa is a trade partner with the countries of the Southern African Development Community (SADC) and BRICS (Brazil, Russia, India, China, and South Africa) among others. When comparing South Africa with its trading partners such as China, its fixed investment has been expanding steadily between 6.5 and 10% annually over the past few years (OECD, 2019).
The SADC is one of the richest regions in Africa and thus makes South Africa’s participation the largest economy on the continent proving the basis for successful cooperation. The SADC’s origins go back to the 1960’s and 1970’s because of the political, diplomatic and military conflict between the leaders of the major colonial countries and national independence movements to end apartheid. It is composed of 16 countries in Southern Africa with headquarters in Gaborone, Botswana. The
2 immediate predecessor of today’s SADC’s political and security cooperation leg grouping which remained a loose alliance of African countries aimed to terminate apartheid and white minority rule in South Africa and Rhodesia from the 1960s to the early 1990s (SADC, 2012). Such states depend on investment to help realise their long-term economic aims in order to grow the SADC economies. For this reason, SADC has developed policies and procedures that promote investments such as foreign direct investment that contributes directly to the project that creates employment in the area and that develops the infrastructure and industry required for economic growth.
The World Bank (2014) reports that the global economic crisis that began in 2008 significantly influenced SADC’s investment in the region as they dropped by nearly 50% between 2009 and 2010. The market size, infrastructure efficiency, availability of natural resources and political stability of the member states are not equal in all.
Consequently, some member states have more firmly held expenditure rates than others. Angola and South Africa have traditionally higher rates of investment, as indicated by the World Bank (2014), and in 2010 the Democratic Republic of Congo increased its net foreign direct investment influx to almost US$ 3 billion. Likewise, Seychelles significantly improved its revenue investment as a percentage of gross domestic product, reaching 40%. Identical associate countries that are lower average in terms of these main assessment measures stay still in a position to make stable investments in extractive trades as future foreign demand for mineral deposits outweighs any risks involved.
Investing in emerging markets is risky because it can either go reasonably well or go terribly wrong. BRICS countries are five major emerging national economies and they have bilateral relations which is conducted mainly based on non-interference, equality and mutual benefits. According to the World Bank (2019), all these five countries account for about 40% and an extra 25% of their GDP. Considering the important contribution that these countries make to the global economy, they can produce positive returns for investors. BRICS importance for foreign trade flows has increased dramatically over the last decade. The financial and pharmaceutical industries in these countries have usually been the highest beneficiaries of foreign investment, as they supplement the well-developed capacity of these sectors. Since 2015, investment inflows in the BRICS economies reduced by 6 percent that translate to US$ 256 billion
3 and has seen the group accounting for 9 per cent of the world’s total foreign investment. In terms of foreign direct investment, China has been on top as compared to other BRICS counterparts with the country recording an aggregate of US$ 1724 million of the FDI inflows in the past 25 years followed by Brazil with US$ 785 million.
Russia and India on the other hand have also seen an upsurge of inflows ranging US$
452 and US$ 370 in aggregate flows respectively. Lastly, South Africa has been lagging behind as it recorded a mere US$ 77 million in the last 25 years (World Bank, 2017).
Fixed investment ratio to nominal GDP dropped for South Africa from a recent high of 23.5% in 2008 to 19.6% in 2016. A fall in the ratio occurred from about mid-2008 following the unwinding of boom conditions in global commodity prices. South Africa has experienced technical recession during two consecutive quarters in 2018 with real GDP recording a decline of 0.7% (StatsSA, 2018).It was the first recession in South Africa following the global financial crisis of 2008/9. In 2018, the top three main negative contributors to GDP growth were agriculture, transport and trade (StatsSA, 2018). The persistently low level of consumer and business trust in the domestic economy has also resulted in several main domestic private sector expansion projects being postponed, thereby reducing fixed investment by 0.5% in 2018 (StatsSA, 2018).
South Africa has a high potential for investment attractiveness as opposed to other African countries. While its output is relatively poor for attracting direct investment as a result of advances due to infrastructure projects, the country still leads in terms of FDI inflows and this can be attributed to the Special Economic Zone (SEZ) programs (StatsSA, 2018). According to the World Investment Report (2019), the Musina/Makhado SEZ offers a strategic role in which investment can be drawn along the key North-South road in SADC. It further indicates that that top investors in this region were Beijing Automotive Industry, BMW, Nissan and mainstream renewable energy.
4 1.2 Statement of the problem
Developing countries have underlying challenges of slow economic growth and high rates of unemployment among other ills such as high poverty level, inequality and inflation. It has been established that while investment activities can positively influence growth, it can simultaneously provide employment opportunities to the citizens (Ncanywa & Makhenyane, 2016). Increasing public and private sector investment in the economy is the centre of job creation and development which means that further economic growth needs to be demanded to improve investment in the country (National Treasury, 2014). Open economies have active investment activities and their global markets have affected investment activities in the country (Maepa, 2015).
It is worth pointing out that both the SADC and BRICS regions were less successful in attracting investment activity. According to Arvanitis (2006) there are various reasons that attribute to the dismissal of investment activities such as small size of domestic economies, property rights, political instability, corporate taxes, exchange rate stabilities, low interest rates, to name a few. Hence, it was imperative to have a study that provides a comparative analysis of what can stimulate investment activities in the SADC and BRICS countries, more particularly because South Africa is part of both groups.
1.3 Research aim and objectives 1.3.1 Aim of the study
The aim of the study is to conduct a comparative analysis of BRICS countries and some selected SADC countries during the period from 2004 to 2019, on the determinants of fixed investment activities measured by real exchange rates, real interest rates and trade openness.
1.3.2 Objectives of the study
The objectives of the study are as follows:
To establish a short and long-term association between fixed investment and its determinants.
To provide a comparative analysis of the determinants of fixed investment between the BRICS and SADC groups.
5
To determine whether there is a causal relationship between investment and its determinants.
1.4 Research questions
Does fixed investment have a short-term and a long-term relationship with its determinants?
What is the causal relationship between fixed investment and its determinants?
What are the comparisons between BRICS and SADC in terms of fixed investment and its determinants?
1.5 Definition of concepts
The focus in this study is on investment (gross fixed capital formation), exchange rate, real interest rate and trade openness. The definitions in respect of these variables of interest are discussed below:
Fixed investment measured by gross fixed capital formation
It involves expenditure on fixed assets of the economy that have been added, plus remaining variations in inventories. Fixed assets take into account the acquisition of property (purchase of plants and equipment, creation of road infrastructures, railways and the like, including schools, workplaces, secluded houses and industrial profit- making structures). Inventory is the stock and work in progress of merchandises detained by corporations to encounter temporary or unexpected instabilities in creation or trades (World Bank, 2019). In the context of the study, gross fixed capital formation refers to investments made by both private and public sectors in SADC and BRICS.
Real effective exchange rate
It is a partisan regular proportion of adjustment at which one nation exchanges currency for a basket of multiple foreign currencies. This is often referred to as a measure of the international competitiveness of a country as regards the foreign exchange market (Korkmaz, 2013). In the context of the study, exchange rate refers to the currency of South African Rand and currencies of its other trading partners in the world (BRICS and SADC).
6
Real interest rate
Mohr & Fourie (2008) define interest rates as the prices of loanable funds, prices paid out to invested funds, lent out or even borrowed for various reasons for a certain period of time. It is conveyed as a portion of the funds invested where a contractor expects to earn an income.
Trade openness
Trade openness is explained by the World Bank (2019) as the frequent measure used to assess the importance of domestic transactions for international transactions. It is further explained by Huchet-Bourdon (2011) as a quantity of commercial procedures that either restrict or encourage trade amongst nations. This means countries are granted admittance to also import or export as they choose. In the context of the study, trade openness refers to the sum of the country’s exports and imports as a share of that country’s GDP in %.
1.6 Ethical considerations
The study employed secondary data, which is an incorporation of quantitative statistical analysis obtained from reliable sources. The study was executed considering the plagiarism policy of the University in order to maintain and uphold academic standards. Furthermore, the study is conducted in accordance with the University of Limpopo rules and regulations. The information presented is handled with honesty and integrity and all sources utilised have been referenced.
1.7 Significance of the study
This study adds value and contributes to the growing literature on the determinants of investment as there are limited studies on the determinants of investment activities particularly for BRICS and the SADC regions. In order to ensure relevance of the study, it is supported by analysed data that is collected on the determinants of investments on the countries concerned. Furthermore, the study is relevant in South Africa as it has uncompetitive exchange rate and trade openness that disables it to seize investment opportunities (Ncanywa et al, 2016).
It is worth pointing out, and this is a problem among member states, that both the SADC and BRICS regions were very weak in attracting investment activity. In SADC, Malawi recorded a lowest investment rate of 14.9% of GDP till 2019. Consequently,
7 Namibia and Lesotho had an investment rate of 24% and 34.7% respectively.
Mauritius has been consistent in its investments, however it fell since 2009 reaching an all-time low of 19% of GDP in 2014. Madagascar fell from the rate of 18.8% in 2010 to 14.9% of GDP in 2011. On the other hand South Africa account for less than the targeted 25% investment rate while Angola is leading in the whole region as its main investment go to the core oil field. The BRICS economies has India recording 36.5% of GDP in the period 2009-2010. Chinese investment fell from 20% of GDP in 2008 to 16% in 2016. Russia had a high average investment rate of 10.9% from 1999- 2004 whereas during its strong period of 2006-2009 16.9% was recorded. Investments in fixed assets of Brazil accounted for 15.5% of GDP in 2019 slightly up from 15.2% in 2018.
According to Arvanitis (2006) there are various reasons that attribute to the dismissal of investment activities such as small size of domestic economies, property rights, political instability, corporate taxes, exchange rate stabilities, low interest rates, to name a few. Considering that substantial investment in these economies should be made in order to obtain real benefits through trade liberalisation in different countries (Adams, 2009). Hence, it was imperative to have a study that provides a comparative analysis of what can stimulate investment activities in the SADC and BRICS countries, more particularly that South Africa is part of both groups.
1.8 Structure of the dissertation The dissertation is arranged as follows:
• Chapter 1 provided the orientation of the study.
• Chapter 2 reviews the trends in investment, trade openness, real exchange rate and real interest rates in the SADC and BRICS regions. It further examines the overview of the individual countries of these regions for the previous years and reforms that have been executed to enable a competitive investment environment.
• Chapter 3 reviews the theoretical framework and empirical literature review.
The theoretical framework discusses the theories of financial development and growth while the empirical literature reviews findings of other authors in SADC, BRICS and the rest of the world.
8
• Chapter 4 presents the methodology of the study which is the panel Johansen cointegration and Panel Autoregressive Distributed Lag (PARDL).
• Chapter 5 discusses the research findings from the econometrics tests performed in the study.
• Chapter 6 presents the conclusion and policy recommendation of the study.
9 CHAPTER 2
TRENDS OF INVESTMENT ACTIVITIES IN SADC AND BRICS 2.1 Introduction
This chapter aims to explore the outcomes on the behaviour of the determinants of investment in the regions together with the trends thereof. Furthermore, it will report on how South Africa has been performing in both regions as it is the main trading partner. This is mainly because, despite it being the main trading partner, the South African economy continues to be in shambles led by low economic growth and low investment.
2.2 The analysis of investment trends in SADC
Investment will assist initiatives and programs intended to advance the mandate for regional integration and economic growth of the SADC. Both through direct investment and bond trading, investment promotes companies’ profitable potential and allows them to succeed globally.
Investment has historically been poor due to political and security problems in the SADC region. However, in recent years such problems have been slowed down and thus attracted substantial investment by SADC policies to promote closer cooperation among member states. In most member states in the SADC region, direct investment continued to grow between 2004 and 2019. Though investment has declined dramatically in the midst of the global economic downturn in 2008, the fiscal incentives generated under the SADC advice still obtain funding for the region. Member states in particular Angola and South Africa, attract substantial investment from international countries with significant mineral industries. Further foreign direct investment is required to capitalise on the other markets and member states whose profitable capacity is not developed as the international economic environment is recovering.
10 Figure 2.1: Investment trends in SADC
Source: Author’s compilation from World Bank Data 2004-2019
South Africa
Investment activities in developed countries have a crucial role to play. South Africa under the apartheid regime has experienced slow investment and economic growth (Maphutha, 2018). There have been several changes in investment in the country and since 1994 there have been significant increases. More needs to be done to promote the investment climate in the country, as investment spending is below the 25% target (Bruggenman, 2009).
The low investment rate in South Africa was described as the main cause for under- optimized rates of growth. When programs are complete, the pace of funding infrastructure continues to taper. It has taken decades and made it impossible for investment plans to be carried out further (Lings, 2017). Institutional entities, including state companies, the private sector and the general government, make a significant contribution to the South African investment spending.The formation of gross fixed capital increased from the year 2000 to 2007 but has since declined. In spite of the financial recession from 2008 to 2009 public companies contributed more than ever since 2006 and were stable by the year 2017, although fluctuation appeared to be attributed to the world's erratic development (IDC, 2016).The government continues to cater for economic infrastructure and sustainable large-scale social infrastructure projects despite reductions in investment expenditures (schools, clinics, hospitals,
0 10 20 30 40 50 60 70 80 90
2004 2005 2006 2007 2008 2009 2010 2011 2012 2013 2014 2015 2016 2017 2018 2019 investment in locaal currency (Billions)
GFCF
S.A LESOTHO MALAWI ANGOLA
MADAGASCAR MAURITIUS NAMIBIA
11 etc.). With some R92.1 billion invested in 2006, education expenditure in South Africa continued to increase, recognizing that South Africa holds the highest levels of education investments in the world.
Angola
From the figure 2.1 above it is noted that between 2004 and 2008, the country enjoyed an upward trend in investment. Angola has been a leading SADC investment destination with an abundance of natural resources. As a result, the bulk of the investment go to the core oil field of the country. The nation has been placed in a good fiscal position with immense oil wealth. While this favourable economic situation provides the Angolan government with an excellent opportunity to make decisions on spending, Angola’s existing transport and logistics system remains a major challenge (Lings, 2017). The petroleum industry accounts for nearly 98% of global wages, according to the World Bank.
Malawi
Malawi has one of the lowest rates of investment in SADC with an average rate of 14.9 per cent of GDP between the period 2004 and 2017. Considerably lower from neighbouring countries which includes Namibia at 24.5 per cent and Lesotho at 34.7 per cent (IMF, 2018). This is mainly due to low private investment levels. In the past, macroeconomic instability undermined both public and private investment, which reduced the certainty for investors and boosted interest rates (Borhan and Ahmad, 2018).
Madagascar
As a consequence of the global economic downturn and the political crisis that led to the Island being isolated from the diplomatic scene, investment inflows in Madagascar decreased dramatically. Total investment fell from 18.8% of GDP in 2010 to 14.9% of GDP in 2011 as a result of reduced development assistance and the completion of the construction and installation phases of large-scale mining projects. The nation earned USD 227 million of inflows in 2019, down from USD 353 million in 2018, according to the UNCTAD World Investment Report 2020. In 2019, the stock of gross fixed capital formation rose to USD 7.7 billion. The government has introduced many measures to change the market environment, in particular, to draw investors. There are three reforms, namely, company creation, building licenses and trans-boundary trade.
Notwithstanding, there have been insufficient sustainable and high-quality
12 investments in specific economic zones. No statute bans or restricts foreign investment, however certain hurdles make it difficult for investment. Madagascar has great potential for nature, but weak and expensive service efficiency, low credit access and financial instruments, and poor land title concept are barriers to investment (Bilan and Ihnatov, 2015). Political instability and corruption blocked all government spending and forced many businessmen to flee. While the regulation treats multinational corporations for dubious taxations, labour or other purposes, they are also subjected to criminal investigation.
Namibia
The Gross Fixed Capital Formation (GFCF) (% GDP) contributed 34.1 per cent and 24.3 per cent in 2015 and 2016, respectively. GFCF is an important indicator of the potential future development of a country at a given point in time as a percentage of GDP. In 2015, GFCF decreased by 25.3 per cent, after posting significant growth in 8.6 per cent in 2015 as a result of declines in almost all industries, and the largest decline in real terms was from ND$ 16.0 billion in 2015 to ND$ 7.8 billion in 2016, indicating a 51.4 per cent decrease (Constant, 2010).
Lesotho
In 2018, Lesotho earned 9.044 million gross fixed capital formation. Lesotho’s investment climate assessment is aimed at evaluating and supporting policies to improve the private sector in the Lesotho investment climate, in all its organizational aspects. High capital spending boosted short-term growth, especially in the construction sector. Many of the capital expenditure increase after 2005 was geared to recruiting new private sector investment; until now it is not clear whether such public investment was effective in attaining its objectives. While institutional deficiencies in project selection, management and execution could have contributed to the poor results, slow progress in additional reforms to improve the investment climate may have affected the productivity of public investment. The Government has, for example, spent a lot on maintaining and improving health care, but its use remains small due to a lack of additional factors—most important, physicians and medicines.
Mauritius
As a percentage of GDP, Mauritius' GFCF has been consistent with trends in the global GFCF/GDP ratio. However, since the peak in 2009, the rate has been declining
13 and reached an all-time low of 19 per cent in 2014. In contrast to rapid-growth Asian economies, these investment rates are exceptionally poor. The ratio between GFCF and GDP illustrates how much added value has been invested and not consumed in total domestic output. This trend could severely reduce the competitiveness space.
Over the years, FDI's participation in the GFCF has evolved to 22% by 2012. This peak was however accompanied by a major decrease in 2013, when FDI contributed 10 per cent in the GFCF.
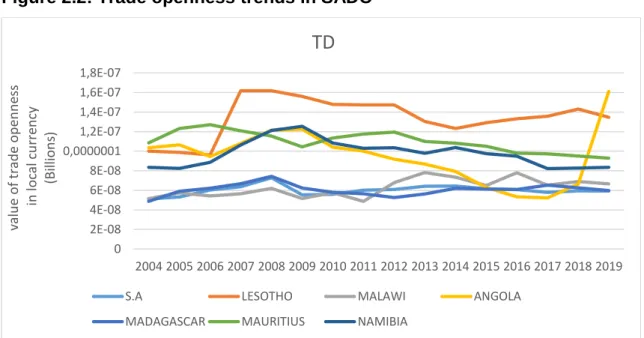
Figure 2.2: Trade openness trends in SADC
Source: Authors compilation from World Bank Data 2004-2019
Angola
The poor market climate in Angola often impedes industrial development, while an insufficient institutional structure hinders diversification of the economy. Angola is considered to have the lowest ranking in terms of the facilities for doing business in the SADC region. This ranking is attributed to a lack of contractual compliance, dysfunctional fiscal bureaucracy and concerns with the launch of a new company.
Since the country is a SADC participant, regional trade should be growing, and it aims to become a significant provider to its landlocked neighbouring countries. This is of considerable significance for the country.
Malawi
Taking account of the country’s free exchange, Malawi imports from South Africa amount to 22 per cent of the country’s GDP and fuel was the largest import in 2012
0 2E-08 4E-08 6E-08 8E-08 0,0000001 1,2E-07 1,4E-07 1,6E-07 1,8E-07
2004 2005 2006 2007 2008 2009 2010 2011 2012 2013 2014 2015 2016 2017 2018 2019 value of trade openness in local currency (Billions)
TD
S.A LESOTHO MALAWI ANGOLA
MADAGASCAR MAURITIUS NAMIBIA
14 covering 13 per cent of all imports. The main imports representing 30 per cent of all SADC imports were Malawi imports of products worth $1.2 billion from SADC (42 per cent of the world) and petrol. Malawi exports to the SADC (19 per cent of the world) products worth US$0.2 billion and cereals are the main exports representing sixteen percent of all SADC exports (Ministry of trade and industry, 2012). Total imports in Malawi rose by 74 per cent in 2011 to an incredible $2.7 billion at end of 2012, while exports only increased by 31 per cent in 2011 to $1.3 million in USD (Ministry of trade and industry, 2011). The trade balance does not only seem to have weakened because input (which is inputs) is costly, but also because the nation imports are getting much more expensive at flexible exchange rates. A non-transparent and unpredictable market climate benefits firms with long-standing, policy-based networks in service of larger businesses. This is partially because of the lingering legacy of the strong state interference, which exacerbates obstacles to new companies’ entrance into, and progress that can lead to export diversification and economic growth.
Regulatory shortcomings benefit businesses with large networks that allow diverse risks to be mitigated. Greater initiatives would be required in order to simplify and make it easier to satisfy regulatory and licensing standards in particular. Regulatory mechanism in the industry must therefore facilitate a fair playing field and foster long- term investment.
Madagascar
About 63 per cent of Madagascar’s GDP is foreign trade, a country which collects large amounts of its income in the form of customs duty, importation duties and imported VAT. Madagascar is the world’s 25th biggest exporting economy. The nation is also a member of the WTO, COMESA and SADC. Therefore, there are no big non-tariff obstacles. Moreover, most goods can be purchased without a certificate for imports.
Vanilla (27.9%), raw nickel (13.4%), cobalt matt (7.2%), cloves and entire fruits (4.7%) and clothes were primarily exported throughout the United States at a tariff rate of 4.3 per cent. Its major imports include gasoline (15.2%), rice (6%), automobiles (4.2%), medical goods (2.3%) and palm oil (1.8%). Madagascar faces high shipping costs, much as other Island nations. The lack of well-developed infrastructure makes market activities costly and impedes competition of the private sector. The trade balance in the country has historically been negative and this tendency continues to drive space exports amid steady growth in exports. In 2018, the trade balance of Madagascar rose
15 once again to $458 million, up from $450 million in 2017 (World Bank, 2018). Rising imports of public investment capital goods have raised the trade deficit as vanilla prices have dropped. In 2018, exports of goods amounted to US dollars of about 3.05 billion (+7% as compared to 2017), while imports hit US dollars 4.03 billion (+10%).
Service exports were USD 1.24 billion (+9%) and imports were USD 1.09 billion (+12 percent) relative to 2017 (World Trade Organisation, 2019).
Namibia
Namibia also has close ties with its southern neighbour through strong trading links apart from monetary-policy links with South Africa. Almost 60% of its total goods were imported from South Africa by Namibia in 2016. At the same time, Namibia's dominant diamond export declined nearly 25% in 2016, in addition to a 19% decline in 2015.
Diamonds accounted for only less than 30% of total exports, with second-class fish exports accounting for 16.5% of the country's total exports.
Mauritius
According to the International Finance Corporation Doing Business Report (2016), Mauritius is ranked 49th in the world. The Mauritian economy was driven by foreign trade. Trade openness remained high, and there was a rise in GDP per capita between 2004 and 2014. In 2006, trade opening stabilized at approximately 111% since 2011, after a GDP of 131.4% (114.5% in 2014). Mauritius' level of transparency seems to have faded and has even deteriorated in the last few years. Although that's normal with GDP rises above critical mass, Mauritius' marginal decline is starting to take into account its desire for export-led growth, increasing the issue of Mauritius' trade competitiveness.
Lesotho
Lesotho is focused on its economic growth trajectory in South Africa. Since Lesotho is a member and its trade policies are aligned with those of the South African Customs Union (SACU). It also belongs to the Common Monetary Area (CMA), which affects and directs the monetary policy. The main trade partner for Lesotho is South Africa which provides almost 90% of all imported products. More than 50% of exports are for South Africa and the rest is for the United States (US) and the European Union (EU).
In 2010, Lesotho ranked 137 out of 183 countries with regard to the ease of doing business, tumbling to 138 in 2011, according to the World Bank doing business
16 indicators. Between 2010 and 2011, Lesotho reported improvements in only two indicators, cross-border trade and closure of a business, while all other indicators decreased. On the starting measure, Lesotho decreased from the 140th place in 2010 to 134th place in 2011 in six places. Lesotho ranks 11th in relation to the 15 countries of the SADC. In terms of the global competitiveness index, Lesotho ranked 107th in 2009-2010 before falling to 128 in 2010-2011. Out of the 145 countries in 2011/2012, Lesotho stayed down to 135. Notably, Lesotho ranks 14 out of 15 SADC countries.
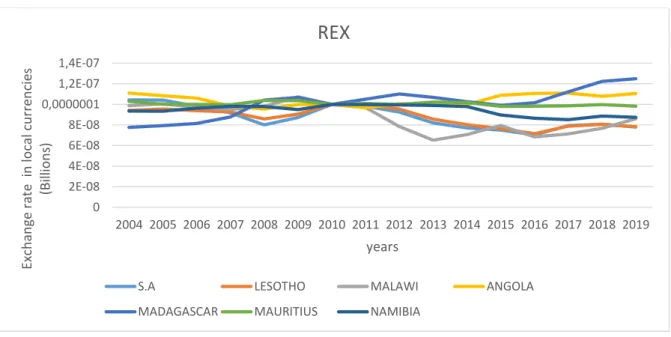
Figure 2.3: Real exchange rate trends in SADC
Source: Author’s compilation from World Bank Data 2004-2019
Namibia
The Namibian Dollar/South African Rand traded favourably between 2015 and 2016 with major currencies like the US dollar, the United Kingdom Pound and the Euro. The appreciation of the US dollar, the British pound and the euro by 5.7, 22.7 and 9.9 percent year-over-year, respectively, demonstrates that. The appreciation is due to basic effects and a moderate upsurge in the rate of commodities. In 2017, the Namibian dollar averaged the US Dollar, British Pound and Euro traded N$13.3, N$17.2 and N$15.1. Imports to Namibia (i.e. machinery, foodstuffs, etc.) are cheaper when appreciating the Namibia dollar, while Namibian exports are expensive (i.e.
foodstuffs, mineral products, etc).
0 2E-08 4E-08 6E-08 8E-08 0,0000001 1,2E-07 1,4E-07
2004 2005 2006 2007 2008 2009 2010 2011 2012 2013 2014 2015 2016 2017 2018 2019
Exchange rate in local currencies (Billions)
years
REX
S.A LESOTHO MALAWI ANGOLA
MADAGASCAR MAURITIUS NAMIBIA
17
Malawi
About 751 US dollars were exchanged in May 2019 by the Malawian Kwacha. This is a median depreciation over the same period in 2018 of roughly MK 731/US$. The Kwacha stood against the euro and the British Pound in contrast with other currencies.
Lesotho
Lesotho is required to align monetary and monetary policies with those of the South African Reserve Bank by being a member of the common monetary area (CMA) (SARB). The loti is attached to the floating currency of South Africa that is also legal in Lesotho. The Lesotho Government has been able to maintain adequate levels of global reserves, normally an aggregate of 5-6 months of imports, to defend the loti/rand peg. The international reserves of the country have decreased to 4, 2 months since 2016, and in the next three years they are expected to fall further to below 3, 5 months. This decrease causes concern because loti and rand parity are in jeopardy in the medium term. Repo is used as its main monetary-policy instrument by the central bank of Lesotho (CBL), even though the rate is closely aligned with the Repo rate for South Africa in preventing volatile capital flows. However, the CBL introduced a banking rate in December 2015 that was intended to be a reference and an anchor to other domestic interest rates. The policy rate helps the Central Bank achieve its ultimate price stability objective. It supplements other monetary instruments, i.e.
treasury loans and the reserve ratio required. However, the money supply, which is broadly defined, increased in 2017 and is expected to grow further in 2018, largely due to an expansion of private lending (Mehrara, 2013).
Figure 2.4: Real interest rates trends in SADC
In a number of emerging and developed countries, actual interest rates have been negative since the 2008/09 global financial crisis because nominal rates were near zero and inflation rates stayed positive and nearly constant, although at historic low levels (in most countries, at least on average).
18 Source: Author’s compilation from World Bank Data 2004-2019
South Africa
After the reserve bank declared its inflation targeting in 2002, a rise occurred as the rate was used as an inflationary instrument. Moreover, the rise was due to a monetary recession in those years which forced the SARB to lift the interest rate to balance the economy and the currency. For the first time in 2008, since inflation control was implemented in 2002, the interest rate was over 15%. The explanation is that in 2008, global financial crisis impacted many economies around the world and resulted in a decrease in spending in many countries in the developed world. The interest rate in South Africa has fluctuated between 7% and 10% from 2010 to 2015.
Namibia
In 2016, the average repo rate in 2016 was 7.0% and in 2017, it fell to 6.75%. In order to promote domestic economic growth and keep the South African Rand one by one, the repo rate levels are considered appropriate. Likewise, in the third quarter 2017, the average primary lending rate of 10.75 in 2016 fell to 10.5%. Those developments stemming from the monetary policy declarations of the Bank of Namibia are a good boost to the much necessary economic growth.
-20 -10 0 10 20 30 40 50 60
Real interest rate as % of GDP
Years
RIR
MADAGASCAR LESOTHO MALAWI ANGOLA
S.A MAURITIUS NAMIBIA
19
Lesotho
As of 2018, the value of the real interest rates in Lesotho stood at a value of 6.67%
with a historic indication of the value reaching 22.97% in 1982 and a minimum value of -21.53% in 1980. From 1980 till 2019, the average value stood at 14.69% whereas in 2013 it stood at a minimum of 9.92%. Lesotho's current business environment has weakened, in part due to political difficulties in 2014 when the first coalition government of Lesotho collapsed, although elections in February 2015 were held early on and tensions continued to smoothly transition to a new coalition government. The Lesotho implementation of the national strategic development plan stalled and investment has slowed down in this environment. Some development partners have also diminished their financial support.
Angola
The interest rate in Angola shows a growing trend over the years. But after the global financial crisis knocked out most countries in 2008 and 2009, Angola does not vary from the countries impacted by this global financial crisis as a developed world. It showed a substantial decrease and hit less than 5 percent in 2011.
2.3 The analysis of investment activities in BRICS
The five emerging markets of Brazil, Russia, India, China, and South Africa offer companies a wide range of opportunities to spread / integrate the region in their growing economies, increased revenues, and expanding population. Increased demand is critical to the growth of these economies. The advantages and disadvantages of these nations, however, are distinct.
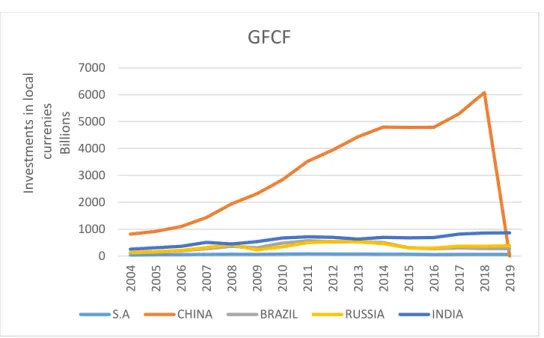
20 Figure 2.5 Investment trends in BRICS
Source: author’s compilation from World Bank 2004-2019
South Africa
Figure 2.5 displays the quarterly estimates for South African investment activities. The only industry that led to investment activities during the financial crisis was public corporations; the private sector contracted from the third quarter of 2008. Investment hit undesirable mark in 2009, suggesting a low degree of consumer confidence and saw only negative growth in 2016. Public companies increased in 2014 as a result of the tough negative growth in 2013. Investment has been rising as shown, but at a sluggish pace. There was no positive flow after 2015 and 2016 reveals that there is only a slow rise in infrastructure investments. Private sector enterprises announced a sharp fall in real terms of around 2.6 per cent in 2016 after the year-on-year decline.
The contribution of the private sector to investment spending is in stagnation, dipping by almost -5.8% in 2016, following a decrease of -4.3% in 2015. Lings (2017) suggests that capital formation rose by 1.2 per cent in the first three months of 2017, but there was a downturn stemming from the reshuffling of the cabinet and the downgrade of the credit rating.
In the South African economy, however slow, investment activities have played a range of roles (infrastructure improvement and replacement, educational needs), but they may hinder investment prospects for the immediate future. In order to increase investor interest and achieve the priority set, South Africa must achieve and maintain
0 1000 2000 3000 4000 5000 6000 7000
2004 2005 2006 2007 2008 2009 2010 2011 2012 2013 2014 2015 2016 2017 2018 2019
Investments in local currenies Billions
GFCF
S.A CHINA BRAZIL RUSSIA INDIA
21 its investment target of 25% for GDP (The Presidency, 2014). As investment decisions are affected by a diverse development of industry and the economy as a whole, investment activities are influenced by competitive environments in the region. More needs to be done to foster a robust investment environment in South Africa. The investment ratio continued to fluctuate more and fewer than the optimum 25% needed for investment activities by the government, businesses and individuals.
Brazil
Brazil has reported USD 67,820bn in Dec 2020 for Gross Fixed Capital Formation.
This is an increase over Sep 2020's previous figure of USD 56,930 billion. The figure of Gross Fixed Capital Training in Brazil is quarterly updated with an average of 59,199 USD bn between March 1995 and December 2020. In Sep 2011, the figure reached an all-time high of USD 144,940 billion, and in December 2002 a record low of USD 19,226 billion.
Russia
The negative factor for Russia is a small demand for services from major investors like the government, the people and the private sector offered by building companies.
Construction industry profitability has remained at a low level of 3.7 percent, but the average in Russia is 8.1 percent. Unless they prefer to fall prices in the industry, contractors do not have the option of changing the situation. Nevertheless, the number of operating construction companies increased by 207 percent during the period between 2000 and 2016.
India
The importance of the formation of gross capital is that this part of GDP contributes to the growth of GDP itself. This is a must to achieve a high production rate, the formation of capital and changes in production techniques and the people's perspectives. In India, 36.5 per cent of GDP was the gross capital for the period 2009-10. In the public sector it was 9.2 percent and in the private sector it was 24.9 percent. The household sector investment was 11.7%. Company industry investment amounted to 13.2%.
22
China
Equipment and construction trends in China have varied significantly. Equipment prices decreased annually between 2004 and 2016 by 1.1%, with building prices up by 2.7%. These major differences in price movements mean that a price index that uses the equipment and construction expenditure for base term shares gradually resembles an index based solely on the cost of expenses in construction. The extent of the price movement differences between the four capital formation sectors which are to reflect various shares of construction and equipment in each sector will therefore be underestimated. In addition, the value share in the overall fixed asset investment of different types of assets has remained stable over time. As a result, the fixed asset investment price index of the industries was calculated by assuming that the investments of the different types of assets were consistent by sector. There has been a shift from business investment to housing and infrastructure investments. This has been driven by a number of influences. The investment rate in the business sector is critically influenced by the economy's expected growth. A decrease in the expected economic growth rate will lead to the decrease of investment for the business sector until a level reaches that again makes capital inventory growth consistent with the lower forecast economic growth. In fact, from around 9.6 percent to about 6.7 percent, economic growth slowed from 2008 to 2016. With growth declining, companies reduced their anticipated capital requirement, and this led to a sharp drop in the amount of investment in business sector from an estimated 20% of GDP in 2008 to 16% in 2016.
Figure 2.6: Trade openness trends in BRICS
Over the course of the economic reform era, China has a relatively high investment to output ratio that surpassed almost any other economic, developed or developing nations. In fact, the high investment rate is a significant proximate driver of China’s high growth rate.
23 Source: Author’s compilation from World Bank Data 2004-2019
South Africa
The overall South African trade with its BRICS counterparts rose from USD 3.1 billion in 2001 to USD 28.9 billion in 2016 from the highest level of 39 billion dollars in 2013.
Although the number of exports from South Africa to these trading partners has declined briefly since 2013, recent trade figures show an increase again, especially in connection with export of raw materials, produced goods and chemicals to China.
Their global imports were 25.2% higher than the previous year in January 2017 and commodity prices recovered, which led to the rise in mining output.
Brazil
Brazil constantly records trade surpluses mostly due to the strong export of mining and agriculture goods, from the beginning of 2000 to 2012 and between 2015 and 2017. South Africa posted the highest trade surpluses in 2018. In November 2020, trade surplus in Brazil increased to USD 3.73 billion, relative to the market estimate of USD 4.79 billion. Exports dropped by 1.2% to USD 17.53 billion from 2019 while imports plummeted quicker by 2.6% to USD 13.79 billion during the same period.
China
With China opening up to the world and particularly after its WTO entry in 2001, benefit prospects generated additional investment demand by expanding exports. High export gains could be accomplished, partly by imbalances created by trade barriers and partly by Chinese currency undervalued. Exports may, however, surpass their role; domestic
0 10 20 30 40 50 60 70 80
Trade openness in local currency (Billions)
TD
S.A CHINA BRAZIL RUSSIA INDIA
24 added value is only about half the export value. As a result, in 2007 export added value accounted for about 18% of GDP. Potential investors ought to believe that their contributions will be properly compensated. Trust in the protection of their property and their business arrangement could be important. Such trust may be gained either through the formal legal framework or through informal alternatives.
India
India experienced a slow growth rate, particularly after 2008-2009 due to the global financial crisis. Investing by international institutional investors and non-resident Indians in terms of foreign direct investment has been limited due to a financial crisis.
The trade output in India has been significantly impaired by the downturn in exports and rising imports, which have resulted in a growing current account deficit and low investment rates.
Russia
Russia's external trade exposure can be measured by a trade open-ended indicator, usually expressed in terms of purchasing power parity, which refers to the ratio between total exports and imports in the GDP. The values of this ratio are generally influenced by several endogenous factors, especially the territory and economy dimension and the gap between each country's major or dynamic markets and the changes in its economic growth and trade shocks. Russia's broad regional differences are, moreover, structurally similar to landlocked regions, while others show greater commercial openness as a result of their considerable natural resource exportable. In addition, Russia's broad regional disparities are structurally similar to landlocked countries in some areas while others are more open to trade because of their significant natural exportable resources or their proximity to foreign markets. Overall, the trading turnover/GDP ratio of Russia remains lower than that of the OECD or transitional economies. Russia has increased openness in recent years, but at a slower pace than in other transition countries and China in particular. Russia still has a modest current share in world trade: in 2003 it ranked 17th among the world's leading exporting companies, representing 1.8% of global exports. Russia's exports were 45.14 million dollars in 2004, 8.4 per cent in 2004, 61.8 million dollars in total and 1.5 per cent in total exports by 2013.
25 Figure 2.7: Real exchange rate trends in BRICS
Source: Author’s compilation from World Bank Data 2004-2019
Russia
Russian economy was no immortal to the impact of the world financial crisis which had a negative impact on many economies. The mild rouble exchange rate depreciation strategy came to an end in March 2009, with the currency band hitting RUR 38-41 in a USD/EUR basket, compared to RUR 29-30 in a 2008 basket. The Russian Federation's monetary authority floated the band in early 2010, and it reached RUR 33.7-36.7 per basket in April 2010 due to world prices of Russian main export commodity items.
China
The lower RMB exchange rates are thought to have stimulated China's growth but harmed the economies of its trading partners. Renminbi (RMB) has indeed since 1994 been appreciated by nearly 38% but still does not meet the expectations of trading partners. The slow pace of RMB appreciation was criticized by the international community. The exchange rate of the RMB appears to have played an important role in boosting the Chinese economy, and so trade partners are pressing Chinese governments more and more to appreciate the currency and make the exchange rates in China more flexible and tradable.
0 2E-08 4E-08 6E-08 8E-08 0,0000001 1,2E-07 1,4E-07
Exchange rate in local currencies (Billions)
years
REX
S.A CHINA BRAZIL RUSSIA INDIA
26
India
After deregulation, the exchange rate of rupee was mostly managed by the floating regime that from time to time intervened in the stabilization of the nominal Exchange Rate by the Reserve Bank of India (RBI). Clearly, despite an appreciation of around 1.4% in the real effective exchange rate of India over the 2000-2010 period, exports grew highly (with the exception of the post-crisis period of 2009 when there was a sharp depreciation). While exchange rate appreciation of Indian export expenditures rose rapidly after 2000, it does not necessarily imply a decline in exchange rate appreciation. Without exchange rate appreciation, the export growth rate could have risen.
Brazil
When the global financial crisis of 2008 struck, Brazil's resilience was demonstrated.
The country was affected by the rapid drop in commodity prices and the financial market strain.Brazil has been able to implement countercyclical measures for the first time in its history during the global financial crisis. Brazil had sufficient buffers to weather the storm by rising government expenditure and interest rate reduction rather than needing to impose stricter fiscal and monetary policies, which had previously been needed to maintain trust. After the completion of the real bond to the US dollar in 1998, Brazil had a managed floating exchange rate system.Due to the extremely loose western currency policies and high oil prices, exchange rate pressures have risen sharplyin the last few years. The government worked hard to safeguard the attractiveness of native producers to reduce the appreciation of the reality and therefore make the real currency a profoundly accomplished one. It used not only exchange-rate interventions, it also imposed several capital controls, for instance portfolio fees, to limit capital inflows. It also imposed a number of capital controls.
These restrictions have recently been removed because the government has become worried about the sharp depreciation after a curbing monetary stimulus by the US Federal Reserve has begun to anticipate the financial markets. The central bank has established stock in abundance of foreign reserves in the last decade. This stock was USD 367 billion in August 2013 and equals approximately import for 14 months and nearly all Brazil's external liability. The central bank nowadays arbitrates primarily with swaps in monetary markets.