THE EFFECTS OF GOVERNMENT STOCK ON INVESTMENT ACTIVITY IN BRICS COUNTRIES
by
DINTUKU MAGGIE KGOMO
Submitted in fulfilment of the requirements for the degree of MASTER OF COMMERCE
IN ECONOMICS in the
FACULTY OF MANAGEMENT AND LAW (School of Economics and Management)
at the
UNIVERSITY OF LIMPOPO
SUPERVISOR: PROF T. NCANYWA 2019
ii DECLARATION
I hereby declare that the above mentioned dissertation is my own work, that all the sources used or quoted have been identified and acknowledged by means of references. It has not been previously submitted to another university for any qualification. The University of Limpopo manual for postgraduate research was followed.
FULL NAMES AND SURNAME: DINTUKU MAGGIE KGOMO DATE: 08 FEBRUARY 2019
iii ACKNOWLEDGEMENTS
I give all glory and hope to the Lord God Almighty - He Who is above all things. The Giver of pure life, wisdom, sound mind, strength, courage and sustenance. By His grace and guidance, I managed to complete this project. The book of Philippians 1 verse 6 expresses my gratitude succinctly.
I would also like to extend heartfelt appreciation to a number of people who influenced the quality of this work. Firstly, I genuinely appreciate my supervisor Prof T. Ncanywa for providing guidance and support throughout this research. Secondly, my parents and siblings for being there from the beginning and continuously praying for me. Lastly, all my friends and colleagues for constantly critiquing my judgement.
iv DEDICATION
I dedicate this dissertation to my parents, Mr Kwena E. and Mrs Mmaphala S. Kgomo, for always supporting and encouraging me through this journey of life. If it were not for their prayers, love and support, I would not have made it.
v ABSTRACT
Financial markets and quite a diverse number of financial instruments have been growing in a controlled manner in recent decades in terms of value and volume. Brazil, Russia, India, China and South Africa (BRICS) are distinguished as having the fast growing markets in the universe compared to other markets of emerging economies, according to their promising economic prospective and demographic power. This study investigated the effects of government stock on investment activity in BRICS countries.
This study used panel autoregressive distributed lag model (PARDL), Engel-Granger causality test, impulse response functions (IRF) and variance decomposition tests. Such techniques were applied to the annual data for the periods 2001 to 2016 in order to determine the effects of government stock on investment activity. The variables (government stock on bonds, government stock on mutual banks, government stock on corporations and government stock on liquid assets), including gross fixed capital formation which is a measure of investment activity, were subjected to panel unit root tests and that confirmed different orders of cointegration. The existence of a long run relationship between investment activity and other macroeconomic variables used in this study was determined by means of the panel cointegration tests, where one lag was used.
The PARDL showed that in the long run investment activity was positively influenced by government stock on mutual banks and government stock on liquid assets, and negatively related to government stock on bonds and government stock on corporations. The Engel-Granger causality test revealed existence of unidirectional movement between investment activity and government stock on corporations as well as from government stock on bonds to liquid assets. The impulse response function test showed the impulse percentage of fluctuation that the variables did contribute to each other, from various periods both in the short and long run. While the variance decomposition of investment indicated that Investment was shocked by its own innovations throughout all the periods. A critical evaluation is needed to avoid investment shocks, instability of investment activity, instability of financial markets and the economy as a whole.
vi Keywords: BRICS, Investment, Government stock, PARDL, Engel Granger, Impulse Response
vii TABLE OF CONTENTS
DECLARATION ...ii
ACKNOWLEDGEMENTS ... iii
DEDICATION ...iv
ABSTRACT ... v
LIST OF FIGURES ...xi
LIST OF TABLES ... xii
LIST OF ACRONYMS ... xiii
CHAPTER ONE ... 1
ORIENTATION OF THE STUDY... 1
1.1 Introduction and background ... 1
1.2 Statement of the problem ... 3
1.3 Research aim and objectives ... 3
1.4 Research questions ... 4
1.5 Significance of the study ... 4
1.6 Definition of concepts ... 5
1.7 Ethical consideration ... 6
1.8 Structure of dissertation ... 6
CHAPTER TWO ... 8
LITERATURE REVIEW ... 8
2.1 Introduction ... 8
2.2 Theoretical framework ... 8
2.2.1 Keynes Theory of Investment ... 8
2.2.2 Neoclassical Theory of Investment Behaviour ... 9
viii
2.2.3 Tobin’s Q Theory of Investment Behaviour ... 11
2.2.4 Financial Theory of Investment Behaviour ... 12
2.3 Empirical literature ... 13
2.3.1 Estimation of government stock on investment activity ... 13
2.3.2 Long-run relationship between government stock and investment activity ... 16
2.3.3 Causal relationship between government stock and investment activity... 17
2.4 Overview of the BRICS economy ... 18
2.4.1 Trends in gross fixed capital formation ... 18
2.4.2 Trend of the indicators of government stock (2010-2016) ... 20
2.5 Overview of the individual BRICS countries government stock ... 28
2.5.1 Brazil ... 28
2.5.2 Russia ... 29
2.5.3 India ... 30
2.5.4 China ... 31
2.5.5 South Africa ... 32
2.6 Conclusion ... 33
CHAPTER THREE ... 34
RESEARCH METHODOLOGY ... 34
3.1 Introduction ... 34
3.2 Data ... 34
3.3 Model specification ... 36
3.4 Estimation techniques ... 38
3.4.1 Panel unit root test ... 38
3.4.2 Lag length criteria ... 43
3.4.3 Panel cointegration test ... 43
ix
3.4.4 Panel Autoregressive Distributed Lag (PARDL) model ... 48
3.4.5 Engel-Granger causality test ... 49
3.4.6 Diagnostic tests ... 50
3.4.6.1 Normality test ... 50
3.4.6.2 Serial correlation testing ... 51
3.4.7 Impulse response function and variance decomposition ... 52
3.5 Conclusion ... 52
CHAPTER FOUR ... 54
EMPIRICAL RESULTS AND DISCUSSIONS ... 54
4.1 Introduction ... 54
4.2 Empirical test results ... 54
4.2.1 Panel unit root test results ... 54
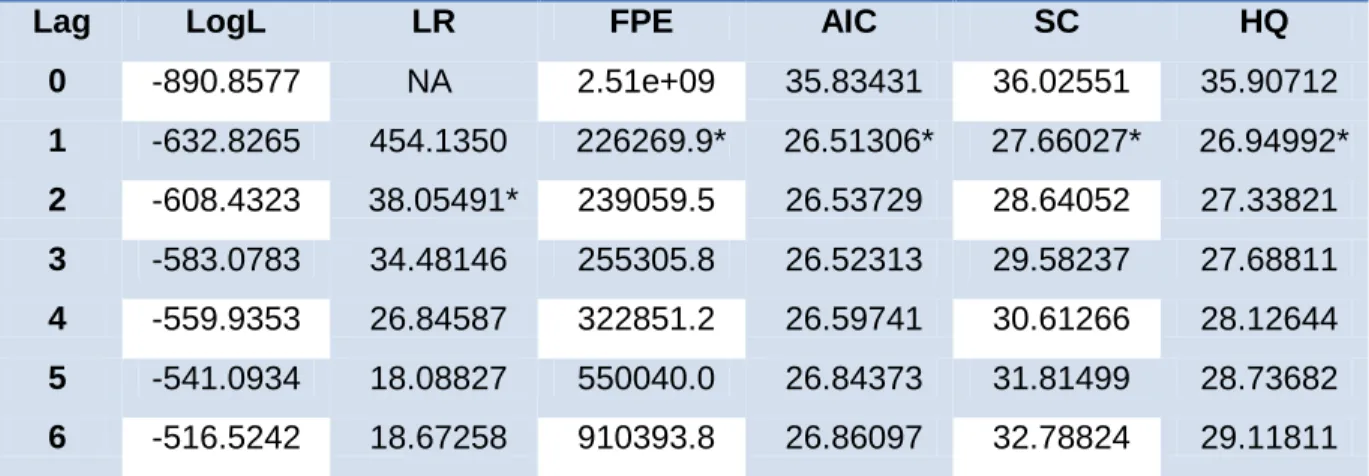
4.2.2 Lag length criteria results ... 62
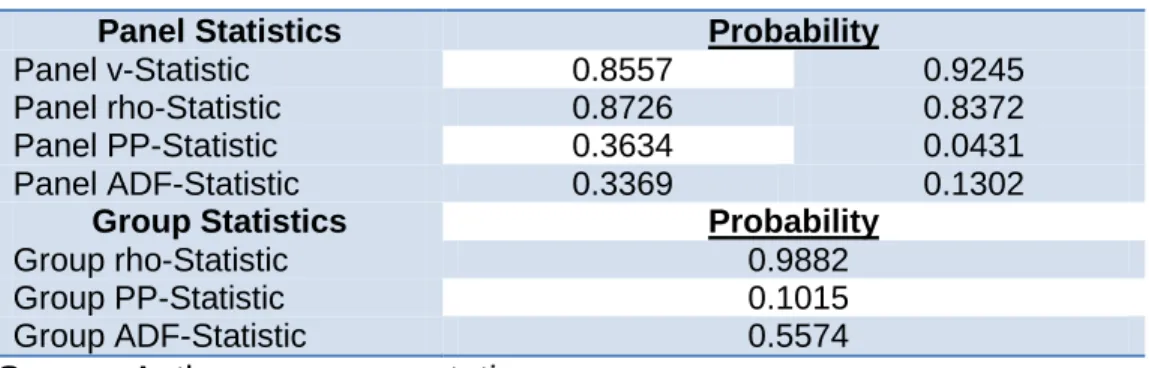
4.2.3 Panel cointegration test results ... 63
4.2.4 Panel Autoregressive Distributed Lag (PARDL) model results ... 67
4.2.5 Engel-Granger causality test results ... 70
4.2.6 Diagnostic test results ... 71
4.2.7 Impulse response function and variance decomposition results ... 73
4.3 Conclusion ... 76
CHAPTER FIVE ... 79
CONCLUSION AND RECOMMENDATIONS ... 79
5.1 Summary and interpretation of findings ... 79
5.2 Conclusion ... 80
5.3 Recommendation of the study ... 81
5.4 Limitations of the study ... 82
x
5.5 Areas of future research ... 82
REFERENCES ... 83
APPENDICES ... 95
Appendix A ... 95
Appendix B ... 97
Appendix C ... 111
Appendix D ... 112
Appendix E ... 119
Appendix F ... 120
Appendix G ... 121
Appendix H ... 122
xi LIST OF FIGURES
Figure 2.1: Gross Fixed Capital Formation (% of GDP) 18
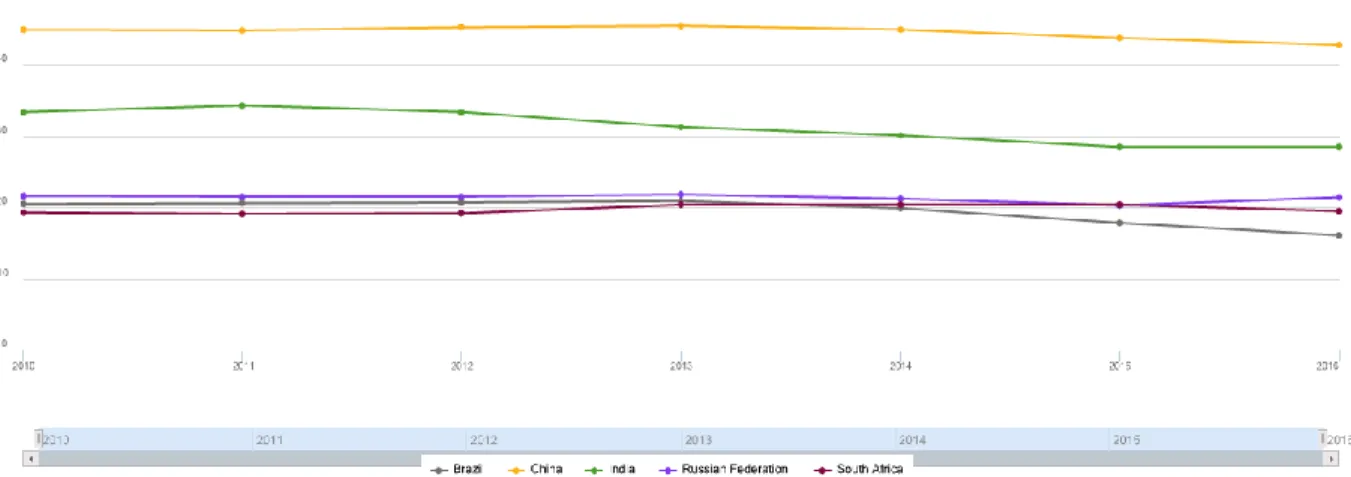
Figure 2.2: Government stock on bonds 21
Figure 2.3: Government stock on mutual banks 24
Figure 2.4: Government stock on corporations 26
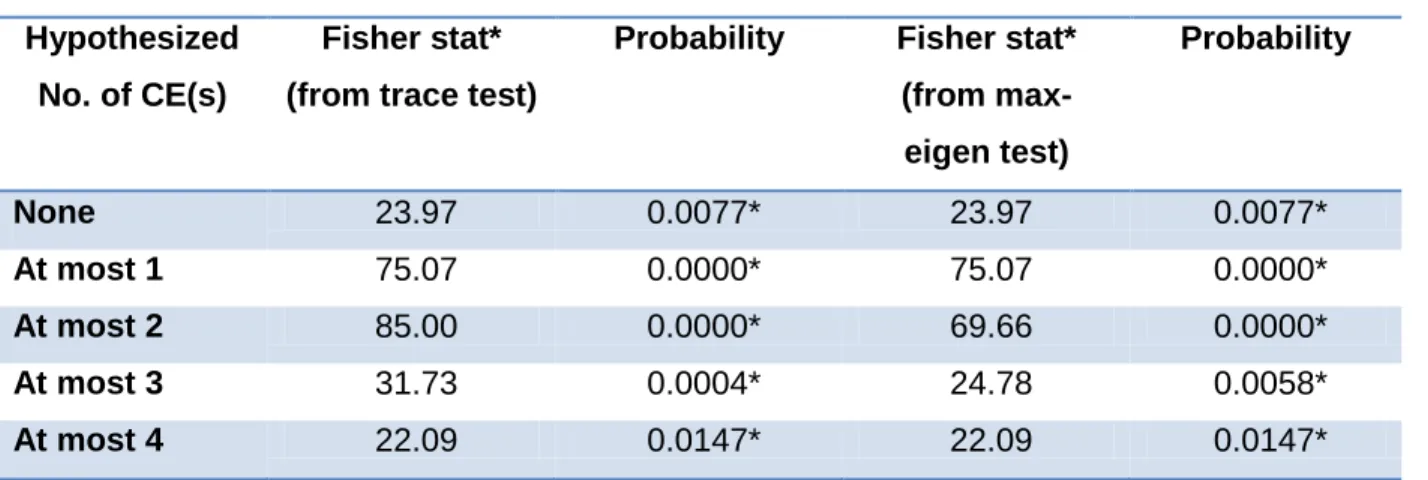
Figure 2.5: Government stock on liquid assets (% of GDP) 27 Figure 4.1: Informal panel unit root tests (Visualisation of graphs) 55
Figure 4.2: Jarque-Bera normality results 72
Figure 4.3: IRF graphs 74
xii LIST OF TABLES
Table 4.1: Formal panel unit root tests results 57
Table 4.2: Lag length results 62
Table 4.3: Panel Johansen cointegration test results 63
Table 4.4: Pedroni panel cointegration test results 64
Table 4.5: Kao panel cointegration test results 64
Table 4.6: Johansen-Fisher panel cointegration test results 65
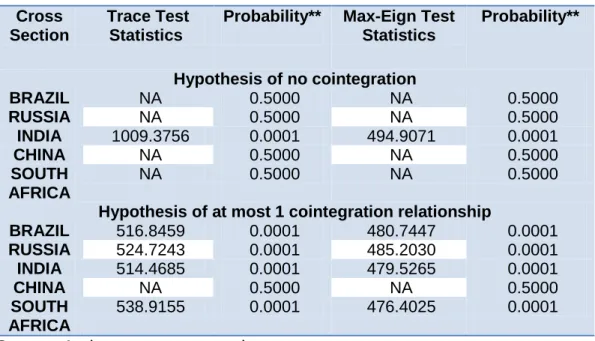
Table 4.7: Individual cross section results 66
Table 4.8: PARDL results 67
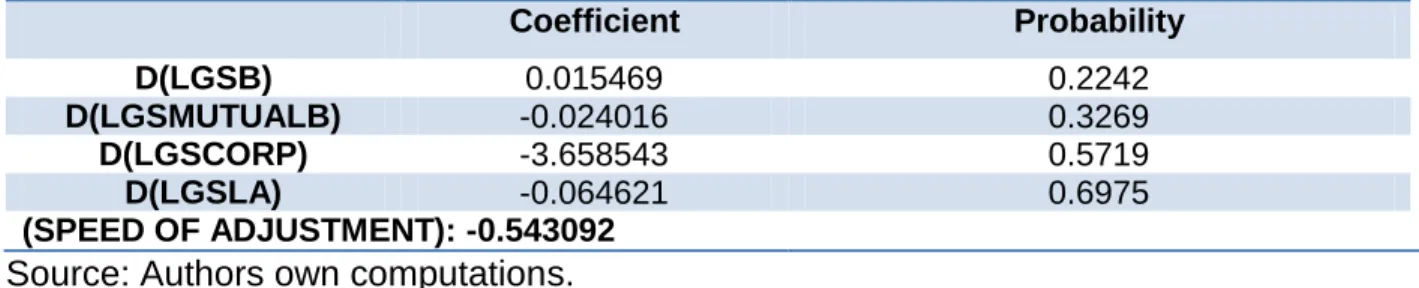
Table 4.9: PARDL short run results 69
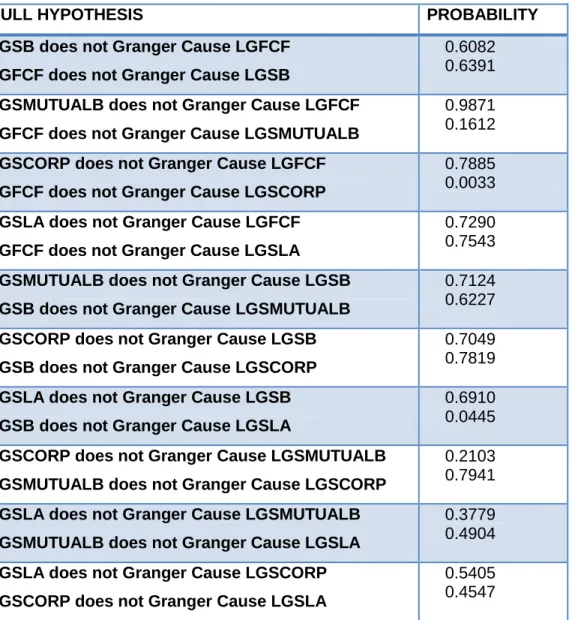
Table 4.10: Engel-Granger causality results 70
Table 4.11: Autocorrelation LM test results 72
Table 4.12: Variance decomposition results 75
xiii LIST OF ACRONYMS
BRICS: Brazil, Russia, India, China and South Africa BRIC: Brazil, Russia, India and China
GDP: Gross Domestic Product GFCF: Gross Fixed Capital Formation GSB: Government Stock on Bonds
GSMUTUALB: Government Stock on Mutual Banks GSCORP: Government Stock on Corporations GSLA: Government Stock on Liquid Assets U.S: United States
FDI: Foreign Direct Investments IPI: Industrial Production Index VECM: Vector Error Correction Model
ASEAN: Association of South East Asian Nations VAR: Vector Auto-Regressive
BRL: Brazil Real RUB: Russian Ruble INR: Indian Rupee
CNY HML: Chinese Yuan Hundred Million ZAR: South African Rand
xiv VBS: Venda Building Society
JSE: Johannesburg Stock Exchange CEO: Chief Executive Officer
SME: Small and Medium Enterprises PP: Purchasing-Power Parity EFM: Emerging Financial Markets
PARDL: Panel Autoregressive Distributed Lag IRF: Impulse Response Function
ADF: Augmented Dickey Fuller DF: Dickey Fuller
PP: Phillips Perron
RBI: Reserve Bank of India
MRTP: Monopolies and Restrictive Trade Practices P-value: Probability value
LLC: Levin, Lin and Chu IPS: Im, Pesaran and Shin LL: Levin and Lin
OLS: Ordinary Least Squares AIC: Akaike Information Criterion SC: Schwarz Criterion
FPE: Final Prediction Error
xv HQ: Hannan-Quinn
ECT: Error Correction Term
1 CHAPTER ONE
ORIENTATION OF THE STUDY
1.1 Introduction and background
The investment industry, financial markets and quite a diverse number of financial instruments have been growing in a controlled manner for decades in terms of value and volume (Baur & Lucey, 2006). Irving (2005) stated that an increase in investments and improvement in its allocation would result to an efficient financial system, which would have a positive effect on economic growth. Furthermore, Abel, Bernanke &
Croushore (2014) state that investments from other countries are as important as extensive trading between countries as financial relationships are created with other national economies.
Financial investments are risky assets mostly administered by the banking system, as banks are among the most regulated institutions in the world and a critical part of the financial system (Geetha, Mohidin, Chandran & Chong, 2011; Tabak, Noronha &
Cajuerio, 2011). Such regulations are justified to preserve financial stability, correct market failures and protect deposits made by depositors (Tabak et al., 2011). Mutual banks were first established with a purpose of serving low-income earners, who do not have access to appropriate information regarding portfolio changes and how to undo them or who are unable to shift to other banks. However, mutual banks will not be able to survive in the long run if interest rate ceilings and deposit insurance were the only forms of regulations (Rasmusen, 1988). Okeahalam (1998) further states that such banks are subjected to economic regulations that aim to encourage higher competition, less collusion and lower industry concentration, and prudential regulations. In addition, banks ensure that all funds that belong to depositors are safe, and financial systems are not being compromised.
Zhang, Zhang, Wang & Zhang (2013) stress that both bonds and stocks are basic asset classes that are of utmost importance in asset allocation and risk management. Bond
2 markets play a very significant role in the economy like stock markets do, as stock markets not only make tremendous contributions to the economic development, but also to globalisation and technological advancements (Onyuma, 2006).
Brazil, Russia, India, China and South Africa (BRICS) are distinguished as having the fast growing markets in the universe compared to other markets of emerging economies according to their promising economic prospective and demographic power (Mensi, Hammoudeh, Nguyen & Kang, 2015). These five emerging economies were only identified as four namely the BRIC states before the induction of South Africa in 2010.
China and India are considered economic giants and are poised to possibly outtake many of the largest advanced economies of the West (Collins, 2013).
The motive and capacity of many transnational corporations of major economic entities in foreign investments were seriously crippled by the financial crisis, that resulted in their outward foreign direct investment (FDI) being slowed down (Ma & Zhang, 2010).
Citizens have come to a point where they expect to live in a more transparent, democratic and safe environment in which the corporation’s financial interests, such as foreign investors are not paramount. This is embodied by the concept of sustainability and economic prosperity. Continuation of development and prosperity in BRICS requires services to become a key feature, and such will depend on the expansion into foreign markets (Collins, 2013).
Many investors prefer assets with lower trading costs, as safer assets tend to have higher risk-adjusted returns than riskier assets. Company’s value in past years was mostly based on its hard assets like its buildings and machines, unlike today the company’s value is based more on its intangible assets such as intellectual property and human capital just to name a few (Bond & Cummins, 2000). Kasse-kengne (2015) indicates that, China and India’s economy are relatively closed and dominated by capital markets that are state controlled. Unlike Brazil and Russia who are well known as commodity exporters and have primarily natural resource based economies.
3 1.2 Statement of the problem
Asness, Frazzini & Pedersen (2012) state that movement in the stock market tends to dominate the risk in the market portfolios because of stock being more volatile than bonds. Rasmusen (1988) stipulates that due to the banking deregulation, the importance of mutual banks is diminishing, which is not the only reason for such a decline. Furthermore, Pepper & Oliver (2006) note that trends in dividends, corporate earnings and corporate profits are factors affecting individual corporations. Russia has a high uneven development, while investing in emerging countries like China could be risky (Sibirskaya, Stroeva, Khokhlova & Oveshnikova, 2014; Geetha et al., 2011).
Liquid assets earn a low rate of return, also given the uncertain future internal funds including costly external financing leading to investments in liquidity being costly (Kim, Mauer & Sherman, 1998). South Africa, Brazil and India’s stock market dependency on other countries like the United States is much higher and more persistent than for China and Russia (Bianconi, Yoshino & de Sousa, 2013). It is evident that countries tend to invest in certain entities without determining the risks that come with such investments.
Such as determining what kind of risks may occur or take place in both the short and long run, the magnitude of the risk and how such risks can be eliminated or avoided.
Therefore, the study seeks to find out how risky assets such as government stock influence investment activity, as investment is a determinant of growth in an economy.
1.3 Research aim and objectives
The study aimed to investigate the effects of government stock on investment activity in BRICS countries in the period from 2001 to 2016.
The following objectives were pursued:
To estimate the effects of government stock on investment activity,
To investigate whether a long-run relationship exists between investment activity and government stock, and
To find out if there is any causal relationship in the investment activity- government stock nexus.
4 1.4 Research questions
The following questions were answered in this study:
What are the effects of government stock on investment activity?
Does a long-run relationship exist between investment activity and government stock?
Is there any causal relationship in the investment activity-government stock nexus?
1.5 Significance of the study
Many factors affect government stock and investment activity in every country, both negatively and positively, while there is limited literature on the underlying causes of those statistics. Love & Zicchino (2006) state that a vast literature has been developed regarding the relationship between the corporation’s constraints and investment decisions. Therefore, it is important to recognise how investments are financed and impacted by various factors within economies, and government stock in this case. An increase in money and credit pushes the stock market and GDP of the country up, therefore there is a link between the stock market and the economy in aggregate (Lanine & Vennet, 2005).
Many economists have recognised for a long time that investment is one of the most volatile components of expenditure over the business cycle, while some economists link a higher level of investment within a country to long run and increased economic growth (Parker, 2010; Gomes, 2001). Government stock on bonds, mutual banks, liquid assets and corporations do not only play a vital role in investment decisions or activity, but also play an important role in the financial systems all over the world including in the macroeconomic environment as they have a huge influence on economic growth, monetary and fiscal policy and inflation. Banks are the cornerstone of a country’s financial system as the capital markets tend to be underdeveloped in developing countries (Fonseca & Gonzalez, 2010). Thus, it is important to understand the drivers for increasing or decreasing the performance of government stock and investment
5 activity in BRICS. According to Mensi et al. (2015), the four BRIC countries excluding South Africa are expected to account for 41% of the world’s stock market capitalisation.
This study presents a different viewpoint to the problem at hand, by giving more attention to how investment activity is affected by government stock. When more information on such factors, causes and implications of investment activity are brought to light, this could be panacea to financial ills of BRICS.
1.6 Definition of concepts 1.6.1 Government stock
Government stock is one of the measures of financial market indicators and entails stock on bonds, mutual banks, corporations and liquid assets. Stock refers to the ownership of interest in a company, which pays dividends to owners usually when the company declares a dividend. It can further be explained as a company selling shares in exchange for cash or as a form of ownership stakes in an entity or company (Asness et al., 2012; Choudhry, 2006).
1.6.2 Mutual banks
Mutual banks are authorised financial service providers, in which the bank is a bearer of certain duties and rights given legal personality by law, and that is in accordance with the Mutual Bank Act No. 124 of 1993 (South African Reserve Bank, 1993).
1.6.3 Corporations
A corporation is a legal company, business or entity that is recognised by the law.
Collins (2013) states that developed countries corporations have promoted themselves as socially conscious, sustainability minded citizens in order to serve the interests of increasingly informed and sustainability minded consumers.
1.6.4 Liquid assets
6 Liquid assets refers to assets that can simply be converted to cash in a short period, such assets include short-term government stock, money, mutual funds and bonds.
(Kim et al., 1998)
1.6.5 Investment activity
According to Sibirskaya et al. (2014), investments can shape the inertial development of innovation activity. Investment activity in this study will be measured in terms of gross fixed capital formation (GFCF). Gross fixed capital formation can be described as an increase in physical assets within a particular measured period.
1.6.6 BRICS
BRICS refers to five countries with emerging stock markets i.e. Brazil, Russia, India, China and South Africa. The economies of the BRICS countries are becoming more integrated with the most developed economies in terms of trade and investment. Their economies have grown at a rapid pace, as they have fast growing markets (Mensi, Hammoudeh, Reboredo & Nguyen, 2014).
1.7 Ethical consideration
This study used secondary data and was conducted free from misquotations and intentional plagiarism. All sources used or quoted had been identified and acknowledged by means of complete references. The University manual for postgraduate research had been followed.
1.8 Structure of dissertation
This dissertation is divided into various chapters, namely:
Chapter two: consists of the theoretical framework and empirical literature. The theoretical framework includes different theories, such as Keynes Theory of Investment, Neoclassical Theory of Investment Behaviour, Tobin’s Q Theory of Investment Behaviour and the Financial Theory of Investment Behaviour. While
7 the empirical literature focuses on evidence and findings from previous studies relevant to this study. Chapter two also includes the overview of the various trends of the government stock indicators and investment activity and the overview of government stock in the BRICS economy.
Chapter three: deals with the methodology used in the study. Different econometric tests such as the panel autoregressive distributed lag are used in order to test the significance of the model used in this study.
Chapter four: presents the various tests performed in the study and interpretation of the findings in detail.
Chapter five: this is the final chapter and provides the summary, recommendations on further studies and conclusion. Limitations of the study are also discussed.
This chapter outlined an introduction and background of the study, statement of the problem, the research aim, and objectives relevant to the study were also explained.
The significance of the study was also delineated. Different concepts pertaining to this study were defined in detail as the study attempted to bring a different viewpoint to phenomenon under study. The ethical consideration was included and the structure of the study. The next chapter comprises literature review and various trends of the government stock indicators and investment activity in the BRICS economy.
8 CHAPTER TWO
LITERATURE REVIEW 2.1 Introduction
This chapter deals with the theoretical framework, empirical literature and an overview of BRICS economy. It begins with the theoretical literature, which outlines the various theories on the effects of government stock (bonds, mutual banks, corporations and liquid assets) on investment activity. Secondly, the empirical literature, which provides evidence and findings from the aforementioned aim, and lastly gives an overview of the BRICS economy.
2.2 Theoretical framework
The following economic theories were used to explain the effects of government stock on investment activity. The theories included the Keynes Theory of Investment, Neoclassical Theory of Investment Behaviour, Tobin’s Q Theory of Investment Behaviour and the Financial Theory of Investment Behaviour.
2.2.1 Keynes Theory of Investment
The Keynes Theory of Investment by John Maynard Keynes emerged in 1936 where he developed this theory based on the supply and demand price of capital. The capital prices of supply and demand are not similar as compared to the amount of money invested. Such results are from changes in prospective yields, including increased pressure on facilities that are usually used to produce capital goods. Keynes also believed that cyclical fluctuations were caused by fluctuations in investments (McKenna
& Zanaoni, 1990). Wray & Tymoigne (2008) considered that the level of investments weighted against the market interest rate is equal to the function of capital marginal efficiency, where the demand and supply of money are equilibrated. Hence, a rise in investments also leads to an expansion in income; thus, consumption to increase until savings rises to a point of equality with the new level of investments.
9 Formal, the equation can be written as:
b t
j
/ 1/1 (1 (2.1)
The level of national income is at, while is the level of aggregate investment, b the marginal propensity to consume, t the income tax rate and j the marginal propensity to import.
Harcourt & Kriesler (2013) outline periods in which various innovations entail limited effects on cost structure or modest investments in certain industries and, in such cases, expansions will tend to be weak and short lived. Harcourt (2006) further states that in any given situation a higher investment rate often results in a higher share of gross profit. When prices relative to money wage rate are pushed up in gross income, they tend to lead total gross income to a higher level resulting from a higher level of employment, including utilisation of plants. In every income level when the share profits are greater, the value of planned investments will also be higher and such a higher level of planned investments usually has an expansionary effect.
According to Wray & Tymoigne (2008), the expected returns on holding assets that are measured in monetary terms are:
a l c
q (2.2)
The q in the equation is the assets expected yield, c is the carrying cost, l a liquidity and a the expected price appreciation or depreciation. The nature of the returns differ by asset, with most of the return allocated to holding liquid assets consisting of l and also most of the return of illiquid assets (for example, capital) consisting of qc. Most liquid assets are expected to generate a stream of income and capital gains, also to pay lower yields than more illiquid assets like corporate bonds or capital assets.
2.2.2 Neoclassical Theory of Investment Behaviour
Dale W. Jorgenson has made major contributions in 1967 to the development of the Neoclassical Theory of Investment Behaviour that is based on the determination of optimal capital stock or optimal accumulation of capital. The theory emphasises that
10 investment goods demand will be controlled by the interest rate, when comparing two alternatives and continuous paths of capital accumulation that in turn depends on the interest rate time path (Eisner & Nadiri, 1968). The theory stipulates that capital usually earns a return that is equal to its marginal productivity, but Keynes and Minsky rejected such a relation, arguing that monetary return is very important in a capitalist economy (Wray & Tymoigne, 2008).
Investment is normally seen as one of the important paths to reduce unemployment, as it promotes economic growth. Such investment decisions are motivated by the expected profits, but the exact nature of such decisions in economic theory remains largely unresolved (Alexiou, Tsaliki & Tsoulfidis, 2016). Investment expenditure has also been estimated to be one of the key components of aggregate demand that usually conditions not only through the introduction and through diffusion of new technology, but also through economic activity and employment. According to Alexiou et al. (2016), there has been different theoretical frameworks with the attempt to effectively explain the variations in investment activity over the years, as investment activity is a source of economic growth, economic stability and its wellbeing.
The Neoclassical Theory of Investment was based on the presumption that the future is certain assumption, prior to Keynes’ general theory of employment, interest and money in 1936. Also under this theory of investment, the marginal rate of investment is said to be equal to the interest rate (Gordon, 1992). Many heterodox economists and the Keynesian placed emphasis on the accelerator kind of models, unlike the standard Neoclassical Theory, which emphasised the significance of interest rate and prices in order to be able to determine the investment-saving decisions (Alexiou et al., 2016).
Furthermore, Alexiou et al. (2016) state that, the Neoclassical idea is that the interest rate means an investment demand schedule in which the equality of savings and of investment is obtained usually through the variations in the interest rate. The level of output of employment can be determined by only assuming that there is enough price flexibility. The measurement of capital in which its consistency with the requirements of the Neoclassical Theory of value which leads to necessitate the hypothetical one-
11 community-world economy can result due to the investment demand and associated trade-off between investment and the rate of interest (Alexiou et al., 2016).
2.2.3 Tobin’s Q Theory of Investment Behaviour
A Nobel Laureate economist named James Tobin proposed the Tobin’s Q Theory of Investment (Modigliani & Miller, 1958). This theory was formulated based on financial markets, with the aim of linking firms or corporations’ investment decisions to fluctuations in the stock market (including the bond market). Such is evident when the corporation issues shares in the stock market to finance its capital for investment, the share price will reflect the investment decisions made by the corporation. Proper investment decisions by management are important in every corporation, big or small businesses, including mutual banks as well. The decisions help corporations to determine whether the investments made in certain entities or projects will yield an expected huge return, or if the corporation should expect a loss or no return at all from its investments into those particular entities or projects (Modigliani & Miller, 1958).
Investment decisions form part of risk management. Before making an investment, it is vital to determine any risks that may occur in the near future. This is because corporate decisions also affect the growth of the whole economy (Love & Zicchino, 2002).
Corporations that do not have internal funds and are only left with an option to obtain loan from the bank may be prone to partake in risky investment projects that have low expected marginal productivity. According to Choudhry (2006), risk management involves the identification or forecasting and evaluation of financial risks that might occur. If corporations and mutual banks risk management functions are effective, there will be no unexpected losses that will lead to an increase in eventual costs to many times the original loss amount.
Love & Zicchino (2002) state that the q approach predicts that investment decisions made by corporations are not only determined by the present value of future marginal productivity of capital, but also depend on the level of collateral availability when firms or corporations enter into a loan contract. Parker (2010) says Tobin believed and argued that a corporation’s investment levels should depend on the ratio, which is the Tobin’s Q installed capital present value to the replacement cost of capital. As Tobin’s Q theory
12 does not only rule out the importance of uncertainty and finding the various structures of determining investment, but the theory can also be easily reconciled with other approaches of investment, which at the end lead to the same basic results (Wray &
Tymoigne, 2008). Such a theory argues that corporations will only want to decrease their capital stock when q is less than one and increase its capital when q is greater than one (Wray & Tymoigne 2008).
In a situation where q1 firms or corporations would rise or have higher profits because investments are expected to be high if they invested in more capital and it is cheaper for corporations to buy new capital assets. If q1 investments will be expected to be near zero (decline), therefore, more investments would lower profits and the present value of the profits that are earned by installing new capital would be less than the cost of capital. This
q1
can be reflected when an individual seeking to enter an industry would be able to acquire the capital assets at a cheaper price and when the price changed on buying an existing firm or corporation is lower than the cost of building a new one (Love & Zicchino, 2002; Parker, 2010; Wray & Tymoigne, 2008).2.2.4 Financial Theory of Investment Behaviour
With the level of investment demand, the demand price declines whereas the supply price increases with investments. This is because an increase in aggregate investment would have a multiplier effect on the effective demand that could cause an increase in sales (Wray & Tymoigne, 2008). Since greater borrowing exposes the buyer or country to higher risk of insolvency, the price that a country is willing to pay usually depends on the amount of external finance required. Borrowers risk should be included in the demand prices; as such, a risk cannot be calculated for the future. The validation of expectations and encouragement of increased or more investments would occur when there is an investment boom where profits would be rising along investments. A decline in investments and profits might take place, as anything that might cause expected future profitability to be lower could also cause today’s demand price of capital to result as being lower than the supply price.
13 According to Kregel (2008), the relation between most banks and their borrowers has been more impersonal, where it is judged using credit scoring methods. Banks are moving away from seeking long-term individualised relationships with clients, mostly recurring borrowers. Banks’ relation with borrowers must be based not only on trust between the parties, but also on the banks’ recurring lending agreements. The banks, be it corporate or mutual banks, may acquire most of their profits from fees obtained by either selling or servicing structured financial instruments, such as mortgage backed securities. The banks are also responsible for, and in charge of, making sure that the making of money is established on interest rates that broaden across deposit rates. As banks are liable for paying and for the lending rates that are earned by banks, but paid by borrowers (Wray & Tymoigne, 2008).
2.3 Empirical literature
This section of the literature review is an overview of the relevant studies pertaining to government stock (bonds, mutual banks, corporations and liquid assets) and investment activity. Investments and government stock can be determined by many factors in the economy. Stubeli (2014) explains that the relationship between investments and profits is strong as it is extremely important for the economic system of a country. Furthermore, Fazzari, Habbard & Petersen (1987) state that investments tend to be more sensitive to cash flow.
2.3.1 Estimation of government stock on investment activity
Harcourt & Kriesler (2013) postulated that investments were the means in which the capital base had to be changed by incorporating new technology. The nationalisation of all key industries that ensure all corporations earn all of its business in a truthful manner, including financial intermediaries, will raise investments with fixed exchange rates being adjusted on regular bases to ensure external balance. Private risk of an investment is much greater than its social risk and such can cause an increase in the opportunity cost, as taxes on profits of corporations serve to increase the opportunity cost of resources that public projects tend to withdraw from private sectors (Arestis, Palma & Sawyer, 1997).
14 According to Modigliani & Miller (1958), investments are often driven to a point of physical assets marginal yield being equivalent to the market rate of interest when the corporations act rationally. Most important sources of investment funds for corporations that accumulated profits are used, including internal funding. Also, borrowing either from banks or through issuing of long-term bonds and short-term commercial paper and issuing of new shares of stock. Such funding methods may inflict costs that are explicit or implicit to the corporations or firms (Parker, 2010).
Lettau & Luduigson (2002) examined the time-varying risk premia and the cost of capital, with an alternative implication of the q theory of investment. Based on the long horizon forecasting regressions of the aggregate investment growth, the implications were tested. The evidence from the study suggested that the expected excess stock market returns were different and that the difference was larger than the expected real interest rate. In the standard investment models where the cost of capital was included, it was found that a greater fraction of movement must have resulted from movements in equity risk-premia. As equity risk premia movements were emphasised, such should have an impact on the future investment over horizon, but not merely on today’s investments only.
This was supported by a study proposed by Almeida & Campello (2006), where they tested a large sample of manufacturing firms between the period 1985 and 2000. The data supported the hypothesis that they made about the rate of asset tangibility (as it has a huge influence) on corporate investment under financial constraints. When firms face credit constraints, investment cash flows become sensitive. These sensitivities will increase in the degree of tangibility of constrained firm’s assets. However, investment cash flow sensitivities are not affected by asset tangibility when firms are unconstrained.
It was further stated that firms with more tangible assets stood a great chance of having access to external funds than being financially constrained. The results also revealed that, due to constrained firms with tangible assets having a highly procyclical debt capacity, the income shocks would have a greater effect on them as compared to other firms. Investments and borrowing will become endogenous only when firms are capable
15 of pledging their assets as collateral. Pledged assets make it easier for firms to borrow and turn results into more investments.
Another study conducted by Fazzari et al. (1987) compared investment behaviours of swiftly growing firms (which depleted all their internal finances) with well-established firms that paid dividends. Panel data was employed in the study on individual manufacturing firms and the q theory of investment was used to examine the significance of the hierarchy of finance resulting from the capital market. It was also found that investments were more sensitive to cash flow and that the q values remained at a high level on important periods for firms that usually paid no dividends as compared to well-established firms.
Bolton, Chen & Wang (2011) proposed a model of dynamic investments, financing and risk management for financially constrained firms. The model indicated that endogenous marginal value of liquidity played a substantial role in corporate decisions. In their paper, they noted in one of their main results that investments relied on the ratio of the marginal q to the marginal value of liquidity and such a relation between investment and the ratio of the marginal q did not change with the funding of the marginal source.
Kumbirai & Webb (2010) further analysed the overall performance of the commercial banking sector of South Africa between 2005 and 2009. It was indicated that the overall performance of banks increased incredibly in the first two years of their analysis from 2005 to 2007. The financial ratios were utilised to measure the performance of credit value, profitability and liquidity of the five South African based large commercial banks.
As the world cup approached, banks did not decrease but were able to increase the size of their loan portfolios. It was also found that due to the global financial crisis in 2007, which affected both developed and developing countries, the bank performance deteriorated between 2008 and 2009. Because of the deterioration in the bank operating environment, there was also a deterioration of credit value, a decline in profitability and liquidity in the South African banking sector. Regardless of such a crisis, which affected both commercial and mutual banks around the world, South African banks were able to continue with their day-to-day business. South African banks were allowed to remain liquid and well capitalised, and that prevented any kind of need for
16 state support of extraordinary liquidity due to the banks low leverage, high profitability, limited exposure to foreign assets and funding.
2.3.2 Long-run relationship between government stock and investment activity Gomes (2001) explains investment fluctuations as responsible for a great fraction of cyclical volatility of output. Not only that but also income as investment is a central macroeconomic variable. The study examined the investment behaviour of firms when faced with costs, but which have the opportunity to access external funds. The main findings suggested that regardless of the presence of liquidity constraints, the standard investment regressions predicted that cash flows played a vital role in the determination of investments only if q was ignored. Yet, the presence of financial constraints is not sufficient in order to establish cash flows as an important regressor in standard investment equations beyond q. As financial constraints play a significant role in shaping corporate investment, cash flow becomes highly significant in investment regression. It was also found that even in the absence of financial frictions cash flow had a significant effect.
Bianconi et al. (2013) conducted a study in which daily data from January 2003 to July 2018 was used to examine the behaviour of stock and bonds from BRIC countries. The main findings suggested that BRIC bond markets in the long run deviated much more from the U.S (United States) financial stress measure than would the BRIC bonds and stock that usually deviated among one another. It was also found that the bond and stock return correlations for Brazil and Russia, were significantly great and negative.
Kim et al. (1998) developed a model that estimated that the optimal investment in liquidity would be rising in the cost of external financing. Also in the future investment opportunities return and variance of future cash flows, but such would be decreasing in the differential between liquid assets and physical asset returns. This model was developed focusing on the optimal corporate investment in liquid assets. The model was also based on the cost benefit trade-off between the holding of liquid assets cost (a low return) and the benefit of minimising needs in order to fund profitable investment opportunities in future with costly external financing. These predictions were tested using a large panel of industrial firms. It was found that greater market to book ratios
17 that firms might have, significantly possessed a larger position in liquid assets and that liquidity was negatively related to the position of liquid assets. In addition, firms with a larger position of liquid assets had more volatile earnings and lower returns on physical assets as compared to liquid assets. But the results supported the predictions made by the model which showed that there was a positive relation between liquidity and the cost of external financing. It was concluded that firms built liquidity with the anticipation of promising future investment opportunities.
In a study where panel data was used and unit root tests performed, Sinha & Sinha (1998) analysed the exploration of the long run relationship between saving and investment in the developing economies of ten Latin American countries. The empirics showed that in four of the ten countries that were tested, saving and investment ratios had a long-run relationship when the number of cointegrating vectors equalled to one.
The study concluded that macroeconomic instability in the long run might occur due to specific divergences between investment rate and savings rate in some countries.
2.3.3 Causal relationship between government stock and investment activity Sridharan, Vijayakumar & Rao (2009) examined the causal nexus between FDI and economic growth in BRICS countries. Quarterly data was utilised and the Industrial Production Index (IPI) as a measure of economic growth was employed. Vector Error Correction Model (VECM) was employed as one of the tests, it was found that the long run relationship was present. The results also revealed that economic growth led FDI bi- directionally for various countries like Brazil, Russia and South Africa. As for FDI, it tends to lead the economic growth of India and China unidirectional.
Pradhan, Arvin, Hall & Bahmani (2014) studied the Association of South East Asian Nations (ASEAN) from 1961 to 2012. In order to determine the causal nexus between economic growth, the banking sector development, stock market development, and including other macroeconomic variables. In the study, it was found that both the bidirectional and unidirectional causality links between these variables was present as the panel vector auto-regressive (VAR) model was employed in order to perform a test for the Granger causalities. A well-functioning financial system, with well-established
18 banking sectors and stock markets can lead to an increase in the growth rate of a country.
2.4 Overview of the BRICS economy
This section provides an analysis of the different trends of the indicators used in the model and an overview of government stock in the BRICS countries. The indicators are investment activity as measured by gross fixed capital formation, government stock on bonds, government stock on mutual banks, government stock on corporations, and government stock on liquid assets. The overview of the trends focused on was between 2010 and 2016 as the BRICS group came into existence when South Africa was inducted in 2010.
2.4.1 Trends in gross fixed capital formation
Trends in gross fixed capital formation showed the behaviour of investment activity from 2010 to 2016. According to Bertoni, Elia & Rabbiosi (2008) many investments follow an exploitation strategy, which is implemented through the horizontal and related investments.
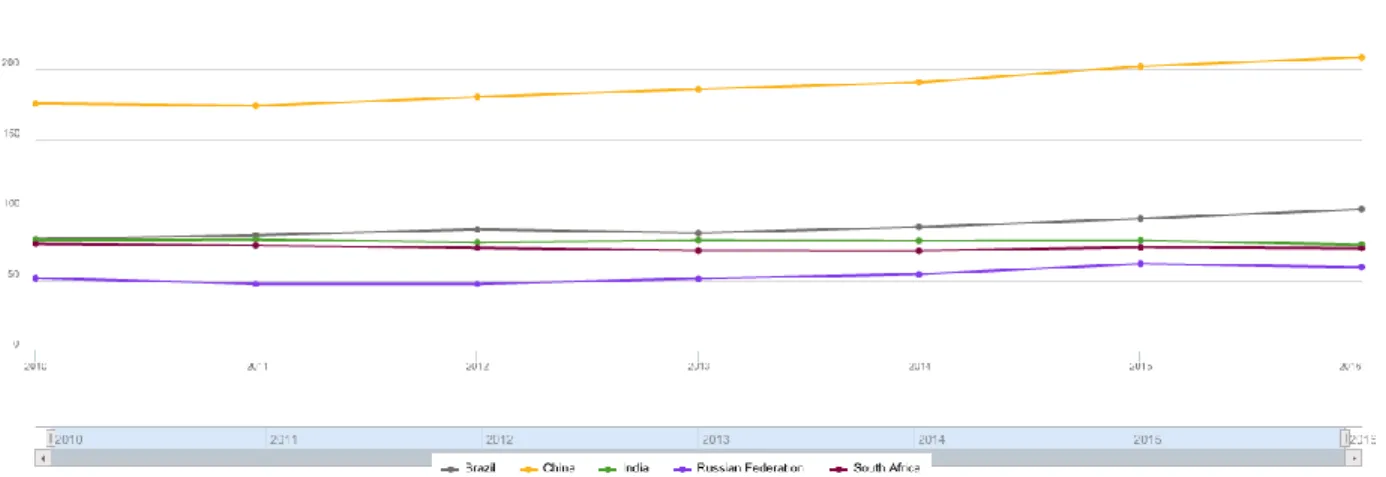
Figure 2.1: Gross Fixed Capital Formation (% of GDP)
19 Figure 2.1 shows that Brazil, Russia and South Africa’s gross fixed capital formation seems to be trending around the same percentage. However, India and China are trending alone at different percentages which are above those of Brazil, Russia and South Africa. India is trending between 27 and 35 percent rates, while China is between 45 and 48 percent. In Brazil, from 2010 to 2013 the gross fixed capital formation was trending along the same rate that eventually declined between 2013 and 2014. This sharp decline in Brazil continued until 2016 where it reached its lowest. According to Trading Economics (2018), gross fixed capital formation in Brazil averaged 146431.17 BRL Million from 1996 to 2018. However, in the first quarter of 1996 it reached a record low of 35403.16 BRL Million due to currency devaluation, but in the third quarter of 2013 it managed to reach an all-time high of 291365.72 BRL Million (Trading Economics, 2018; Adrangi, Chatrath & Sanvicente, 2000).
From 2011 to 2018, gross fixed capital formation in Russia averaged 3524.22 RUB Billion. In the fourth quarter of 2017 it reached an unprecedented high of 7490.40 RUB Billion and in the first quarter of 2011 a record low of 1709.70 RUB Billion (Trading Economics, 2018). According to Figure 2.1, Russia’s gross fixed capital formation moved nearly along the same rate, between 2010 and 2014, but it declined between 2014 and 2015, reaching the 20 percent rate. In 2015, the gross fixed capital formation of Russia started to increase toward 2016. India experienced a slight increase in gross fixed capital formation between 2010 and 2011, but it started to decline significantly between 2011 and 2015. The trend, however, stabilised and moved along the same rate between 2015 and 2016 as shown in the figure. Trading Economics (2018) states that India’s gross fixed capital formation from 2001 to 2018 averaged 5508.24 INR Billion. In the first quarter of 2002 India’s gross fixed capital formation reached a low record of about 2021.90 INR Billion, but reached an all-time high of 11185.28 INR Billion in the first quarter of 2018.
China’s gross fixed capital formation rate was above all the other countries’ rate included in this study, going above 40 percent in Figure 2.1. The gross fixed capital formation of China slightly moved at the same rate between 2010 and 2013, which also showed a slight increase. Between 2013 and 2016, China’s gross fixed capital formation
20 decreased. China’s gross fixed capital formation increased in 2017 to 346440.80 CNY HML from 318083.60 CNY HML in 2016 (Trading Economics, 2018). As for South Africa’s gross fixed capital formation in Figure 2.1, it trended below 20 percent between 2010 and mid-2012, where it started increasing hovering around 20 percent until 2015.
Between 2015 and 2016, there was a slight decline. Trading Economics (2018) further stated that South Africa’s gross fixed capital formation averaged 296856.91 ZAR Million from 1960 until 2018. According to Malope, Ncanywa & Matlasedi (2017) government bonds do have a greater effect in the prediction of South Africa’s future investments.
The dramatic increase in investment activity in the BRICS countries can be a result of their increase in wealth, liberalisation of investments and integration into the global economy. Most investments that are usually directed towards other developing countries are from BRIC countries and unstable and turbulent institutional and economic environments characterise countries that are emerging (Bertoni et al., 2008).
2.4.2 Trend of the indicators of government stock (2010-2016) 2.4.2.1 Government stock on bonds
Movements in stock indices can be influenced by changes in the economy’s fundamentals and changes regarding future prospects expectations among other things (Sharma & Mahendru, 2010). Stock indices are very sensitive to such changes.
Authorities of a country need to pursue economic growth, a higher ratio of money supply to GDP, lower inflation rate, including fiscal and lower real interest rate. According to Taha, Colombage & Maslyuk (2010), if the stock market activities are increasing, including the high revenue collection then stable and strong growth within the country can be achieved. In order to be able to maintain a healthy and strong stock market of the country (Hsing, 2011). However, the activity of stock indices is dependent on the investor’s willingness to invest in the corporation shares and other securities (Sozinova, Zhelnina, Prokhorova, Zelinskaya & Putilina, 2016).
Figure 2.2: Government stock on bonds
21 In Figure 2.2 Brazil’s government stock on bonds measured in U.S dollars declined significantly between 2011 and 2013, where it slightly increased until 2014. It however, decreases again until it reaches a negative value between 2014 to 2016. It is very crucial since the financial crisis that took place recently to understand the dependence structure of the stock market on the financial and global economic factors. Stock market performance depends not only on the changing structure of macroeconomic fluctuations, but also on changing structures of the risk factors and the business cycle (Mensi et al., 2014). The long-term bonds and common stock expected returns have a term premium that is related to business conditions. In Russia, government stock on bonds starts to increase in 2010 until 2012, however it experienced a tremendous decline between 2012 and 2014. The Russian Federation did recover from the significant decline, which resulted in a negative value in 2014, as it increased from 2014 to 2016.
India’s government stock on bonds experienced many upward and declining trends, the trend is between $ -20 billion and $ 40 billion. The government stock on bonds increased significantly between 2013 and 2014, where it reached a value above $ 20 billion. It however, declined significantly from 2014 to 2016 reaching a negative value.
The BRICS countries’ current and potential growth has vital implications for their stock market capitalisation, as well as for their financial dependence on other stock markets.
The capitalisation of the stock market between 1986 and 1995 increased ten-folds from
22
$171 billion to $1, 9 trillion. With the market share that was held in capitalisation increasing from 4 to 11 percent in the emerging markets, including that of Brazil, India and Hong Kong (Gay, 2016). Mensi et al. (2014) postulates that the four BRIC countries by the year 2030 are expected to account for 41 percent of capitalisation of the world’s stock market. According to Kennedy, Kawachi & Brainerd (1998), a civil society was rich when it came to stocks of social capital.
The two official stock markets of China, namely Shanghai and Shenzhen Stock Exchange grew dramatically since the beginning of its operations, in the early 1990s. At the same time becoming one of the leading equity markets (Demirer & Kutan, 2006). In the figure, China’s government stock on bonds increased from a negative value to a positive value above 20 billion, from 2010 to 2012. China faced a tremendous decrease between 2014 and 2015, which eventually recovered by a slight increase between 2015 and 2016. China is expected to have the largest equity market in the world, as it is also expected to overtake the U.S in the capitalisation of the equity market (Mensi et al., 2014).
South Africa’s government stock on bonds moved along the same value from the end of 2012 to 2014 as shown in figure 2.2. In 2014, South Africa experienced a slight increase over the years up to 2016. The world stock is expected to have an impact on the South African stock market as international investors want to increase their financial assets rate of return by comparing the attractiveness of financial assets in various countries (Hsing, 2011). Sun & Tong (2000) further state that free capital to move across borders, it is usually attracted by the international diversification benefits. Investors will pay higher prices for foreign stocks than what they really pay at home because of such benefits. However, according to Sun & Tong (2000), additional diversification benefits are gained by foreign investors investing in domestic stocks that domestic investors cannot. Foreign investors usually require a lower rate of return compared to domestic investors. All investors give a close watch to what is happening in the economy around the world, especially investors operating in stock markets (Mensi et al., 2014).
23 Over the past two decades, one of the most striking features of international financial development was the raise of stock markets in developing countries that had emerging markets (Smith, Jefferis & Ryoo, 2002).
For South Africa to be able to raise finance for emerging gold ventures, the Johannesburg Stock Exchange (JSE) was established for the country to be able to do so in the 19th century. Since the ending of apartheid and the lifting of sanctions in 1994, the JSE benefited from the substantial inflows of foreign portfolio investments. However, a dual exchange rate that applied to capital transactions also referred to as the financial rand was used prior March 1995 in order for transactions to be carried out. In 1996, the JSE shifted to an electronic trading system that was screen based (Smith et al., 2002).
Due to the global financial crisis, the JSE index declined 43.5 percent during May 2008 to November 2008 (Hsing, 2011).
2.4.2.2 Government stock on mutual banks
Banks play a very vital role in the financial system of every country, as they contribute to economic development and growth. According to Said & Tumin (2011), the performance of the banking industry has a huge and broad effect on the economy. However, bank failure would have a negative impact on the economy (Lanine & Vennet, 2005). A sound and effective banking system ensures an effective allocation of resources and their use.
Banking efficiency plays an important role at both the macro and micro levels.
Demirguc-Kunt, Laeven & Levine (2003) further state that there are substantive repercussions on economic performance at the efficiency at which banks intermediate capital, as the societies’ savings are mobilised and allocated by the bank. A bank can also be viewed as a company that uses deposits as inputs in order to produce investments and loans (Styrin, 2004). Mutual banks as compared to commercial banks do not have a substantial menu of products that are provided by commercial banks.
Figure 2.3: Government stock on mutual banks
24 In Figure 2.3 Brazil and China had the same movement between 2011 and 2015, where they both experienced an increase in government stock on mutual banks between 2013 and 2014. Also a decline from 2014 to 2015. The decline in Brazil continued until 2016, while China’s government stock on mutual banks started to increase in 2015. Therefore, a bank with sound financial health is equally important to the depositors, the employees, economy and shareholders. Lanine & Vennet (2005) stipulate that banks are faced with different risks, such as capital or leverage risk, liquidity risk and default risk, just to name a few. Banks’ objective is to maximise the cash flows for a certain level of bank risk. Most theories assume that banks are risk neutral, but according to the portfolio management theory of banking, managers are risk averse. Such an assumption can be defended for small and manager-owned banks. The portfolio management theory still states that banks are able to sell credit using deposits as inputs (Alger & Alger, 1999).
Around 1998 during the Russian banking crisis, the Russian banking sector experienced great disturbance also in the late 1990s. Figure 2.3 shows that Russia experienced a sharp decline in government stock on mutual banks between 2012 and 2015. However, Russia managed to slightly recover by going through an increase from 2015 to 2016. It is stated by Styrin (2004) that one of the most important prerequisites for successfully establishing an economic growth that is sustainable in Russia was the restructuring of the banking sector. A risk of bank runs can be created in the case of
25 losses that were not expected on the lending portfolio. As liquid liabilities like deposits are used to finance illiquid assets. Default risk can also occur as banks tend to be faced with problems of asymmetric information about their borrowers as a lending business (Lanine & Vennet, 2005).
India increased significantly during 2010 to 2013. Although after such a great increase, India experienced a sharp decline from 2013 to 2016 in government stock on mutual banks. According to Sangmi & Nazir (2010), the concept of banking and banks has undergone a paradigm shift with the integration of the Indian financial sector with the rest of the world. In Figure 2.3, South Africa’s government stock on mutual banks trended along the same value during 2010 to 2013. The government stock on mutual banks slightly increased during 2013 to 2015 and started declining again because of poor management of mutual banks. The Venda Building Society (VBS) mutual bank is one of the mutual banks in South Africa currently facing a financial crisis. The financial crisis was due to poor management, poor regulations, policies and conflict of interest.
Such has resulted as a major concern for regulators and bank supervisory authorities.
Bank failures involve large amounts or costs, people involved in the bankruptcy process and potential danger of systematic crisis (Lanine & Vennet, 2005).
2.4.2.3 Government stock on corporations
Corporate governance is not only based on the basis of waste, but also on existing standards in the field of management marketing, financing, securities and organisational structure (Sozinova et al., 2016). Mele, Debeljuh & Arruda (2003) state that many corporations have adopted some formal or informal ethical policies as they also consider business entities. Many people believe that ethical issues within a corporation are the primary responsibility of the Chief Executive Officer (CEO).
Figure 2.4: Government stock on corporations
26 Figure 2.4 shows that Brazil’s government stock on corporations hovered along the same value, which was nearly similar to South Africa’s trend from 2010 to 2016.
Russia’s government stock on corporations increased during 2010 to 2011; from 2011 until 2012, it experienced a decrease. Russia’s government stock on corporations started to trend along the same value from 2012 until 2016. India and China increased during 2010 until 2016. Corporations have a vital role to play in the economic growth and financial stability of a country. When the financial system of an economy becomes stable and does better than the previous years or improves in its size, activities and efficiency, the financial markets will be considered developed (Malope et al., 2017). For India during the period of 2015 towards 2016, government stock on corporations trended on the same value while for China it continued to increase. When corporations expand abroad, it provides such corporations with opportunities to access distribution networks and well established brands. For example, to promote long-term strategic objectives the BRIC companies invested in leading foreign in order to advance their position in global production and marketing (Bertoni et al., 2008). However, uncertainty of government intervention in the economy and markets has an impact on corporation investments (Chang, Chen, Gupta & Nguyen, 2015)
Furthermore, South Africa’s government stock on corporations trended along the same value throughout the period of 2010 up to 2016, as seen in Figure 2.4. Stability of
27 financial markets promotes the economic growth of a country by making it possible for funds to flow smoothly between savers and investors, and enabling the raising of capital. It is estimated that small and medium enterprises (SMEs) make up 91 percent of the formal business entities in South Africa. In which they contribute between 52 to 57 percent to GDP and provide employment of about 61 percent (Abor & Quartey, 2010).
2.4.2.4 Government stock on liquid Assets
Liquid assets tend to be less for banks facing a demand of more deposits (Alger &
Alger, 1999). There are liquidity shocks that a bank could face and liquidity assets are used to meet such drastic liquidity shocks. Only small banks choose to rely on the liquid assets to deal with such a shock. The balance sheet of the banks reveals the amount of funds invested in liquid assets. However, liquidity comes at a price as liquid assets yield lower returns.
Figure 2.5: Government stock on liquid assets (% of GDP)
The BRICS government stock on liquid assets nearly have a similar movement, but at different rates with Brazil, China and Russia increasing between 2011 and 2015.
However, Brazil and China continued to increase towards 2016, but Russia’s government stock on liquid assets slightly decreased between 2015 and 2016. The level
28 of liquid assets that a bank or corporation chooses can be explained by risk aversion.
The amount of liquid assets can, however, be affected by the introduction of deposit insurance (Mertoni, 1977).
India’s government stock on liquid assets moved around the same rate from 2010 to 2016, but there was a trivial increase from 2012 to 2014. Furthermore, South Africa’s government stock on liquid assets trended at the same rate between 2010 and 2011.
South Africa’s government stock on liquid assets declined a bit and remained low from 2011 to 2014. In mid-2014, South Africa’s government stock on liquid assets began to increase through to 2016.
2.5 Overview of the individual BRICS countries government stock 2.5.1 Brazil
The economy of Brazil in the last few years gained a lot of significance, as it experienced currency devaluation in 1999. Adrangi et al. (2000) stated that the economy of Brazil was the flagship of the Latin American Economies and played an important role in the world markets, as 450 of the top 500 U.S corporations do business in Brazil. This is considered the eleventh market for the U.S exports. However, when the economic activity decreases the future corporate profits and stock prices are affected negatively. Furthermore, Ntim & Osei (2011) state that larger corporations generate greater corporate performance due to having good governance mechanisms. Corporate performance can be improved with the usage of debt to minimise the manager’s ability to expropriate excess cash flows. If debt is used excessively, it could result in financial problems and thwart corporations from taking full advantage of growth opportunities.
Stability of emerging markets financial structure, also of the world and equity markets, could be threatened due to inflation and currency depreciation in the economy. The economic instability that occurred in Brazil in 1999 is a good example. As bonds and equities are often seen as potential hedge against expected inflation, also unexpected as they are claims against real assets (Adrangi et al., 2000). According to Gay (2016), the emerging economies share in world output, including the newly industrialising