The BRIC FDI inflow on SADC exports to the world is significant and it is a motivation for the SADC group to further motivate. Future studies will include determining the market forces that contribute to the co-movement of BRIC FDI inflows into SADC with SADC's exports to the world.
Introduction
- Background
- The establishment of BRIC and BRICS
- The establishment of SADC
- South Africa as part of the SADC, COMESA-EAC-SADC tripartite and Africa
- The link between FDI and exports
- Problem statement
- Aims of the study
- Research methods
- Outline of the study
However, it should be noted that the members of the Southern African Customs Union (SACU5), established in 1910 (SACU, 2012), the main building block of a customs union for the SADC, are now on the decline, while South Africa is in trouble stays. a customs and excise revenue battle against the smaller neighboring countries (Van den Bosch, 2011). The secondary research objective is to determine the specific influence/relationship of the BRIC's foreign direct investment on SADC's exports to the BRIC and the world.
Literature overview on the relationship between FDI and exports
- Introduction
- Theories on FDI and exports
- What is FDI?
- Defining export
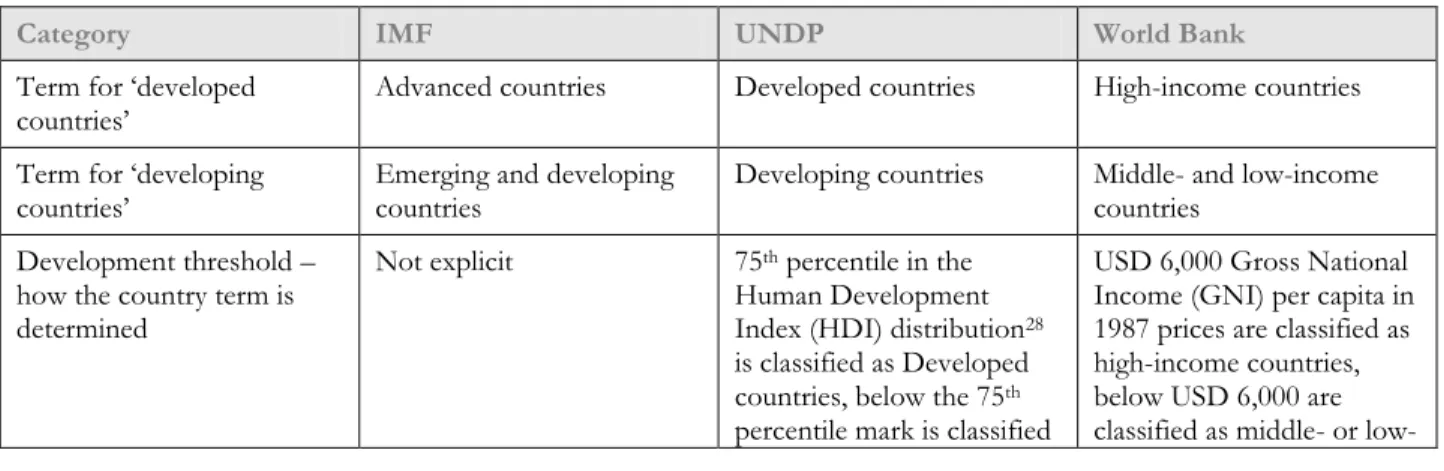
- Country classification systems
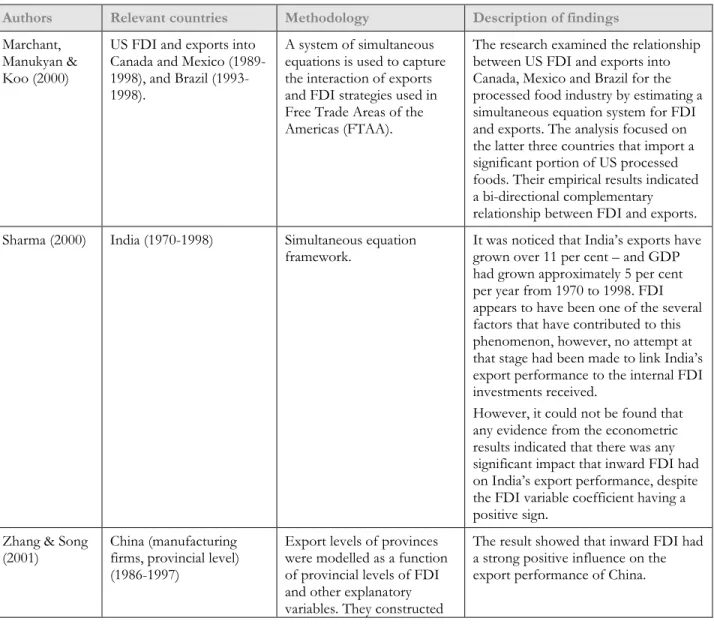
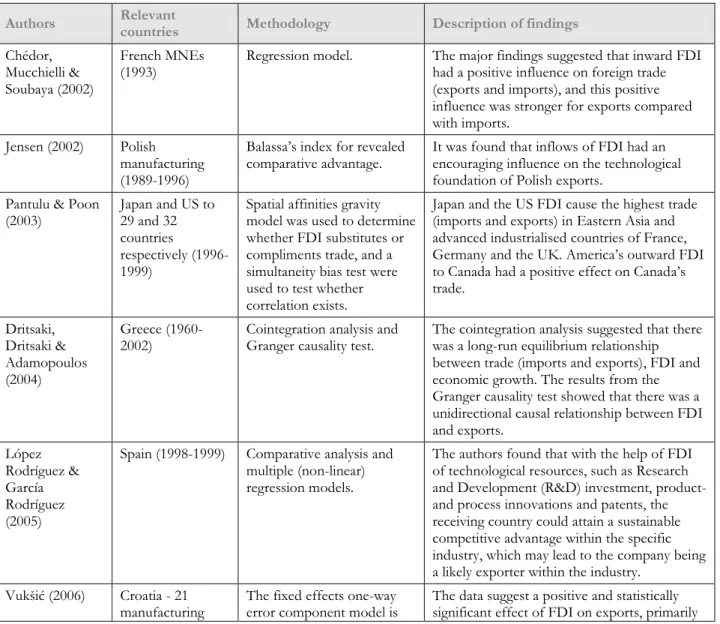
- Literature overview
- The relationship between inward FDI and exports in developed countries
- The relationship between inward FDI and exports in developing countries
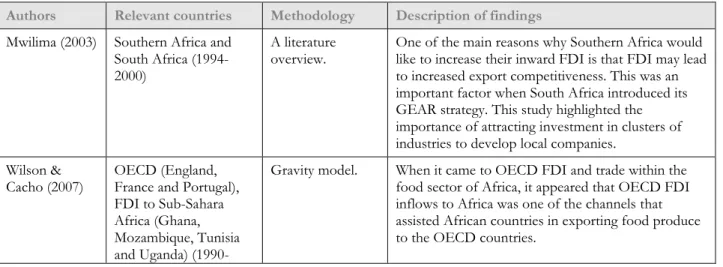
- The relationship between inward FDI and exports in African countries
- Summary and concluding remarks
For example, for "developed" countries, the IMF uses "advanced", the UNDP uses "developed", and the World Bank uses "high income", while for "developing" they all use the terms. Several studies focus on the relationship between inward foreign direct investment and exports within the African context.
Descriptive analysis of BRIC’s FDI and SADC’s exports
Introduction
World FDI into SADC
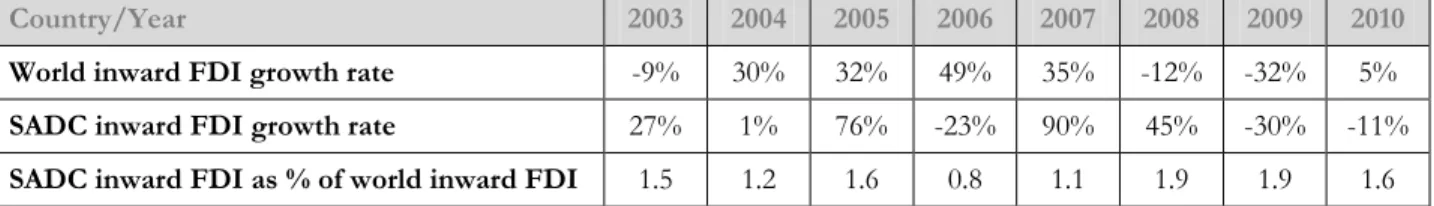
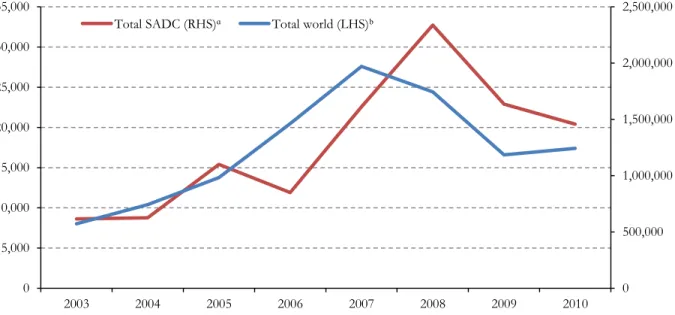
Figure 3.1 clearly shows that foreign direct investment inward to the world increased gradually between 2003 and 2007, while SADC inward foreign direct investment increased significantly between 2006 and 2008. From 2007 to 2009, the world experienced a decline in inward foreign direct investment. due to the aftermath of the financial crisis. In comparison, SADC inward foreign direct investment seems to follow a similar pattern to the world's inward foreign direct investment.
It is further evident in Table 3.2 that South Africa has experienced a significant decline in inward FDI flows. The DRC shows significant overall growth from 2003 to 2010, with a 651 percent increase in inward FDI flows over the period.
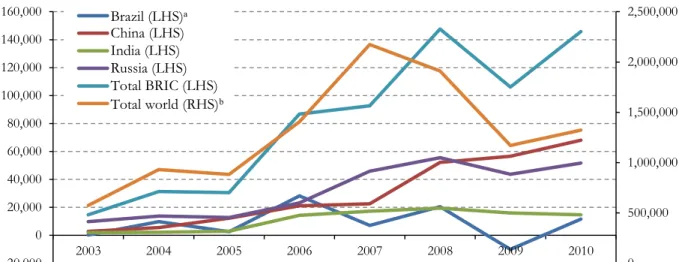
BRIC FDI outflows to the world
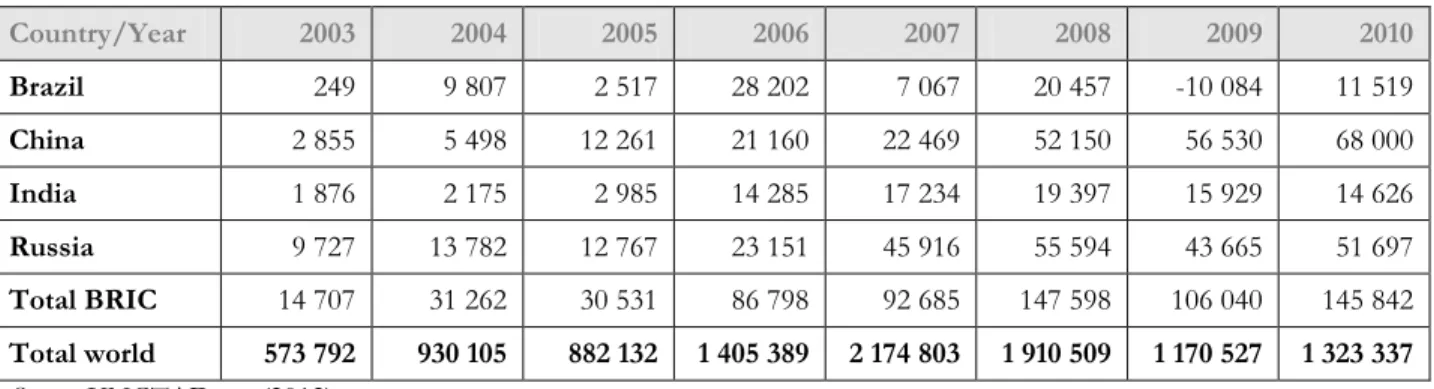
Moreover, it is clear that the BRIC countries saw an overall increase in outward foreign direct investment between 2003 and 2008, after which they experienced a decline in 2009. Between 2003 and 2010, the BRIC countries have seen total outbound foreign direct growth of about 892 percent. Table 3.3 also shows that China experienced large foreign direct foreign investments in the period 2003 to 2010.
It appears that China took over the "driving" role of BRICS outward FDI in 2008, displacing Russia, which was the main player from 2003 to 2007. From Figure 3.4, it is clear that from 2003 to 2006 and from 2008 to 2010, BRIC and the world had a similar outward FDI pattern, with BRIC experiencing a stronger positive trend compared to the world.
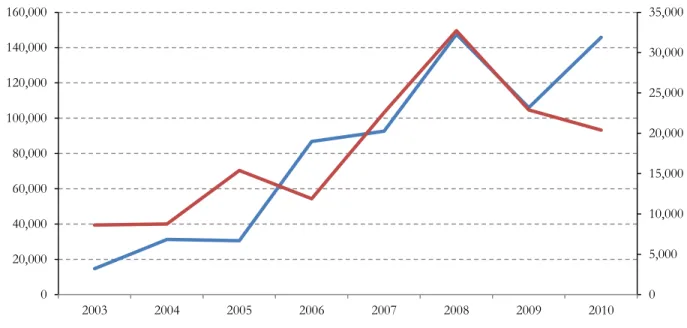
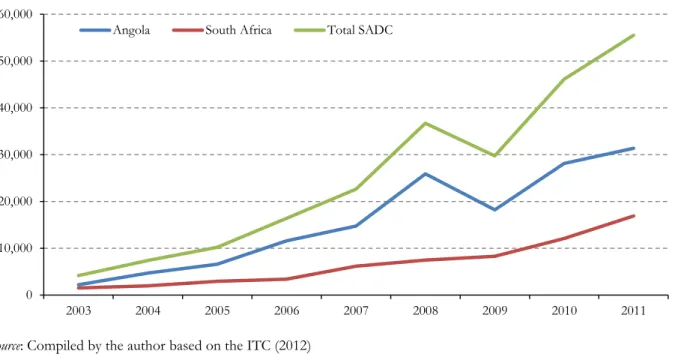
BRIC’s outward FDI flows compared to SADC’s inward FDI flows
The BRIC countries have experienced overall positive strong growth in outward foreign direct investment, with China and Russia being the main driving forces in the latter. From Figure 3.5, it can be seen that from late 2007 to 2009, SADC experienced a similar trend in inward FDI from the world than BRICs outward FDI to the world. This may illustrate that in the period 2008 to 2009 there were more BRIC FDI outflows to the SADC countries.
However, to determine whether FDI flows from the BRIC countries went more to SADC, country-by-country data will need to be disaggregated to confirm this (see Chapter 4 for a quantitative analysis).
BRIC Greenfield and M&A FDI outflows to SADC
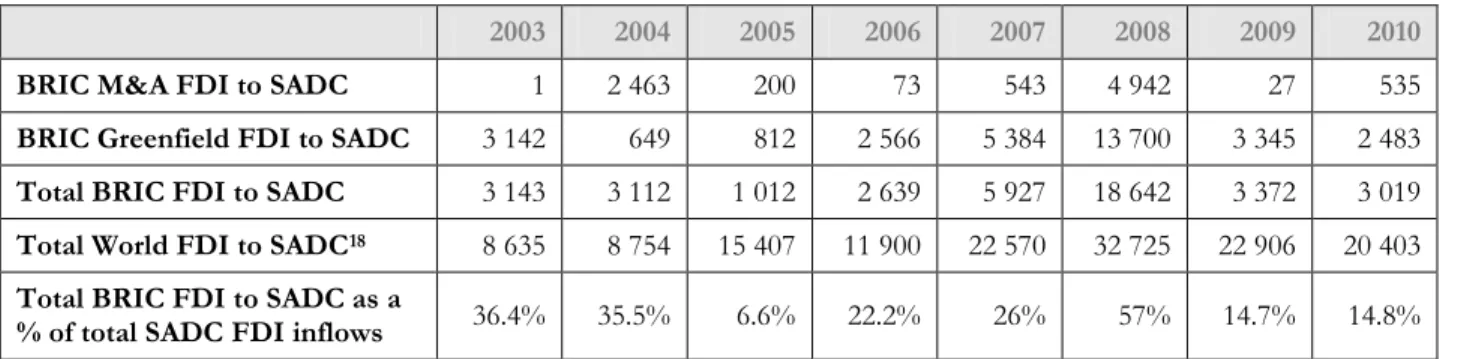
From table 3.4 it is clear that the inflows of BRIC FDI in the KZDF are dominated by Greenfield FDI. One reason that total BRIC FDI to EDC as a percentage of total EDC FDI inflows is so low in 2005 (roughly 7 percent) can be attributed to South Africa, the largest recipient largest FDI in Africa in 2005, taking a buyout of the United Bank of South Africa (ABSA) from Barclays Bank (UK) for $5 billion (UNCTAD) this transaction distorted total SADC flows. From table 3.4 , it is further evident that M&A deals from BRIC exceeded the amount of Greenfield deals from BRIC to SADC in 2004.
FDImarkets® (2012) indicated that between January 2003 and December 2010, a total of 187 Greenfield FDI projects were recorded from BRIC to SADC, equivalent to a 0.2 percent share of global Greenfield FDI within this period. Regarding the M&A investments from the BRIC countries to the SADC, the majority of M&A investments (86 percent) during the 2003 to 2010 period went to South Africa, followed by Mauritius (6.6 percent) during the same period.
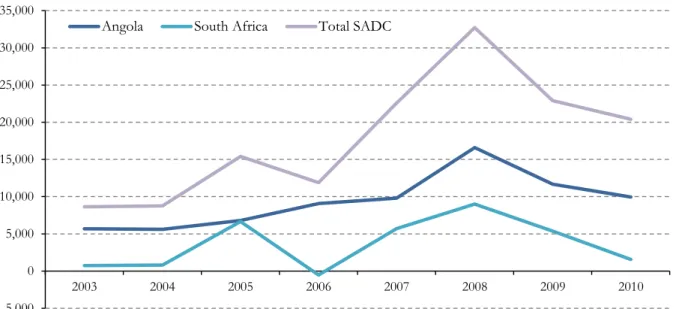
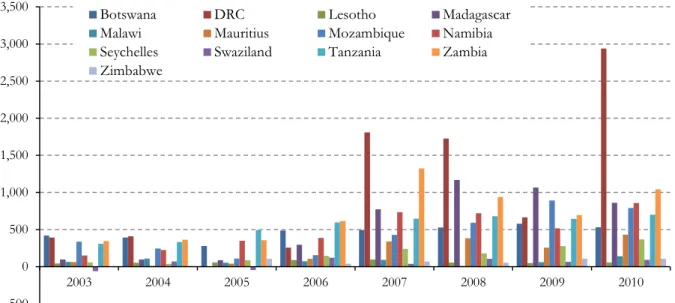
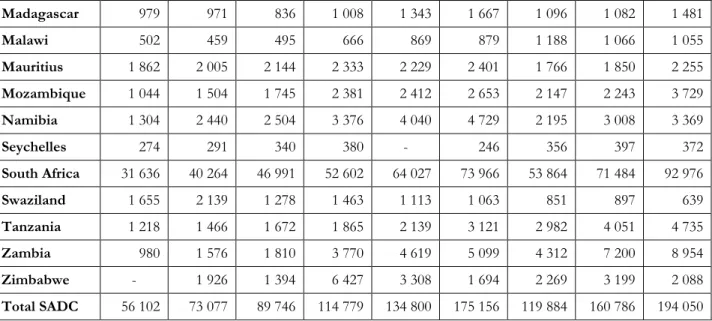
SADC exports to the world
The remaining 7.4 percent was calculated and distributed in detail among the remaining 11 SADC countries. South Africa contributed 49 percent to total SADC exports over the entire period and Angola contributed 28 percent to total SADC exports. Exports of most SADC countries (i.e. Angola, DRC, Mozambique, Namibia, South Africa, Tanzania and Zambia) increased significantly from 2003 to 2008, but saw a decline in 2009 due to the 2008 financial crisis, only to return to normal and higher levels in 2010 and 2011.
SADC's overall major exports to the world are dominated by exports to the coal, oil and natural gas industries. South Africa's main exports to the world are within the metals industry, while Angola's main export products to the world are within the coal, oil and natural gas industry (ITC, 2012).
SADC exports to BRIC
From Figure 3.9 it is clear that Angola is the main exporter and trendsetter within the SADC to the BRIC countries, followed by South Africa. Angola represented about 63 percent and South Africa about 27 percent of SADC's total exports to the BRIC countries over the period 2003 to 2010. Angola's main exports to the BRIC countries are within the coal, oil and natural gas industries .
The largest export to the BRIC countries for all three countries is within the metal industry. The rest of the SADC countries have relatively positive to flat trends, indicating no significance for export growth to the BRIC countries in the period 2003 to 2011.
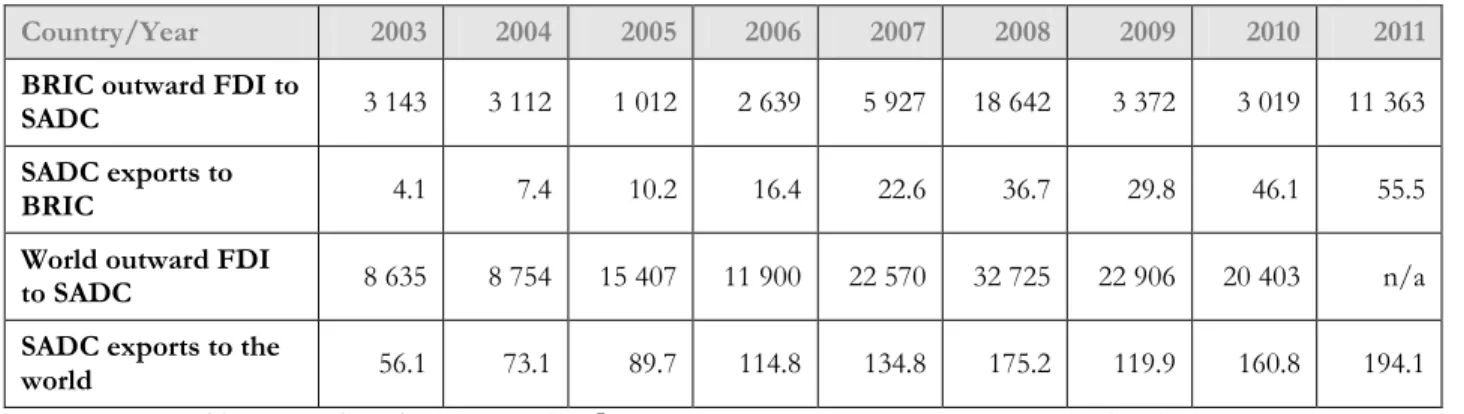
BRIC and world outward FDI to SADC vs. SADC exports to BRIC and the world
SADC exports to BRIC countries and the world It is important to understand whether there is some kind of prudent relationship between the BRIC countries. Exports from the SADC region to the world increased much faster than SADC region's exports to the BRIC countries (albeit from a lower level), increasing the BRIC's share of SADC's total exports in 2011 of 29 percent grew from just 7 percent in 2003. SADC exports to BRIC (LHS)ᵅ SADC exports to the world (LHS) BRIC outgoing FDI to SADC (RHS)ᵇ World outgoing FDI to SADC (RHS).
Comparing the graph of BRIC and world outward FDI with SADC and SADC's exports to BRIC and the world in Figure 3.11, it appears that a similar trend exists, especially in the period 2006 to 2009. However, SADC's exports to the world take a strong positive turn from 2009 to 2011, while world and BRIC's FDI is experiencing a downturn.
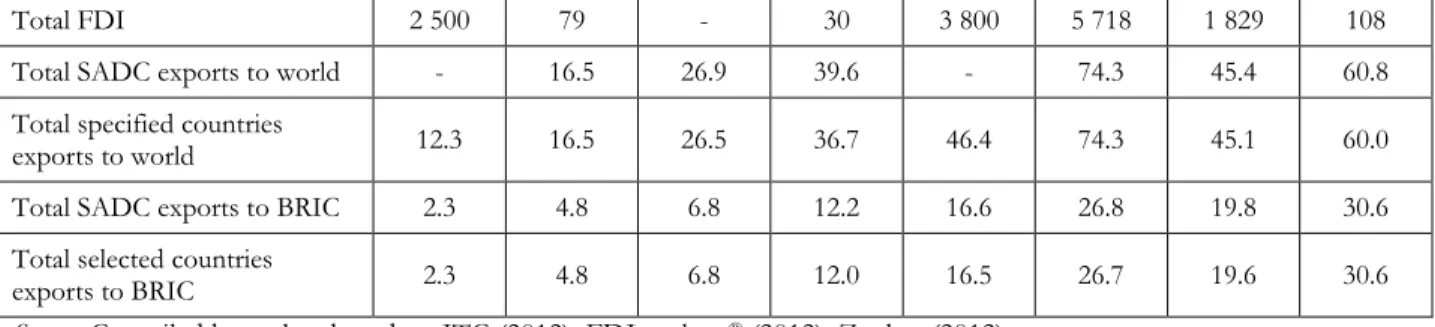
Industry comparison between BRIC FDI to SADC and SADC exports to BRIC
Table 3.7 shows that within the coal, oil and natural gas industry only six of the fifteen SADC countries received investments, namely Angola, Mozambique, Mauritius, South Africa, Zambia and Namibia. In the BRIC countries, India seems to have been the largest and most frequent investor in the relevant sector during the period under review (see section 3.5). Within the ITC (2012), exports within the metal industry are combined as a variety of HS codes are covered by the metal industry classification; Ores Slag and Ashes (HS 26), Pearls, Gemstones, Metals, Coins, etc.
These countries' exports represent approximately 94 percent of total SADC intra-industry exports to the world and 95 to 99 percent of intra-industry exports to BRIC over the entire time period specified (See Sections 3.6 and 3.7). Of the BRIC countries, China appears to have been the largest and most frequent investor, and South Africa appears to be the largest recipient of FDI in the metals industry over the specified time period (See Section 3.5).
Summary and concluding remarks
This could possibly illustrate that more BRIC-FDI outflows went to the SADC countries during the same period. However, the value of projects China had for the SADC surpassed India's in the same period. It was clear that South Africa and Angola were the main exporters and drivers of exports within the SADC and clearly determined the export trend of the SADC to the world.
SADC's main exports to the world were in the coal, oil and natural gas industries. It was illustrated that there could be a possible relationship between the BRIC and foreign foreign direct investment to the SADC and the SADC's exports to the world, especially in the period 2006 to 2009.
FDI and export performance: Empirical evidence for the SADC economies
- Introduction
- The relationship between FDI and exports
- Empirical analysis
- Estimation of model and results
- Correlation and covariance of the SADC exports and FDI
- The regression estimation
- The Granger causality tests
- Panel data analysis on FDI and exports
- Summary and concluding remarks
Data on SADC exports to the world and to the BRIC had to be sourced separately from the Trade Map data of the ITC (2012). BRIC-FDI on SADC exports to the world does not indicate a decisive rejection of the models' overly identifiable limitations. Conversely, Table 4.11 shows that the results of the causality tests between the SADC export to the BRIC and the BRIC-FDI are not reliable.
Therefore, the rest of the models for world exports were not interpreted further. Conversely, the results of causality tests between SADC exports to BRIC and BRIC FDI were not reliable.
Conclusions and recommendations
Introduction
Chapter 2 presented a theoretical perspective on studies conducted on the relationship between FDI and trade in developed, developing and African countries.
Summary of the results and conclusions of the study
An estimate was made of the impact of FDI inflows from the BRIC on SADC's export performance to the BRIC and to the world. The model advanced the idea that the BRIC's foreign direct investment in SADC exports to the world may be serially correlated. In addition, it was suggested that about 53 percent of the variance in SADC exports to the BRIC could be explained solely by foreign direct investment from the BRIC.
The section examined the relationship between BRIC FDI and SADC exports to the world and to the BRICs using Holtz-Eakin panel causality tests. Estimations using GMM system estimators showed that SADC exports to the world cause FDI and vice versa.
Recommendations
Global Financial Markets (Working Papers on Global Financial Markets. no.. http://www.gfinm.de/images/stories/workingpaper8.pdf Date accessed: 20 Mar. FDI, trade and growth, a causal link. The role of South Africa in BRICS: implications and impacts http://uscdn.creamermedia.co.za/assets/articles/attachments/34069_sa_role_in_bricsreduced.pdf Date accessed: 14 February Policy Issues in International Trade and Commodities Study Series No. 26). http://unctad.org/en/Docs/itcdtab27_en.pdf.
Cairo Review of Global Affairs, July 11 http://www.aucegypt.edu/gapp/cairoreview/pages/articleDetails.aspx?aid=75 Date Accessed: February 16 African Labor Resources Unit (Draft Final Report) http ://www.sarpn.org/documents/d0000883/P994-African_Social_Observatory_PilotProject_FDI.pdf Date accessed: 8 June.