13
CHAPTER II
THEORITICAL REVIEW
A. Theories
1. Co-movement
Being a specific technical term, it could not be found in common dictionary (Baur, 2004). Though some web dictionary tries to define the word, from web free
encyclopedia “co-movement effect” represents the movement together of atomic
nucleus and electron to the center6. Other similar definition is shared from different
free encyclopedia and online dictionary stating that, “co-movement” as “the
correlated or similar movement of two or more entities7” Then, the tendency of two variables moving in parallel is the most appropriate term illustrated by the example of the return from two investments. The co-movement pattern is determined by correlation coefficient or covariance8. Commonly, it is then important to study this topic to determine how efficient is the diversification and how does the financial system function (Baur, 2004).
2. Relationship between co-movement, contagion, co-integration, integration
Co-movement derived from commove related to commotion that is sharing movement or moving with may be normal or excess or extreme (Forbes and Rigobon,
6
This definition is taken from the McGraw-Hill Dictionary of Scientific & Technical Terms, 6E, Copyright © 2003 by The McGraw-Hill Companies, Inc.
7
Co-movement, retrieved from http://glosbe.com/en/en/comovement and http://en.wiktionary.org/wiki/comovement, April 03, 2013
14
2002). If it is resulted from shock such as financial crisis, co-movement is viewed as contagion. Moreover, contagion is the dissemination of market disturbance (Dornbush, Park and Classen, 2000), the shock may spread over other markets. These markets move together during crisis. Furthermore, internationally, contagion it is the significant increase of linkage transmitted to another country while cross-market is concerned (Forbes and Rigobon, 2002). Concerning co-integration is the movement of two time series in the same direction that the two non-stationary time series produce a stationary one. Co-integration may describe the long-run economic equilibrium of the market (Mollah and Hartman, 2012). Integration, mostly in economic integration that is based on trade, there is linkage trade between countries.
3. General causes of co-movement
Factors are interrelated and have impact over each over (Benada, Yang, Khouv and Schutte).Globalization enlarges the activities in international scene, as it worldwide integration and development, it broadens the activities for instance a country can issues bonds or other contract in other countries. Then, change that makes the market much more interrelated every country operates the financial activity
throughout connection that arises the speculator and investor’s different strategy.
15
contagion. Moreover, lack of global system persists since there is no world central bank. International event can cause countries shock like change in crude oil price (Tsutsui and Hirayama).
4. International investment diversification: portfolio aspect
4.1 International diversification
As environment has changed, global context becomes a real object investors have to take into consideration9. It consists of trading or investing throughout various countries and securities10. Many are the researches made that demonstrate the benefit of investor while opting to the international diversification of portfolio investment11. As domestic assets by its loss from correlation limits investment yield, international investing is said highly beneficial both for individual and corporate as well (Obiri, 2011). Somehow, in spite of the increase of cross-border equity holdings, due to
market friction, investors’ tendency still remain on disproportionate domestic stocks
while building their portfolio (Coeurdacier and Guibaud, 2009). Then key is given by demonstrating the advantage of diversifying the domestic equities.
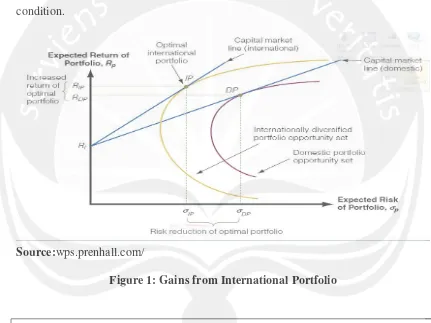
The figure below shows the benefit from shifting domestic equities investment to international prospect. The capital market lines for both options give
9
Investment Principle and concepts, Charles. P. Jones, 11th edition, 2010 (14) it stresses as this is a ust’ for i estors.
10
While defining the International diversification, retrieved from http://financial
dictionary.thefreedictionary.com/International+Diversification, (April 2013)
11
16
evidence of the yields resulting from rational option. Efficient portfolio becomes the main target if trying to interpret the return and risk for international portfolio (IP) versus domestic portfolio (DP). As with the reduction to risk, international portfolio offer a positive difference in return compared to the DP. It confirms the ideal and general assertion on investors’ attitude since profit maximization requires this desired condition.
Source:wps.prenhall.com/
Figure 1: Gains from International Portfolio
17
4.2 Risk and return on diversification
4.2.1Risk
The assumption of classical portfolio theory of investor risk-averse typical behavior implies a certain degrees of risk acceptance but proportional to the expected return12. Besides, investors always face risk towards the favorable diversification. Risks or the chance viewed also as the probability of deviation13 that oppose
investor’s expectation, characterizes the field of investment whether domestic or
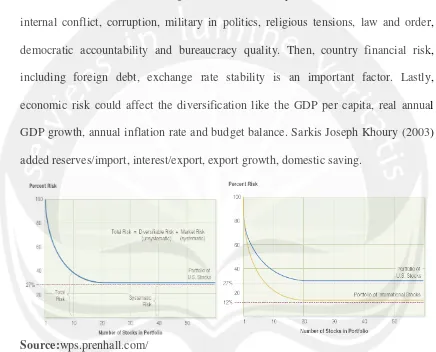
global. Risks could be classified into two main categories; the diversifiable risk (unsystematic risk, specific risk) and the non-diversifiable risk (systematic risk, market risk). Somehow, amongst all, the typical risks for international investment prevail in exchange rate risk and country-specific risk.
4.2.1.1 Exchange rate risk
Generally, every country has the local currency which may be a soft currency. Transaction is often contracted within the hard currency like USD, thus, investor has to be exposed to uncertainty in asset return as exchange rate between currencies fluctuates.
4.2.1.2 Country-specific risk
Country risk represents the business climate change within the country in concern. Its effect is important than the specificity or differences (size of stock
12
Topics in International finance, Part 6, chapter 17, International Portfolio Theory and Diversification page W-6. Risk and return coexists investor has to face.
13
18
market, banking sector, openness) that exist across countries (Driessen and Laeven, 2004). Among the other risks country risk may occur in the form of the following.
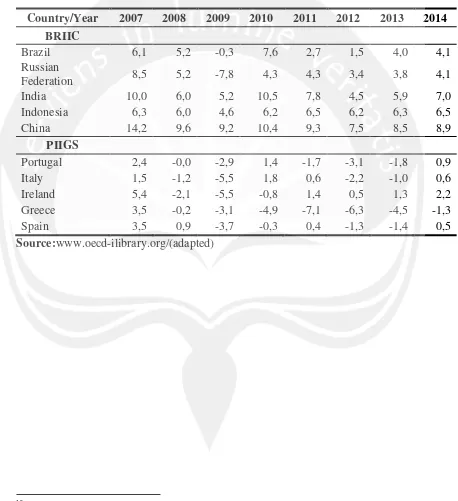
Political risk such as government instability, socioeconomic conditions, internal conflict, corruption, military in politics, religious tensions, law and order, democratic accountability and bureaucracy quality. Then, country financial risk, including foreign debt, exchange rate stability is an important factor. Lastly, economic risk could affect the diversification like the GDP per capita, real annual GDP growth, annual inflation rate and budget balance. Sarkis Joseph Khoury (2003) added reserves/import, interest/export, export growth, domestic saving.
Source:wps.prenhall.com/
Figure 2: Portfolio risk and diversification
19
4.2.2 Return
Function by time period, return results from the change of value of the investment. Common methods used for determining return are HPR (with or without dividend), CAPM. Return on international diversification is higher.
B. Global stock market and economy, BRIIC and PIIGS
1. Economy of BRIIC and PIIGS
Apart from the above mentioned findings concerning the BRIIC group, this term is also supported by OECD14 by adding South Africa becoming BRIICS, though our concern remains the former group. Some economic important variables (growth GDP (real value), balance, export/import and population growth) are used to reflect both group economy towards the whole world.
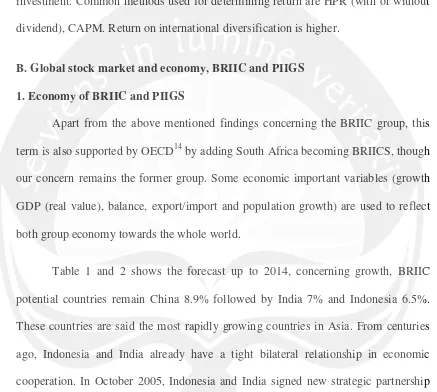
Table 1 and 2 shows the forecast up to 2014, concerning growth, BRIIC potential countries remain China 8.9% followed by India 7% and Indonesia 6.5%. These countries are said the most rapidly growing countries in Asia. From centuries ago, Indonesia and India already have a tight bilateral relationship in economic cooperation. In October 2005, Indonesia and India signed new strategic partnership including II CECA. For PIIGS, Ireland is hoped to reach the level of 2.2% whereas Greece still in decrease with negative value of -1.3%. Governments balance somehow
14
20
in overall tends to be negative due to the fact that allocation to public investment remains higher for population care and economic concern.
Table 1: Growth rate (GDP real value %)15
Country/Year 2007 2008 2009 2010 2011 2012 2013 2014
BRIIC
Brazil 6,1 5,2 -0,3 7,6 2,7 1,5 4,0 4,1
Russian
Federation 8,5 5,2 -7,8 4,3 4,3 3,4 3,8 4,1
India 10,0 6,0 5,2 10,5 7,8 4,5 5,9 7,0
Indonesia 6,3 6,0 4,6 6,2 6,5 6,2 6,3 6,5
China 14,2 9,6 9,2 10,4 9,3 7,5 8,5 8,9
PIIGS
Portugal 2,4 -0,0 -2,9 1,4 -1,7 -3,1 -1,8 0,9
Italy 1,5 -1,2 -5,5 1,8 0,6 -2,2 -1,0 0,6
Ireland 5,4 -2,1 -5,5 -0,8 1,4 0,5 1,3 2,2
Greece 3,5 -0,2 -3,1 -4,9 -7,1 -6,3 -4,5 -1,3
Spain 3,5 0,9 -3,7 -0,3 0,4 -1,3 -1,4 0,5
Source:www.oecd-ilibrary.org/(adapted)
15
21
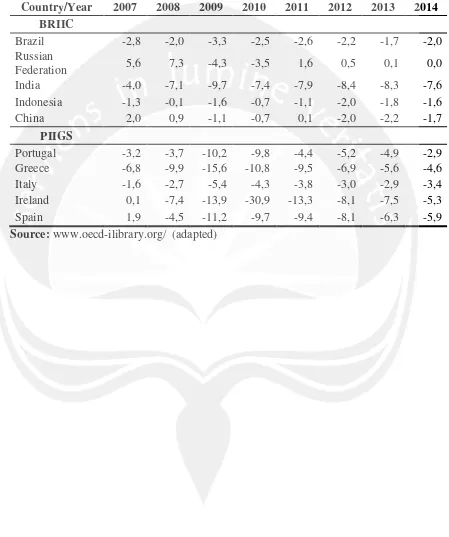
Table 2: General government financial balance, surplus (+), deficit (-) (%)
Country/Year 2007 2008 2009 2010 2011 2012 2013 2014
BRIIC
Brazil -2,8 -2,0 -3,3 -2,5 -2,6 -2,2 -1,7 -2,0 Russian
Federation 5,6 7,3 -4,3 -3,5 1,6 0,5 0,1 0,0 India -4,0 -7,1 -9,7 -7,4 -7,9 -8,4 -8,3 -7,6 Indonesia -1,3 -0,1 -1,6 -0,7 -1,1 -2,0 -1,8 -1,6
China 2,0 0,9 -1,1 -0,7 0,1 -2,0 -2,2 -1,7
PIIGS
Portugal -3,2 -3,7 -10,2 -9,8 -4,4 -5,2 -4,9 -2,9 Greece -6,8 -9,9 -15,6 -10,8 -9,5 -6,9 -5,6 -4,6 Italy -1,6 -2,7 -5,4 -4,3 -3,8 -3,0 -2,9 -3,4 Ireland 0,1 -7,4 -13,9 -30,9 -13,3 -8,1 -7,5 -5,3 Spain 1,9 -4,5 -11,2 -9,7 -9,4 -8,1 -6,3 -5,9
22
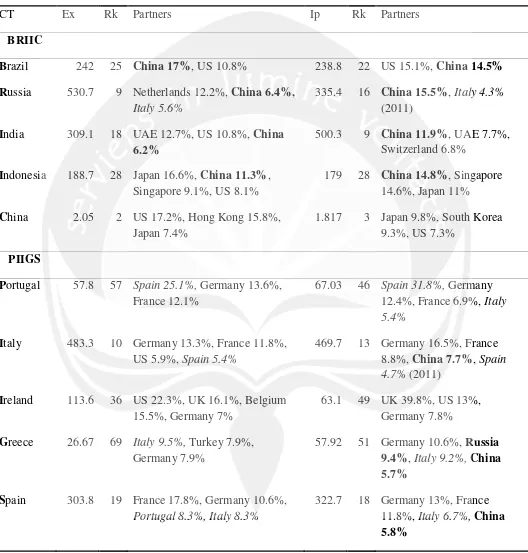
Table 3: BRIIC export and import
CT Ex Rk Partners Ip Rk Partners
BRIIC
Brazil 242 25 China 17%, US 10.8% 238.8 22 US 15.1%, China 14.5% Russia 530.7 9 Netherlands 12.2%, China 6.4%,
Italy 5.6%
335.4 16 China 15.5%, Italy 4.3%
(2011)
India 309.1 18 UAE 12.7%, US 10.8%, China 6.2%
500.3 9 China 11.9%, UAE 7.7%, Switzerland 6.8%
Indonesia 188.7 28 Japan 16.6%, China 11.3%, Singapore 9.1%, US 8.1%
179 28 China 14.8%, Singapore
14.6%, Japan 11%
China 2.05 2 US 17.2%, Hong Kong 15.8%, Japan 7.4%
1.817 3 Japan 9.8%, South Korea 9.3%, US 7.3%
PIIGS
Portugal 57.8 57 Spain 25.1%, Germany 13.6%, France 12.1%
67.03 46 Spain 31.8%, Germany 12.4%, France 6.9%, Italy 5.4%
Italy 483.3 10 Germany 13.3%, France 11.8%, US 5.9%, Spain 5.4%
469.7 13 Germany 16.5%, France 8.8%, China 7.7%, Spain 4.7% (2011)
Ireland 113.6 36 US 22.3%, UK 16.1%, Belgium 15.5%, Germany 7%
63.1 49 UK 39.8%, US 13%, Germany 7.8%
Greece 26.67 69 Italy 9.5%, Turkey 7.9%, Germany 7.9%
57.92 51 Germany 10.6%, Russia 9.4%, Italy 9.2%,China 5.7%
Spain 303.8 19 France 17.8%, Germany 10.6%,
Portugal 8.3%, Italy 8.3%
322.7 18 Germany 13%, France 11.8%, Italy 6.7%,China 5.8%
23
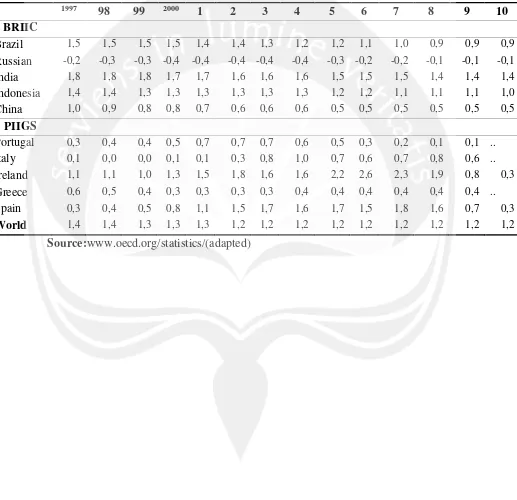
Table 4: Population growth
Source:www.oecd.org/statistics/(adapted)
1997 98 99 2000 1 2 3 4 5 6 7 8 9 10
BRIIC
Brazil 1,5 1,5 1,5 1,5 1,4 1,4 1,3 1,2 1,2 1,1 1,0 0,9 0,9 0,9
Russian -0,2 -0,3 -0,3 -0,4 -0,4 -0,4 -0,4 -0,4 -0,3 -0,2 -0,2 -0,1 -0,1 -0,1
India 1,8 1,8 1,8 1,7 1,7 1,6 1,6 1,6 1,5 1,5 1,5 1,4 1,4 1,4
Indonesia 1,4 1,4 1,3 1,3 1,3 1,3 1,3 1,3 1,2 1,2 1,1 1,1 1,1 1,0
China 1,0 0,9 0,8 0,8 0,7 0,6 0,6 0,6 0,5 0,5 0,5 0,5 0,5 0,5
PIIGS
Portugal 0,3 0,4 0,4 0,5 0,7 0,7 0,7 0,6 0,5 0,3 0,2 0,1 0,1 ..
Italy 0,1 0,0 0,0 0,1 0,1 0,3 0,8 1,0 0,7 0,6 0,7 0,8 0,6 ..
Ireland 1,1 1,1 1,0 1,3 1,5 1,8 1,6 1,6 2,2 2,6 2,3 1,9 0,8 0,3
Greece 0,6 0,5 0,4 0,3 0,3 0,3 0,3 0,4 0,4 0,4 0,4 0,4 0,4 ..
Spain 0,3 0,4 0,5 0,8 1,1 1,5 1,7 1,6 1,7 1,5 1,8 1,6 0,7 0,3
24
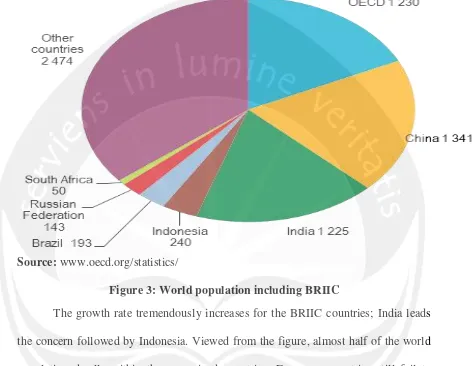
Source: www.oecd.org/statistics/
Figure 3: World population including BRIIC
The growth rate tremendously increases for the BRIIC countries; India leads the concern followed by Indonesia. Viewed from the figure, almost half of the world population dwells within these survived countries. European countries still fail to make its citizen younger.
25
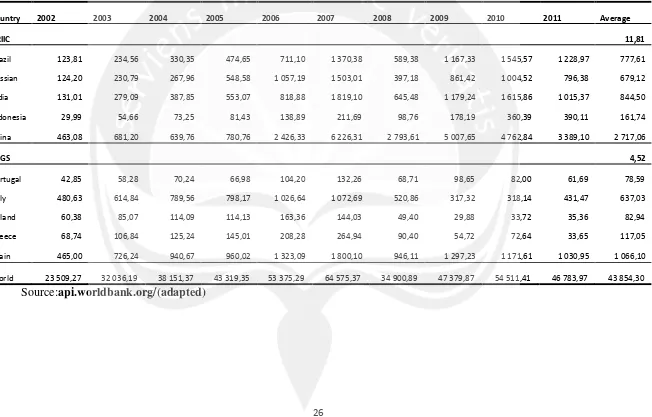
2. Stock market
26
Table 5: BRIIC and PIIGS Market capitalization (in Billion USD)
Source:api.worldbank.org/(adapted)
Country 2002 2003 2004 2005 2006 2007 2008 2009 2010 2011 Average
BRIIC 11,81
Brazil 123,81 234,56 330,35 474,65 711,10 1 370,38 589,38 1 167,33 1 545,57 1 228,97 777,61
Russian 124,20 230,79 267,96 548,58 1 057,19 1 503,01 397,18 861,42 1 004,52 796,38 679,12
India 131,01 279,09 387,85 553,07 818,88 1 819,10 645,48 1 179,24 1 615,86 1 015,37 844,50
Indonesia 29,99 54,66 73,25 81,43 138,89 211,69 98,76 178,19 360,39 390,11 161,74
China 463,08 681,20 639,76 780,76 2 426,33 6 226,31 2 793,61 5 007,65 4 762,84 3 389,10 2 717,06
PIIGS 4,52
Portugal 42,85 58,28 70,24 66,98 104,20 132,26 68,71 98,65 82,00 61,69 78,59
Italy 480,63 614,84 789,56 798,17 1 026,64 1 072,69 520,86 317,32 318,14 431,47 637,03
Ireland 60,38 85,07 114,09 114,13 163,36 144,03 49,40 29,88 33,72 35,36 82,94
Greece 68,74 106,84 125,24 145,01 208,28 264,94 90,40 54,72 72,64 33,65 117,05
Spain 465,00 726,24 940,67 960,02 1 323,09 1 800,10 946,11 1 297,23 1 171,61 1 030,95 1 066,10
27
C. Literature review
Researchers often consider to differentiate the world countries co-movement in general without focusing on the two different groups. Sometimes they mixed the elements with the other country economic classifications. Concerning the survived countries, Gupta (2011) tries to focus on the first cluster but it excludes Indonesia. The findings between BRIC series conclude that the series are not normally distributed; they are at stationary level and correlated positively. Among the countries; Russia, India and China have impact over Brazil economy the same as India over Russia viewed by Granger causality with unidirectional causality only. Whereas China granger-causes Russia and India and reversely. In sum, co-movement exists within the elements of the cluster.
For Modi, Patel and Patel (2010), while studying the co-movement between Brazil, Russia and India with other markets including Hong Kong, Mexico, US and UK; Russian RTS index represents the highest volatile market among them. For pairing studies, Brazil-Hong Kong, US (DJIA-NASDAQ) and UK-Brazil are the most correlated volatile markets. The finding ended by dividing the markets into two other different groups in which US investors have opportunity if investing in Indian and Russian markets.
28
the times in those that are newly blooming ones. Other markets are influenced only by those of Brazil, Russia and US though they do not affect the latters.
If considering the PIIGS countries, Tatomir and Alexe, (2012) make comparison between them versus CEE members using quantitative economic analysis (ECI and SCI) and more focus on economic interrelationship among them. Only Italy has no progress in economic development. Moreover, in 2010, PIIGS recognized the highest economic convergence. Throughout the period Italy and Ireland did.
Furthermore, Baskaran and Hessani, (2011) put stress on the debt crisis that have occurred especially in the EMU area. PIIGS countries are tighter in their fiscal policy before the introduction of the Euro. After adopting the Euro system, the group looses it and with higher degree of borrowing expecting the bailout policy while crisis will take place.
29
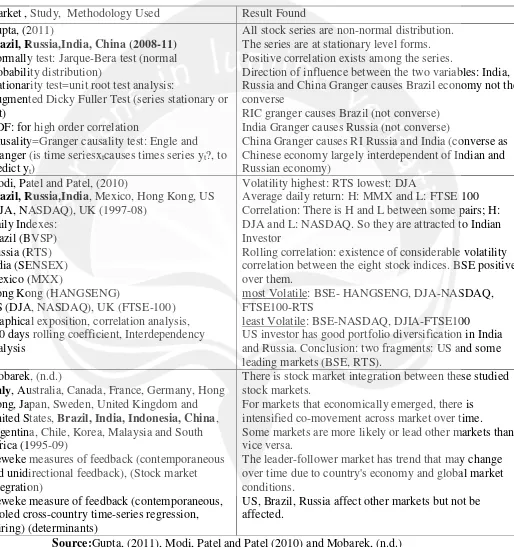
1. BRIIC countries co-movement
Table 6: Findings on BRIIC countries co-movement
Market , Study, Methodology Used Result Found Gupta, (2011)
Brazil, Russia,India, China (2008-11)
Normally test: Jarque-Bera test (normal probability distribution)
Stationarity test=unit root test analysis:
Augmented Dicky Fuller Test (series stationary or not)
ADF: for high order correlation
Causality=Granger causality test: Engle and Granger (is time seriesxtcauses times series yt?, to predict yt)
All stock series are non-normal distribution. The series are at stationary level forms. Positive correlation exists among the series.
Direction of influence between the two variables: India, Russia and China Granger causes Brazil economy not the converse
RIC granger causes Brazil (not converse) India Granger causes Russia (not converse)
China Granger causes RI Russia and India (converse as Chinese economy largely interdependent of Indian and Russian economy)
Modi, Patel and Patel, (2010)
Brazil, Russia,India, Mexico, Hong Kong, US
(DJA, NASDAQ), UK (1997-08) Daily Indexes:
Brazil (BVSP) Russia (RTS) India (SENSEX) Mexico (MXX)
Hong Kong (HANGSENG)
US (DJA, NASDAQ), UK (FTSE-100) Graphical exposition, correlation analysis, 200 days rolling coefficient, Interdependency analysis
Volatility highest: RTS lowest: DJA
Average daily return: H: MMX and L: FTSE 100 Correlation: There is H and L between some pairs; H: DJA and L: NASDAQ. So they are attracted to Indian Investor
Rolling correlation: existence of considerable volatility correlation between the eight stock indices. BSE positive over them.
most Volatile: BSE- HANGSENG, DJA-NASDAQ, FTSE100-RTS
least Volatile: BSE-NASDAQ, DJIA-FTSE100 US investor has good portfolio diversification in India and Russia. Conclusion: two fragments: US and some leading markets (BSE, RTS).
Mobarek, (n.d.)
Italy, Australia, Canada, France, Germany, Hong
Kong, Japan, Sweden, United Kingdom and United States, Brazil, India, Indonesia, China, Argentina, Chile, Korea, Malaysia and South Africa (1995-09)
Geweke measures of feedback (contemporaneous and unidirectional feedback), (Stock market integration)
Geweke measure of feedback (contemporaneous, pooled cross-country time-series regression, pairing) (determinants)
There is stock market integration between these studied stock markets.
For markets that economically emerged, there is intensified co-movement across market over time. Some markets are more likely or lead other markets than vice versa.
The leader-follower market has trend that may change over time due to country's economy and global market conditions.
US, Brazil, Russia affect other markets but not be affected.
30
2. PIIGS countries interrelationship
Table 7: Findings on PIIGS countries interrelationship
Market , Study, Methodology Used Result Found Tatomir, &Alexe, (2012)
PIIGS: Portugal, Italy, Ireland, Greece and
Spain vs CEE: Bulgaria, Czech Republic, Estonia, Latvia, Lithuania, Hungary, Poland, Romania, Slovenia, and Slovakia
(2000.08.10)
Quantitative analysis
ECI: Economic Convergence Index, variables used: GDP (ppp), labor and price; method used: GEA (Group of Applied Economics) SCI: Structural Convergence Index, variables used: GVA; agriculture, industry,
construction, trade, financial service and other services; method used: ISD by Krugman
Only Italy has no progress but all have made improvement in catching up in the last decade, the most are Ireland and Slovakia
In 2010, for PIIGS, had the highest level of economic convergence, for CEE: Slovenia had
Italy and Ireland have the higher degree of convergence in the Euro Area throughout the period
Baskaran, &Hessani, (2011)
PIIGS: Portugal, Italy, Ireland, Greece and
Spain EU: Austria, Belgium, Czech Republic, Denmark, Finland, France, Germany,
Sweden, Luxemburg, Netherlands, Norway, Poland, Hungary, Iceland, UK (1975-09) difference-in-difference methodology Using Maastricht Treaty contract (deficit within the time period measurement)
significant effect is viewed with PIIGS rather than with other EMU countries on public borrowing PIIGS more consolidated until the introduction of Euro
While Introducing Euro PIIGS countries loose their fiscal policy, their borrowing was increased noticeably, they believed on bailout commitment to sort out debt crisis
31
3. Both groups BRIIC and PIIGS countries co-movement
Table 8: Findings on both BRIIC and PIIGS countries co-movement
Market , Study, Methodology Used Result Found Evans, & McMillan, (2006)
33 stocks including PIIGS (Portugal as Italy as G7,
PIIGS: Portugal (South Europe), Italy (member
of G7), Ireland (North Europe), Greece (South Europe) and Spain (South Europe)
BRIIC: Brazil (Others), India (Others),
Indonesia (Asia) and China (Asia)
Co-integration analysis :not able to capture the fluid nature of financial integration only looks commonality over a fixed time frame, only gives economic significance in long-term horizon (1994-05)
Multivariate extension of GARCH model: require to ensure tractable estimation that makes result different from different GARCH
specification
Realized correlation: free from measurement error and provides a model free nonparametric framework
between the five groups there is a single co-integrating vector that means just one long-run stationary relationship
for Asia 2 co-integrating vectors number of common stochastic trends:
G7 there are six
North Europe there are eight South Europe there are three Asia there are eight
Others there are two
There is then evidence of co-movement among the international indices but not strong.
Correlation between US and the rest of the world is uptrend. Correlation between the other group exist but not too much the degree of co-movement is not high so there is still room for manager to portfolio
diversification regionally or globally
32
D. Hypothesis of the research
As the objective of the study reflects the existence of stock market integration and co-movement between the two main categories, the hypotheses enhance the approaches. Based on the background and research on the degree of integration among the international and domestic market returns, it should not be significantly positive (highly co-integrated) if to optimize profit (Harrison and Moore, 2010), hypotheses are formulated as the following:
H1: Stock markets between BRIIC and PIIGS countries are co-integrated
H2: Strong co-movement exists between the BRIIC and PIIGS countries through long- run relationship