1
DISTRICT MUNICIPALITY UMKHANDLU WESIFUNDA
D D D e e e l l l i i i v v v e e e r r r y y y t th t h hr r ro o ou u u g gh g h h I I In n n t t t e e e g gr g r ri i it t t y y y
DRAFT INTEGRATED DEVELOPMENT PLAN
2008/2009
2
COMPONENTS OF THIS REPORT
A Executive Summary B Situational Analysis C Development Strategies
D High Level Spatial Development Framework E Sector Involvement
F Implementation Plan G Projects
H Financial Plan and SDBIP
I Organisational Performance Management System J Annexures
K Appendices
3
TABLE OF CONTENTS
A. EXECUTIVE SUMMARY... 5
1. INTRODUCTION... 5
2. OVERVIEW OF THE DISTRICT... 6
3. INFRASTRUCTURE AND THE ECONOMY... 7
3.1 INFRASTRUCTURE...7
3.2 THE DISTRICT ECONOMY...14
4. KEY DEVELOPMENT ISSUES... 15
5. VISON AND STRATEGIC FOCUS AREAS... 16
5.1 5YEARSTRATEGICPLAN...16
5.2 STRATEGICFOCUSAREASANDOBJECTIVES...18
6. ZDM FUNDED PROJECTS... 20
7. PARTICIPATION AND ALIGNMENT... 21
B. SITUATIONAL ANALYSIS... 13
1. DETERMINATION OF DELIVERY BACKLOGS... 13
2. ZULULAND REGIONAL CONTEXT... 14
3. DEMOGRAPHIC CHARACTERISTICS... 17
4. THE NATURAL ENVIRONMENT... 23
5. THE ECONOMY... 28
5.1 TOURISM 29 5.2 AGRICULTURE...31
5.3 BUSINESS SECTOR...34
6. PHYSICAL INFRASTRUCTURE... 36
6.1 WATER AND SANITATION...36
6.2 TRANSPORT INFRASTRUCTURE...44
6.2.1 Road Infrastructure... 44
6.2.2 Rail Infrastructure... 50
6.2.3 Air transport Infrastructure... 51
6.3 ELECTRICITY...52
6.4 TELECOMMUNICATIONS...54
6.5 SOLID WASTE DISPOSAL...55
6.6 CEMETERIES...56
6.7 HOUSING 57 6.7.1 Determining the Housing Demand... 57
7. SOCIAL INFRASTRUCTURE... 59
7.1 EDUCATION...59
7.2 HEALTH FACILITIES...65
7.3 COMMUNITY FACILITIES...69
8. KEY DEVELOPMENT ISSUES... 71
C. DEVELOPMENT STRATEGIES... 76
4
1. VISION...... 76
2. STRATEGIC FOCUS AREAS... 76
D. SPATIAL DEVELOPMENT FRAMEWORK... 81
1. ROLE AND PURPOSE OF THE SDF... 81
2. GUIDING PRINCIPLES... 83
3. PONGOLAPOORT DAM DEVELOPMENT NODE... 85
4. EMAKHOSINI/OPAHTE DEVELOPMENT... 88
5. ULUNDI AIRPORT... 92
6. P700 ROAD DEVELOPMENT... 94
7. AREAS OF OPPORTUNITY... 95
8. NATIONAL AND PROVINCIAL ALIGNMENT... 97
E. SECTOR INVOLVEMENT... 98
1. DEPARTMENT OF LAND AFFAIRS... 98
2. DEPARTMENT OF MINERAL AND ENERGY AFFAIRS... 99
3. DEPARTMENT OF TRANSPORT... 100
F. IMPLEMENTATION PLAN... 104
G. PROJECTS....... 106
H. FINANCIAL PLAN AND SDBIP... 109
I. ORGANISATIONAL PERFORMANCE MANAGEMENT SYSTEM... 113
1. KEY PERFORMANCE AREAS... 113
2. BASIC PRINCIPLES OF ZULULAND DISTRICT MUNICIPALITY PERFORMANCE MANAGEMENT SYSTEM... 114
3. MUNICIPAL INSTITUTIONAL ARRANGEMENTS... 114
4. THE ZDM PERFORMANCE FRAMEWORK... 114
5. KEY PERFORMANCE INDICATORS...ERROR! BOOKMARK NOT DEFINED. J. ANNEXURES... 127
K. APPENDICIES... 127
5
A. EXECUTIVE SUMMARY
1. INTRODUCTION
The second IDP was prepared for the Zululand District Municipality for the period 2007/2008 – 2011/2012. IDPs are prepared according to Chapter 5 and Section 25 (1) of the Municipal Systems Act (2000), which indicates that:
“Each municipal council must, within a prescribed period after the start of its elected term, adopt a single, all inclusive and strategic plan for the development of the municipality which-
i. Links integrates and coordinates plans and takes into account proposals for the development of the municipality;
ii. Aligns the resources and capacity of the municipality with the implementation of the plan;
iii. Complies with the provisions of this Chapter; and
iv. Is compatible with national and provincial development plans and planning requirements binding on the municipality in terms of legislation.”
The annual review of the IDP is a legislative requirement in terms of Section 34 of the Municipal Systems Act No.32 of 2000. It stipulates that the “municipal council must review its integrated plan annually in accordance with an assessment of its performance measurements in terms of Section 41; and to the extent that changing circumstances so demand; and may amend its integrated development plan in accordance with a prescribed process.”
This report presents the first review (2008/09) of the second IDP prepared for the Zululand District Municipality for the period 2007/2008 – 2012/2013. The document is structured as follows:
Section A provides an Executive Summary with an overview of the district, the participatory mechanisms and the process and key timeframes for the review.
Section B provides the Situation Analysis.
Section C provides details on the Development Strategies for the Zululand District Municipality.
Section D provides a high level Spatial Development Framework.
Section E provides inputs received from the respective sector departments.
Section F details the Three Year Implementation Plan.
6
Section G details the One Year Detailed Operation Plan and SDBIP.
Section H provides a Municipal Budget Overview and 3 Year Financial Plan.
Section I provides details on the Organisational Performance Management System.
Section J provides details on a number of Annexures and Appendices.
2. OVERVIEW OF THE DISTRICT
The Zululand District is located on the northern regions of the KwaZulu-Natal Province and it covers an area of approximately 14 810 km². Approximately half of the area is under the jurisdiction of traditional authorities while the remainder is divided between commercially-owned farms and conservation areas. The District comprises the following five local municipalities:
o eDumbe (KZ 261) o uPhongolo (KZ 262) o Abaqulusi (KZ 263) o Nongoma (KZ 265)
o Ulundi (KZ 266) The determination of household numbers with the Zululand District Municipality area has been developed over a number of years.
Different methodologies have been used and these have been refined to provide the figures upon which the
municipality bases most of the planning decisions. The initial household determination was done using aerial photography and digitised households from the 1996 MegaSub house count. ESKOM produced a set of images in 2001 that was used to update the 1996 data. A new set of photography was acquired by the ZDM during 2007 and this data has been used to update the information captured from the 2001 photography. The following provides a summary of the latest household related data for the Zululand District Municipality based on the acquired 2007 data:
o Households 142 541
o People per Household 6.763 o Estimated Population 964 005 o % Urban Households 25.4%
o % Rural Households 74.6%
The two main towns in the Zululand District are Vryheid and Ulundi. eMondlo is another significant urban area. It is primarily a residential area with limited
7 services and facilities and few employment opportunities. Pongola and Paulpietersburg are small towns, which act as service centres, while Nongoma fulfils the same role, but with far fewer and lower order services.
The District is well endowed with natural water resources, notably:
o Pongola River in the North, o Mhlathuze in the South,
o Black Mfolozi, White Mfolozi, and the Mkhuze rivers in the central areas.
There are a number of areas (totaling about 95 000 Ha) of conservation value and sensitivity, i.e.
o Ithala Game Reserve o Ngome State Forest
o Pongolapoort Nature Reserve o Klipfontein Nature Reserve o Vryheid Nature Reserve
o Pongola Bush Nature Reserve o Emakhosini Ophathe Heritage Park
A number of environmental linkages throughout the District have also been identified, mainly related to the river systems, the Paris dam, Ithala Game Reserve, Pongolapoort Biosphere Reserve as well as the eMakhosini/ Ophathe Hluhluwe-Umfolozi Park cross border linkage.
3. INFRASTRUCTURE AND THE ECONOMY
3.1 INFRASTRUCTURE
The Zululand District Water Services Plan gives a clear indication as to where and when water infrastructure will be provided in the District. There are two main programmes that are utilized for the implementation of water and sanitation services. The Department of Water Affairs and Forestry provides funding for specifically water and sanitation infrastructure development. The Municipal Infrastructural Grant funds various infrastructure projects, not only limited to water and sanitation, but will exclusively be utilized by the ZDM for water and sanitation infrastructure provision during the next 5 years.
There are 10 regional water schemes that have been developed to roll-out water supply to the whole district as shown hereunder. The schemes are listed hereunder and shown on the map at overleaf:
o Coronation o Hlahlindlela o Khambi o Mandlakazi
o Simdlangentsha East o Simdlangentsha Central o Simdlangentsha West o Usuthu
8
o Nkonjeni o Candover
The review of the district WSDP is underway and information pertaining to the following is provided:
o Rudimentary water supply roll-out. Rudimentary water supply provides 5l per capita per day within a distance of 800m.
o RDP water supply roll-out. Provides for 25l per capita per day within a distance of 200m.
o Rural Sanitation to the RDP standard of 1 VIP per household.
Rudimentary Water Supply
The roll-out of the rudimentary water supply is provided on the image attached at overleaf and the table on the page thereafter:
9
10
MIG 2008/09
Number of settlements
Number of
HH MIG 2009/10
Number of settlements
Number of
HH MIG 2010/11
Number of settlements
Number of HH
Rudimentary Water supply R 20,000,000 70 7190 R 20,000,000 60 7892 R 20,000,000 45 4772
Rudimentary Scheme South R 13,000,000 53 6604 R 13,000,000 50 7311 R 13,000,000 27 3729
Nkonjeni R 2,929,977 14 2518 R 4,677,534 21 4102 R 4,957,227 12 2862
Usuthu R 7,457,588 33 2978 R 4,681,056 18 1799 R 4,664,275 13 663
Mandlakhazi R 9,612,435 6 1108 R 3,641,410 11 1410 R 3,378,498 2 204
Rudimentary Scheme North R 7,000,000 17 586 R 7,000,000 10 581 R 7,000,000 18 1043
Mkhuze R 1,166,667 5 11 R 134,143 0 0 R 134,143 0 0
Simdl East R 897,436 0 0 R 1,072,647 0 0 R 1,072,647 0 0
Simdl Central R 897,436 4 293 R 460,035 2 354 R 460,035 1 298
Simdl West R 897,436 5 112 R 645,111 3 48 R 645,111 3 51
Khambi R 897,436 1 103 R 1,477,420 1 140 R 1,477,420 5 382
Coronation (Enyathi) R 897,436 2 67 R 1,039,134 4 39 R 1,039,134 9 312
eMondlo R 1,346,154 0 0 R 2,171,508 0 0 R 2,171,508 0 0
RDP Water Supply
RDP water supply roll-out shown in the following table and in image at overleaf.
Total for 2008/09
Number of
settlements Number of HH Total for 2009/10
Number of
settlements Number of HH Total for 2010/11
Number of
settlements Number of HH
Regional Water Supply R 151,769,000 85 5638 R 94,174,130 33 2109 R 105,303,090 46 3068
Regional Water Supply South R 112,769,000 82 5210 R 64,780,539 27 1626 R 71,108,816 44 2796
Nkonjeni R 16,520,530 26 2494 R 23,308,704 27 1626 R 27,115,579 15 826
Usuthu R 42,049,236 36 2027 R 23,326,257 0 0 R 25,513,161 11 743
Mandlakhazi R 54,199,234 20 689 R 18,145,578 0 0 R 18,480,077 18 1227
Regional Water Supply North R 39,000,000 3 428 R 29,393,591 6 483 R 34,194,274 2 272
Mkhuze R 6,500,000 1 285 R 563,280 0 0 R 655,277 0 0
Simdl East R 5,000,000 0 0 R 4,504,136 0 0 R 5,239,771 0 0
Simdl Central R 5,000,000 0 0 R 1,931,726 0 0 R 2,247,224 0 0
Simdl West R 5,000,000 2 143 R 2,708,876 0 0 R 3,151,301 0 0
Khambi R 5,000,000 0 0 R 6,203,813 6 483 R 7,217,045 2 272
Coronation (Enyathi) R 5,000,000 0 0 R 4,363,413 0 0 R 5,076,063 0 0
eMondlo R 7,500,000 0 0 R 9,118,347 0 0 R 10,607,593 0 0
11
12 With regard the roll-out of sanitation services, details are provided in the table hereunder and the actual roll-out for 2008, 2009 and 2020 is shown on the image attached at overleaf.
Regional Area
Backlog For Catchup
Programme 2008/09 2009/10 2010/11
Households Budget Units Budget Units Budget Units
Sanitation South R 13,000,000 R 20,095,530 R 22,728,290
Pre Cast Manufacturing Plant R 4,000,000
Nkonjeni 8100 R 3,765,885 753 R 8,408,605.90 1,682 R 9,510,236.03 1,902
Usuthu 6802 R 3,162,413 632 R 7,061,152.76 1,412 R 7,986,250.06 1,597
Mandlakhazi 4456 R 2,071,702 414 R 4,625,771.34 925 R 5,231,803.92 1,046
Sanitation North R 7,000,000 R 10,820,670.00 R 12,238,310.00
Pre Cast Manufacturing Plant R 4,000,000
Mkhuze 10 R 1,430 0 R 5,157.86 1 R 5,833.60 1
Simdl East 2960 R 423,280 85 R 1,526,725.93 305 R 1,726,745.68 345
Simdl Central 1047 R 149,721 30 R 540,027.72 108 R 610,777.95 122
Simdl West 109 R 15,587 3 R 56,220.65 11 R 63,586.24 13
Khambi 1516 R 216,788 43 R 781,931.25 156 R 884,373.80 177
Coronation (Enyathi) 326 R 46,618 9 R 168,146.17 34 R 190,175.37 38
eMondlo 15011 R 2,146,575 429 R 7,742,460.43 1,548 R 8,756,817.36 1,751
40337 2,400 6,183 6,993
It is important to note that not all households stand to benefit in the short term with the provision of a VIP unit. From the table above it can be seen that less units than the actual backlog are reflected.
13
14 In the Zululand District Municipality electricity is provided by way of connections to the Eskom grid or by way of non-grid electricity. It is important to note that the electricity network in the southern portions of Zululand has very limited capacity and, as such, no new projects are being commissioned in this part of the District. Rather, the priority of Eskom is to construct a sub-station at Nyokeni. In the northern portions of the district, notably Edumbe, Ulundi and Abaqulusi, a few projects are proposed.
The calculated backlog for the provision of electricity, in terms of planned grid and non-grid supply is as follow:
o 55237 still to be connected to grid supply – this equates to approximately 39% of the total households
o 13175 still to be connected to non-grid supply – this equate to approximately 9% of the total households
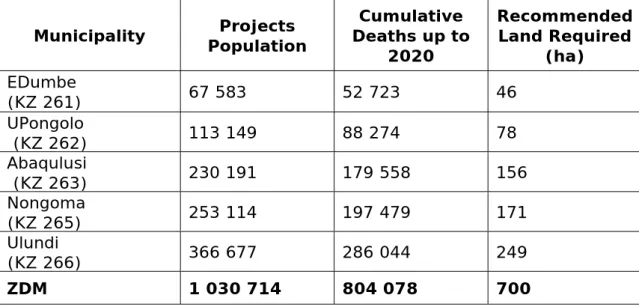
Burial arrangements are closely bound with cultural and religious traditions. In most cases burial sites are needed in relatively close proximity to settlements.
Accordingly to the Zululand Cemeteries Master Plan, approximately 700 ha of land will be required in the Zululand District Municipality by the year 2020 to accommodate approximately 800 000 cumulative deaths at that time.
There are a number of roads that are of strategic importance to the Municipality listed hereunder:
o Nongoma uPhongola link road: A section of this road between Nongoma and uPhongola (about 35km) need to be upgraded to blacktop
o Nongoma Vryheid link road: There is a portion of road between Nongoma and Vryheid, from Nongoma to Vryheid that need to be upgraded to blacktop standard.
o Ceza R66 road: A section of the road need to be upgraded to blacktop
o Nongoma/Mkuze road: A section of the road needs to be upgraded to blacktop standard
o Nongoma Ulundi Road: The portion of road between the two towns is tarred, but certain sections of the road need to be upgraded and refurbished As part of the Review of the ZMD IDP for 2008/2009 an in-depth analysis of backlogs was undertaken. The results of this analysis are contained in the main report.
3.2 THE DISTRICT ECONOMY
The Zululand District is isolated from the national economy mainly due to its location in relation to transport routes and distance from major centres. Further to this, access to basic factors of production such as raw materials, skilled labour and infrastructure is generally limited. The raw materials that are found in the
15 District mainly relate to coal mining and agricultural activities such as maize beef, timber and sugar production. The five municipal centres, or key towns, are the focus of the economic activity in each of the local municipalities.
Unfortunately the surrounding traditional areas are poverty stricken and depend upon the little economic output that is generated in these towns.
Despite this negative backdrop against which the Zululand economy has to perform, there are unique characteristics that present a range of economic development opportunities in the District. These are in relation to tourism, agriculture and the business sector.
4. KEY DEVELOPMENT ISSUES
On the 16th and 17th of October 2007, the Zululand District successfully hosted its second Growth and Development Summit. The Summit programme culminated in the preparation of an Action Plan based on the identification and discussion of key development issues. These critical district key issues are outlined hereunder:
1. Urgency to complete the P700
2. Spatial Alignment of Housing Plans with Strategic Perspective 3. Water and Sanitation to Schools and Clinics
4. Need for Spatial Alignment between the District, its Local Municipalities as well as the various sector departments
5. The need to be proactive in aligning the SDF (Spatial Development Framework) with the Area Based Plans of the Department of Land Affairs
6. Need for bulk services
7. Deteriorating urban infrastructure
8. Potential delays in issuing of RODs that could delay development in the identified nodes
9. Readyness to access funding 10.Project Management Capacity 11.Unemployment
12.Implementation in Nodes
13.Participation of stakeholders forums in development 14.Priorities of LED Plans
15.Implementation of Pongolapoort dam strategy 16.Formalization of the Gumbi Community
17.Maximizing opportunities at Prince Mangosutho Buthelezi Airport 18.Align outstanding actions from 2006 Growth and Development Plan
to focus areas
19.Participation of stakeholders
20.Support from the Traditional Authorities 21.Environmental and Heritage Protection
16
5. VISON AND STRATEGIC FOCUS AREAS
The ZDM Council adopted the following long-term development vision.
“We, the people of Zululand are proud communities that are committed to the development of Zululand through hard work,
integrity and a common purpose.”
MISSION
To create an affluent district by:-
o Provision of optimal delivery of essential services.
o Supporting sustainable local economic development.
o Community participation in service delivery.
Core Values
o Transparency o Commitment o Innovation o Integrity o Co-operation
The above vision strategic focus areas of the Zululand District Municipality are:
o To facilitate the delivery of sustainable infrastructure and services o To promote economic development
o To promote social development
These focus areas are broken down to objectives and strategies, which is used to set KPI’s for the measurement of the Municipality’s performance, and progress with its service delivery mandate. It is important to note that the national KPAs as set that relate to community participation, good governance, municipal transformation and financial viability are considered as of a cross-cutting nature and therefore form an integral part of each of the three listed strategic focus areas.
Details on the ZDM 5 Year Strategic Plan as well as the listed Key Performance Areas (KPAs) and the Strategic Focus Areas and Objectives.
5.1 5 YEAR STRATEGIC PLAN
The Zululand District Municipality has a 5 Year Strategic Plan. The content of this plan is provided on the following pages:
17
Zululand District Municipality As for 2008/09 5 Yr Strategic Plan 2006/07 -10/11
Grey = 08/09 Prior
W hat How W hat must happen
SFA No
Strategic Focus Area
Focus Area Obj No
Objective Strategy Action No Action
Resp 1.1 Service
Delivery
Water & Sanitation 1.1.1 To progressively provide a cost effective, reliable water services at a good quality to all potential consumers in the district
Regularly review Development Plan for the delivery of Water Services
Annual review of WSDP
PCD
Regulation of Water Services Regularly review Water Services Policy, including: Free Basic Services, Tariff, Credit Control, Quality, Metering & Customer Care
PCD/FS
Regularly review Water Services
Bylaws PCD
Effective and efficient delivery of Water Services
Improve/sustain Institutional &
Financial Capacity to Construct, Operate & Maintain Water Services TS Monitor Water Services provision by WSP structures against set KPI's
PCD 1.2 Municipal Airports 1.2.1 To viably establish,
operate & maintain a Regional Airport that contributes to the growth &
development of the district
Financial viability of airport is investigated and a plan established to attempt constant improvement and to maximise the potential contribution to the growth & development of the District
Establish, implement and monitor a Plan for the Development of the Ulundi Regional Airport
PCD
1.3 Municipal Roads 1.3.1 Define DM's role in the provision of District Roads
Maintain Status Quo, until DM role defined
Role of DM periodically reviewed and appropriate steps taken to fulfill role
PCD
1.4 Regulation Of
Passenger Transport Services
1.4.1 To plan for Public Transport Services
Establish a Public Transport Plan (PTP) for the provision of Public Transport Services
Progressively develop and regularly review the PTP where
applicable PCD
1.4.2 Define DM's role in the Regulation of Passenger Transport Services
Maintain Status Quo, until DM role defined
Role of DM ito Regulation periodically reviewed and appropriate steps taken to fulfill role
PCD 1.5 Fire Fighting 1.5.1 To Plan, co-ordinate,
regulate Fire Fighting Services in the district and the co-ordination of standarisation of infrastr, vehicles & procedures
Establish a Plan for the co- ordination and delivery of Fire Fighting Services and the co- ordination of standardisation of vehicles and equipment
Develop and regularly review the Fire Services Plan and monitor the implementation thereof
CS
Regulation of Fire Fighting Services
Develop and regularly review Fire Services Policy & Bylaws CS
1.6 Disaster
Management
1.6.1 To deal with Disasters efficiently & effectively in the district
Regularly review Development Plan for Disaster Management
Annual review of Disaster
Management Plan CS
Develop & regularly review
Disaster Management Bylaws CS 1.7 Solid Waste 1.7.1 To provide a strategy for
solid waste sites
Regularly review Integrated Waste Management Plan
Establish and regularly review of Integrated Waste Management Plan
PCD 1.7.2 To effectively regulate the
provision of solid waste services
To regulatethe disposal of solid waste in the district
Regularly review Solid Waste
Bylaws PCD
1.8 Municipal Health
Services
1.8.1 To deliver an effective municipal health service
Plan for effective Municipal Health Services
Develop and regularly review a
Municipal Health Plan PCD
To regulate Municipal Health Develop & regularly review
Municipal Health Bylaws PCD
1.9 Regional Fresh
Produce Markets &
Abattoirs
1.9.1 To maximise regional efficiency in the delivery of Regional Fresh produce Markets & Abattoirs
The need for Fresh Produce Markets and Abattoirs is investigated and strategies established to maximise the potential benefit to the District
Develop and regularly review a Plan on Regional Fresh Produce
Markets and Abattoirs PCD
1.10 District Cemeteries 1.10.1 To maximise regional efficiency in the delivery of Cemeteries
The need for Regional Cemeteries is investigated and strategies established to maximise the potential benefit to the District
Develop and regularly review a Strategy on Regional Cemeteries
PCD
1.11 District Tourism 1.11.1 To promote tourism in the District
To plan and co-ordinate tourism the district
Regularly review of Tourism Plan PCD 2.1 Economic
Development
LED 2.1.1 To improve the economy
of the district, through the creation of job opportunities and additional economic activities
To plan for LED Regularly review of LED Plan
(including: Tourism, Business &
Agriculture)
PCD
3.1 Social Development
HIV/AIDS 3.1.1 To reduce the occurrence and impact of HIV/AIDS
To introduce steps to reduce the occurrence and impact of HIV/AIDS on communities
Regularly review HIV/AIDS
Strategy CS
18
3.2 Youth And Gender 3.2.1 To develop and empower Youth & Gender
To plan for the development and empowerment of Youth &
Gender
Regularly review Youth, Gender, Aged and Orphans Development Plan
CS
3.3 Community
Development
3.3.1 The social upliftment of the communities in ZDM
To establish and review Social Upliftment Programmes
Regularly review Social Upliftment
programme CS
4.1 Institutional Development
Employment Equity 4.1.1 To transform the organisation
To assess and review race, gender & disability equity imbalance
Regularly review Employment
Equity plan CS
4.2 Skills development
& capacity building
4.2.1 To develop capacity in the organisation for effective service delivery
To assess & review skills development needs & address the gaps
Annually review Skills
Development Plan CS
To provide social support to employees
Regularly review Employee
Assistance Policy CS
5.1 Financial Management
Sound Financial Management
5.1.1 To continually promote good financial practices
To establish and review internal procedures & controls
Develop and annually review
policies and financial plan CFO To ensure regular audits are
conducted
Annually review Audit Plan
CFO 5.1.2 To be a Financial Viable
Municipality
To improve on financial indicators
Monitor Financial Viability Indicators regularly and take appropriate steps
CFO 6.1 Good
Governance and Public Participation
Compliance, Clean and Sound Administration
6.1.1 To promote good governance, accountability
& transparency
To consider and approve new and reviewed policies and bylaws
Regularly review Policies & Bylaws ALL To ensure compliance with
legislation, regulations, policies
& bylaws
Develop and monitor a compliance
check list ALL
To ensure an effective Performance Management System is in place
Implement Performance
Management System PCD
To continuously encourage participation of residents and stakeholders in ZDM Activities
Convene Budget & IDP Representative forums & Road shows
PCD/FS Establish Project Steering
Committees & Vocational Forums TS To effectively communicate with
internal & external stakeholders
Regularly review Communication
Plan CS
To promote Customer focused administration
Develop a Customer Care Strategy CS 6.1.2 To operate the organisation
at a minimun risk level
To continuously identify and manage risk
Establish and annually review Risk
Mangement Plan FS
6.2 Integrated & Co- ordinated Development
6.2.1 To continuously promote integrated & co-ordinated development within the District
The IDP guides all development in the District
The IDP is drafted, reviewed annually and based on community needs & participation PCD
5.2 STRATEGIC FOCUS AREAS AND OBJECTIVES Strategic Focus Area Service Delivery
Water and Sanitation Focus Area
Objective:
To progressively provide a cost effective, reliable water services at a good quality to all potential consumers in the District
Disaster Management Focus Area
Objective:
To deal with disaster efficiently and effectively in the District
District Tourism Focus Area
Objective:
To promote tourism in the District
19 Strategic Focus Area Social Development
HIV/Aids Focus Area
Objective:
To reduce the occurrence and impact of HIV/Aids Youth and Gender
Focus Area
Objective:
To promote youth and gender participation in Council
Community Development Focus Area
Objective:
To reduce poverty
Strategic Focus Area Institutional Development Employment Equity Focus Area
Objective:
To transform the organization Strategic Focus Area Financial Management
Sound Financial Management Focus Area
Objective:
To be a Financial Viable Municipality
Strategic Focus Area Good Governance and Public Participation
Compliance, Clean and Sound Administration Focus Area
Objective:
To promote good governance, accountability and transparency
Integrated and Coordinated Development Focus Area
Objective:
To promote integrated and coordinated development within the District
20
6. ZDM FUNDED PROJECTS
07/08 08/09 09/10 10/11
Budgeted Budgeted Budgeted Budgeted DESCRIPTION Total Budget Total Budget Total Budget Total Budget CAPACITY BUILDING (allocation per ward) 1,000,000 1,000,000 1,000,000 1,000,000
Abaqulusi 350,000 350,000 350,000 350,000
Edumbe 550,000 550,000 550,000 550,000
uPhongolo 950,000 950,000 950,000 950,000
Nongoma 1,200,000 1,200,000 1,200,000 1,200,000
Ulundi 4,050,000 4,050,000 4,050,000 4,050,000
CAPITAL EX MIG
Simdlangentsha Central Water Supply Ph 2 10,988,152 6,000,000 6,000,000 6,000,000 Mandlakazi RWSS Phase 2C 5,937,043 20,000,000 20,000,000 20,000,000 Coronation RWSS - Enyathi 3,053,628 5,000,000 5,000,000 5,000,000
Usuthu RWSS Phase 4 11,102,302 23,000,000 23,000,000 23,000,000
Hlobane Sport 666,088 0 0 0
Mona Sport 1,695,690 0 0 0
Hlahlindlela/Emondlo 12,410,672 10,000,000 10,000,000 10,000,000
Khambi 12,414,411 6,000,000 6,000,000 6,000,000
Simdlangentsha West Ph2.1 18,718,028 3,000,000 3,000,000 3,000,000
Santation Feasibility 1,000,000 0 0 0
Nkonjeni Ph 1NKONJENI PH. 1 10,790,105 22,000,000 22,000,000 22,000,000
Nkonjeni Project 200,000 0 0 0
Ulundi Unit M 5,400,000 0 0 0
Upgrade of Ulundi Sports Complex 4,100,000 5,000,000 5,000,000 5,000,000
Rural Sanitation 1,503,881 15,000,000 15,000,000 15,000,000
Rudimentary Water Supply Phase 2 10,000,000 15,324,000 15,324,000 15,324,000
MIG Unallocated 0 0 0 0
ZDM Clinic Sanitation 0 0 0 0
Enkembeni 0 0 0 0
109,980,000 130,324,000 130,324,000 130,324,000 CAPITAL EX MIG (DWAF)
Usuthu S 26,077,000 41,227,000 1,900,000 4,500,000
Mandlakazi Phaes 1B 28,990,000 44,140,000 1,900,000 4,500,000
School and Clinic Sanitation 0 4,551,000 5,918,000 0
55,067,000 89,918,000 9,718,000 9,000,000
21
7. PARTICIPATION AND ALIGNMENT
The following organization arrangements are in place for the review of the ZDM IDP (2008/09):
o IDP Steering Committee was resolved by the Council to act as a support to the ZDM Municipal Forums, the Municipal Manager and the IDP Manager.
o The IDP Manager is an official of the municipality assigned the responsibility of championing the IDP process.
o The ZDM Representative Forum is the participation forum that have to recommend the IDP for adoption to the Zululand District Municipality Council.
o IDP Planners Forum is a technical forum that supports the IDP Steering Committee and consists of planners and IDP experts from within the District. The coordination of alignment of interaction with sector Departments and Local Municipalities
o The LED Forum is a technical forum consisting of three sub-forums namely agriculture, business and tourism. The LED forums reports and give input to the IDP Steering committee. These sub-forums are used as a platform for interaction with the private sector.
The following internal and external role players are part of the IDP Review process:
o Internal Role players
o Council and Executive Committee o Nominated Councilors
o Mayor
o Municipal Officials o Municipal Manager o IDP Manager
o IDP Steering Committee o External Role Players
o Sector Departments o Community structures
22 The diagram hereunder indicated the involvement of all the role-players in the IDP process:
It should also be noted that the IDP and its implementation for the ZDM will start focusing on international alignment with the district international neighbour, i.e. Swaziland. At the district alignment level, worksessions have been held with neighbouring district while an Intermunicipal Forum (IMUF) is currently being established as part of the Pongolapoort Dam Development Initiative.
Some of the tools used for communicating the IDP include:
o Road shows during the IDP comment phase
o Advertisements in local and provincial newspapers as required o Local Service Providers/Stakeholders Alignment meetings
The IDP was completed by the Zululand District municipality, with the involvement of all internal departments, under guidance of the Municipal manager. The following key dates in the approval process are noted:
o 27 March 2008 – Council approved draft IDP
o 21 April 2008 – 9 May 2008 – IDP is advertised for public comment o 22 May 208 – IDP presented to Representative Forum
o 29 May 2008 – final approval of IDP by EXCO
23 Details of IDP Roadshows:
o 8 April 2008 – Ulundi Municipality – Ulundi Regional Stadium o 9 April 2008 – Nongoma Municipality – KwaLindizwe Stadium o 10 April 2008 – uPhongolo Municipality – eNcotshane Stadium o 11 April 2008 – eDumbe Municipality – Bilanyoni Stadium o 12 April 2008 – AbaQulusi Municipality – Cecil Emmet Stadium
13
B. SITUATIONAL ANALYSIS
1. DETERMINATION OF DELIVERY BACKLOGS
Some components of this situational analysis have a detailed determination of delivery backlogs included as well. As such, a brief explanation is provided hereunder on the determination of delivery backlogs.
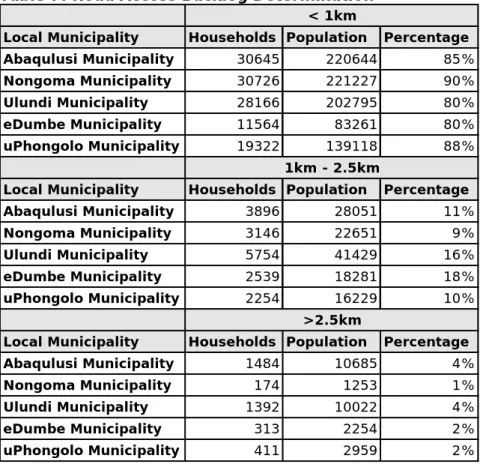
The basic premise around service delivery and backlogs is based upon of a minimum level of service determination, whereby a distance is determined from a household to a facility. In situations where households are outside the minimum distance to meet delivery standards, they are considered under serviced and part of the delivery backlog. Further analysis is also to be done on the capacity of the facility to provide for the population in its service area.
A number of alternative ways exist to determined backlogs. For the purpose of this report, the more accurate method of determining access to facilities using the existing road network has been applied. This is a better method due to the following reasons:
o It excludes any topographical error, as all road access will not be affected by rivers and mountains/hills.
o It provides a true distance to the facility as people will usually travel by road.
o It enables planners to determine an accurate indication of all households using a facility.
o
The method for the road access approach follows the process detailed below.
1. Associate all facilities with a road segment, and determine the distance from the facility to the road segment.
2. Associate all households with a road segment and determine the distance from the household to the road segment.
3. For each household, determine a route (by road) from that household to each facility.
4. Determine the shortest route (by distance) and assign that distance and the associated facility to that household.
14
2. ZULULAND REGIONAL CONTEXT
The Zululand District is located on the northern regions of the KwaZulu-Natal Province and it covers an area of approximately 14 810 km². Approximately half of the area in the Zululand District is under the jurisdiction of traditional authorities while the remainder is divided between commercially-owned farms and conservation areas. The District comprises the following six local municipalities as listed hereunder:
o eDumbe (KZ 261) o uPhongolo (KZ 262) o Abaqulusi (KZ 263) o Nongoma (KZ 265)
o Ulundi (KZ 266)
The map at overleaf shows the district in its regional context. The following map sketches the topographical context of the Zululand District Municipality.
The two main towns in Zululand are Vryheid and Ulundi. Vryheid is the main commercial, industrial and business centre, with well-developed physical, social and institutional infrastructure. It is well located at the intersection of the major transport routes which traverse the region. Ulundi has a narrower economic base, relying heavily on the three spheres of government, commerce and informal trading. It is located on a secondary route within the District, but 19 kilometers from the main R34 route.
eMondlo is another significant urban area. It is primarily a residential area with limited services and facilities and few employment opportunities. Pongola and Paulpietersburg are small towns, which act as service centres, while Nongoma fulfils the same role, but with far fewer and lower order services.
The District has a lack of large economic investments to boost the local economy.
Up to the late 1990’s the District’s economy was dependant on heavy coal mining.
As a result of the open markets on coal mining (and agriculture) the economy of the area has declined.
The potential for economic growth in Zululand lies in tourism and agriculture. The former has started to play a larger role in the economy of the area, this by no means fills the gap caused by the closure of mines. The mines had significant forward and backward linkages on all the economic sectors, particularly in Vryheid and surrounding areas.
15
16
17 The high agricultural potential of the land is key to the future development of the region and should be protected for long term sustainability; this however does not mean that it should be excluded from consideration in projects that relate to land reform and commercial farming ventures. The high population numbers and livestock concentrations in the freehold settlements highlight the need for additional land, and create possible opportunities for the development of commonage schemes. In addition tenure upgrade projects could be considered for tenants presently living on portions of the freehold land.
A large percentage of the district is communal land. Within these areas there is considerable pressure to extend grazing rights into adjoining areas.
Strategies to deal with the need to accommodate the increasing demands for grazing land need particular attention. This will require extensive consultation between all key role players in the region.
3. DEMOGRAPHIC CHARACTERISTICS
A few key statistics are summarised hereunder:
INDICATOR ZULULAND
Area 14 810 km²
Population (2007) 964 005 people
Households 142 541
People per Household 6,763
% Urban Households 25,4%
% Rural Households 74,6%
Gender breakdown Males 46,5 % Females 53,5 % Age breakdown 0 – 14 38,9%
15 – 64 56,9%
65 + 4,2%
Data derived from 2001 Census and 2007 Aerial Photography
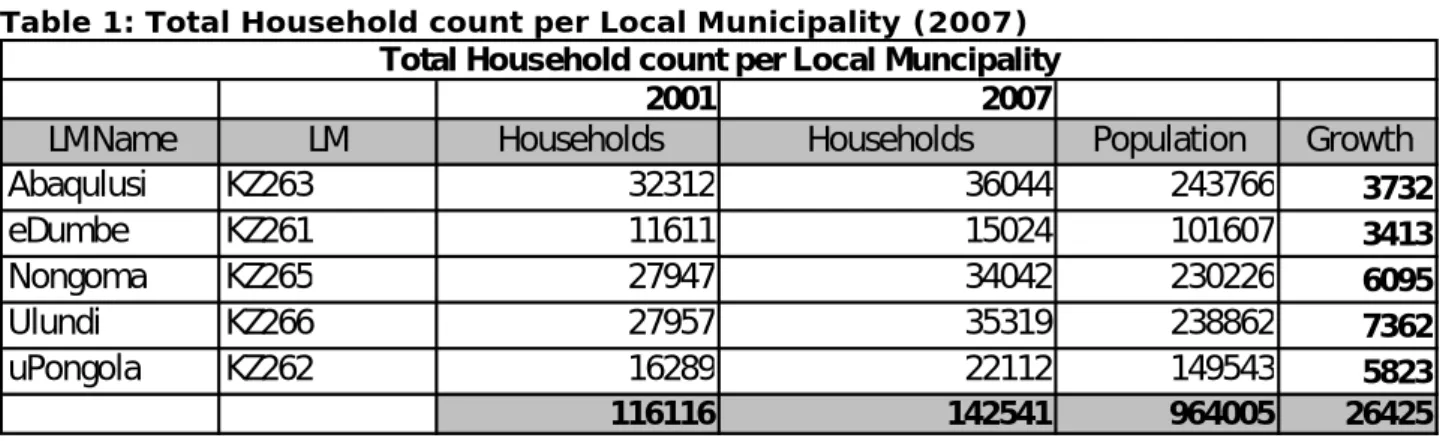
18 The following table shows the change in the household counts for the ZDM and its Local Municipalities between 2001 and 2007.
Table 1: Total Household count per Local Municipality (2007)
2001 2007
LMName LM Households Households Population Growth
Abaqulusi KZ263 32312 36044 243766 3732
eDumbe KZ261 11611 15024 101607 3413
Nongoma KZ265 27947 34042 230226 6095
Ulundi KZ266 27957 35319 238862 7362
uPongola KZ262 16289 22112 149543 5823
116116 142541 964005 26425 Total Household count per Local Muncipality
Data derived from 2001 Census and 2007 Aerial Photography
From the above the following is noted:
o The Ulundi LM had the highest percentage increase in household numbers, i.e. 28%. The second highest increase in household numbers was observed in Nongoma (23%) followed by uPongola (22%).
o The Abaqulusi LM has the most households in the district, i.e. 36044 the Ulundi LM the second most households, i.e. 35319.
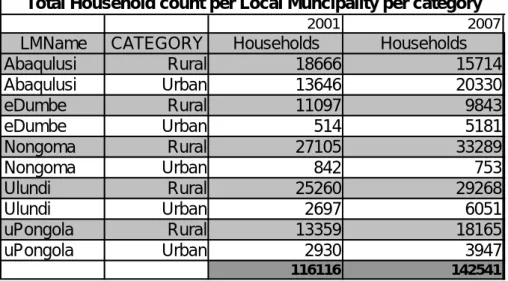
A further breakdown is provided in respect of the rural and urban components of the LM populations as shown in the table hereunder:
Table 2: Household count per Local Municipality per category
2001 2007
LMName CATEGORY Households Households
Abaqulusi Rural 18666 15714
Abaqulusi Urban 13646 20330
eDumbe Rural 11097 9843
eDumbe Urban 514 5181
Nongoma Rural 27105 33289
Nongoma Urban 842 753
Ulundi Rural 25260 29268
Ulundi Urban 2697 6051
uPongola Rural 13359 18165
uPongola Urban 2930 3947
116116 142541
Total Household count per Local Muncipality per category
Data derived from 2001 Census and 2007 Aerial Photography
19 The following two graphs show urban and rural percentage household growth per LM in the district between 2001 and 2007.
Figure 1: % Urban Household Growth per Local Municipality
-200%
0%
200%
400%
600%
800%
1000%
Abaqulusi Urban eDumbeUrban NongomaUrban Ulundi Urban uPongolaUrban
% Urban Growth 2001 - 2007
% Growth
Data derived from 2001 Census and 2007 Aerial Photography Figure 2: % Rural Household Growth per Local Municipality
-20%
-10%
0%
10%
20%
30%
40%
Abaqulusi Rural eDumbe Rural NongomaRural Ulundi Rural uPongolaRural
% Rural Growth 2001 - 2007
% Growth
Data derived from 2001 Census and 2007 Aerial Photography
The two figures shown above illustrate a tendency for a reduction in the rural population in Abaqulusi and eDumbe with significant growth in the urban areas. The other municipalities have all experienced rural growth with only Ulundi showing significant urban growth as well.
20 The following is further noted.
o In terms of geographic area, Abaqulusi is the largest (4184 km²), followed by Ulundi (3250 km²), uPongola (3239 km²), Nongoma (2184 km²) and eDumbe (1942 km²).
o Low levels of urbanization, approximately 75% of the people in the District are located in rural areas.
o A female population (54%) that is significantly higher than the male population (46%) which could be attributed to migration patterns in the province in general.
o The negative urban growth in Nongoma and the 100% positive urban growth in eDumbe can be attributed to the re-determination of urban boundaries
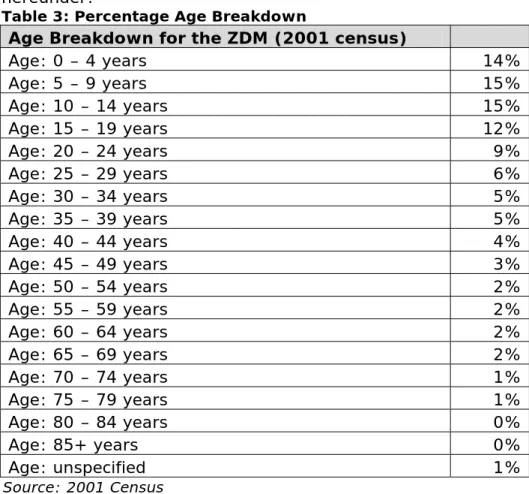
The age characteristics of the District’s population are shown in the table hereunder:
Table 3: Percentage Age Breakdown
Age Breakdown for the ZDM (2001 census)
Age: 0 – 4 years 14%
Age: 5 – 9 years 15%
Age: 10 – 14 years 15%
Age: 15 – 19 years 12%
Age: 20 – 24 years 9%
Age: 25 – 29 years 6%
Age: 30 – 34 years 5%
Age: 35 – 39 years 5%
Age: 40 – 44 years 4%
Age: 45 – 49 years 3%
Age: 50 – 54 years 2%
Age: 55 – 59 years 2%
Age: 60 – 64 years 2%
Age: 65 – 69 years 2%
Age: 70 – 74 years 1%
Age: 75 – 79 years 1%
Age: 80 – 84 years 0%
Age: 85+ years 0%
Age: unspecified 1%
Source: 2001 Census
21 The following table and figure provides a comparative breakdown of the annual household income in the Zululand District Municipality.
Table 4: Household Income Breakdown for the ZDM
Household Income Breakdown for the ZDM
Derived household income: none 21% 22709
Derived household income: R1 – R2 400 12% 12358
Derived household income: R2 401 – R6 000 22% 23222 Derived household income: R6 001 – R12 000 14% 15086 Derived household income: R12 001 – R18 000 7% 7618 Derived household income: R18 001 – R30 000 6% 6532 Derived household income: R30 001 – R42 000 3% 3186 Derived household income: R42 001 – R54 000 2% 2207 Derived household income: R54 001 – R72 000 2% 1941 Derived household income: R72 001 – R96 000 1% 1319 Derived household income: R96 001 – R132 000 1% 1005 Derived household income: R132 001 – R192 000 0% 520 Derived household income: R192 001 – R360 000 0% 304 Derived household income: R360 001 or more 0% 150 Derived household income: n/a: institution/hostel 0% 328 Derived household income: unspecified/dummy 8% 8547 Source: 2001 Census
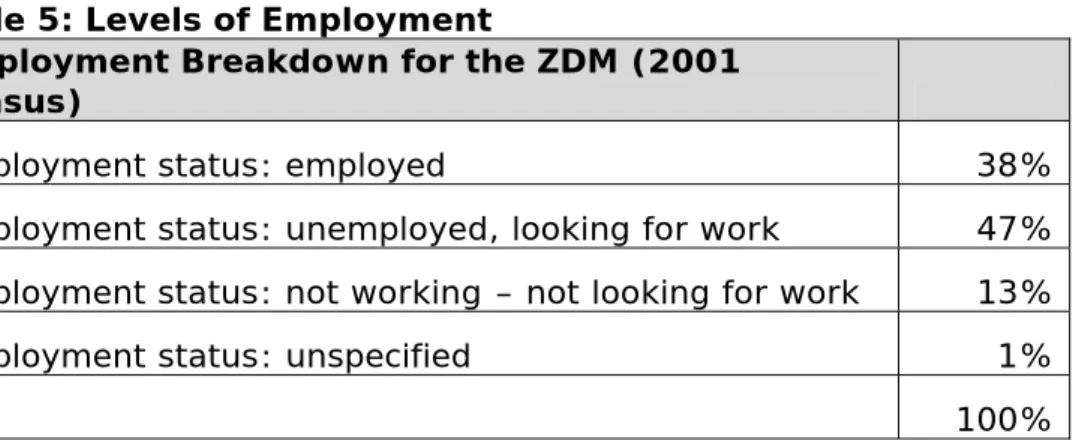
Employment levels are shown in the following table:
Table 5: Levels of Employment
Employment Breakdown for the ZDM (2001
census)
Employment status: employed 38%
Employment status: unemployed, looking for work 47%
Employment status: not working – not looking for work 13%
Employment status: unspecified 1%
100%
Source: Census 2001
At overleaf, a graph is attached that represent the education levels of the Zululand population. There is a correlation between income, employment and education levels as can be seen from the tables and graphs referred to.
22 Figure 3: Levels of Education
Zululand District: Level of Education
13%
23%
30%
6%
20%
6% 2% Not Applicable
No schooling Some primary Complete primary Some secondary Std 10/Grade 12 Higher
It is very important to consider the prevalence of HIV/Aids and the impact it has on the socio-economic conditions of the District. HIV/Aids will have a significant negative impact on the whole South African society, Zululand being no exception. The implications are as follows:
KwaZulu-Natal’s present share of the South African population is about 21%.
This is expected to remain constant over the next 20 years under a “low impact” HIV/AIDS scenario, according to the DBSA. However, KZN had the highest recorded HIV-positive rate in the country between 1997 and 1999, indicating that the impact is likely to be more severe than in the rest of South Africa, rather than less so. The Department of Health national statistics estimated KZN’s HIV prevalence rate at 32,5% in 1999. The KZN’s Office of the Premier reports that ‘the prevalence appears to be higher among women than among men. Women are infected considerably earlier than men. Among women, prevalence rises sharply from about 15 years, reaches a peak at 25-30 years then begins to taper off. Among men, it rises sharply from about 20 years then peaks from about 35-40. This suggests that older boys and men are infecting large numbers of young women and girls. There is also survey evidence that, for a significant percentage of youth, sexual activity commences at very young ages.’ In geographic terms, the highest prevalence rates in KZN were found in Pietermaritzburg (35%), Durban (34,8%), Jozini (32,7), Ulundi (32,3) and Ladysmith (31,8%).
With this in mind, the IDP for Zululand District Municipality needs to ensure that the issue of HIV/Aids is taken into consideration when doing financial and physical planning for the District.
23
4. THE NATURAL ENVIRONMENT
The Zululand District is well endowed with natural water resources, making it ironic that the most urgent human developmental need is the provision of potable water. The District has the following notable natural water sources:
o the Pongola River in the North, o the Mhlathuze in the South, o and the Black Mfolozi, o the White Mfolozi, and
o the Mkhuze rivers in the central areas.
These rivers are fed by many smaller rivers, streams and springs and it is from these that the rural communities obtain their water in a purified or unpurified form. There are three main catchments in the District namely:
o the Pongola in the North,
o the Mkhuze in the Central areas, and o the Mfolozi in the South.
At overleaf, the hydrology of the ZDM is mapped.
24
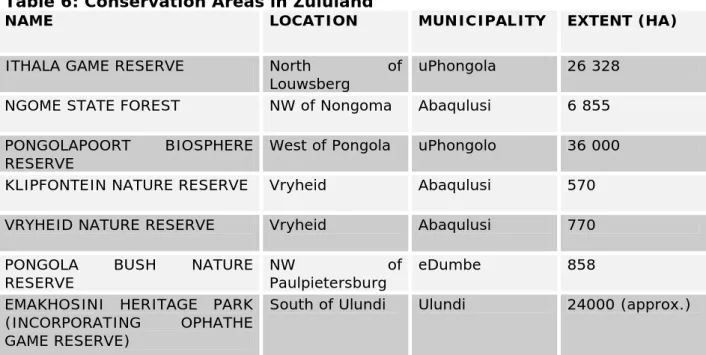
25 A number of efforts have been made to identify and conserve the areas of environmental value and sensitivity. The table at overleaf shows the main conservation areas in the Zululand District Municipality.
Table 6: Conservation Areas in Zululand
NAME LOCATION MUNICIPALITY EXTENT (HA)
ITHALA GAME RESERVE North of
Louwsberg uPhongola 26 328 NGOME STATE FOREST NW of Nongoma Abaqulusi 6 855 PONGOLAPOORT BIOSPHERE
RESERVE West of Pongola uPhongolo 36 000
KLIPFONTEIN NATURE RESERVE Vryheid Abaqulusi 570 VRYHEID NATURE RESERVE Vryheid Abaqulusi 770 PONGOLA BUSH NATURE
RESERVE NW of
Paulpietersburg eDumbe 858 EMAKHOSINI HERITAGE PARK
(INCORPORATING OPHATHE GAME RESERVE)
South of Ulundi Ulundi 24000 (approx.)
Source: Zululand Regional Development Plan, Situational Analysis, Table 7.12 with additions
The locality of the above conservation areas is shown in the environmental map attached at overleaf.
At a smaller scale, but of no less importance is the conservation of cultural and historical sites and landscapes. AMAFA is responsible for this function.
Most of its activities are focused in the Ulundi area and in eMakhosini, which is known as “the Valley of the Zulu Kings”.
As part of conservation and preservation of the natural environment, the District has identified environmental linkages throughout the whole District. These linkages relate mainly to the river systems. Efforts have been made to join conservation areas within Zululand with those in adjoining areas. The greatest opportunity involves the Paris dam, Ithala Game Reserve and the Pongolapoort Biosphere Reserve. Another potential cross- District linkage exists in the southeast, from eMakhosini/ Ophathe to the Hluhluwe-Umfolozi Park.
26
27 The ZDM has initiated a process to establish an Invasive Alien Species Task Team. The objective of the task team is to derive a coordinated strategy for the control and management of Invasive Alien Species in the Municipal area. This task team would then contribute to:
o A coordinated effort for control and management of invasive alien species within the ZDM
o Alignment of priorities o Sharing of best practices
o Monitoring the extent of Invasive Alien Species
The following roles and responsibilities have been noted for the task team:
o Coordination of an integrated approach to invasive alien species control within the Zululand District Municipal area.
o Collation of GIS data related to the extent of invasive alien species and progress made.
o Promotion of relationships between various role players.
o Promotion of awareness and education of invasive alien species.
The Task Team consists of the following key role players o Zululand District Municipality
o Department of Agriculture and Environmental Affairs: Invasive Alien Species Programme
o Department of Water Affairs and Forestry: Working for Water o National Department of Agriculture
o Ezemvelo KZN Wildlife
o Department of Environmental Affairs and Tourism o Local Municipalities
The following interested parties have also been noted o Department of Transport
o National Roads agency o Eskom
o Telkom o Spoornet o Mondi o Sappi
o Game Ranch Association o Amafa
o Department of Traditional and Local Government Affairs o Farmers Associations