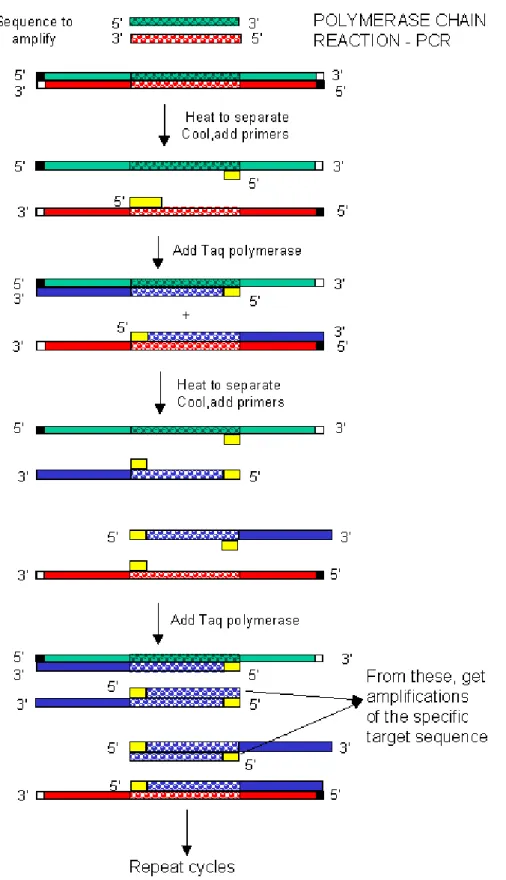
PAGE FIGURE 2.1 Schematic diagram of the PCR reaction. http://people.uwec.edu/piercech/tox/Techniques.htm).
GENERAL INTRODUCTION
Soil quality is essentially “the ability of the soil to function” and depends on a combination of physical, chemical and biological properties (Rahman et al., 2008). Microbial and biochemical traits can be used as indicators of soil quality due to their central role in the C and N cycle and their sensitivity to ecosystem changes (Nannipieri et al., 2003).
LITERATURE REVIEW
INTRODUCTION
This chapter examines the nature and significance of biodiversity as well as current information on the influence of land use and land management practices on soil microbial diversity. Emphasis is placed on the molecular and metabolic fingerprinting methods applied later in this study.
THE NATURE AND SIGNIFICANCE OF BIODIVERSITY
- Numbers and interrelationships
- Diversity of habitats
- Biodiversity and productivity
- Microbial diversity and soil function
- Indices of diversity
- Species richness
- Species evenness
- Species diversity
Little information is available regarding the contribution of microbial diversity to soil ecosystem functioning (Crecchio et al., 2004). As a result, no general relationship between microbial diversity and soil function has been found (Nannipieri et al., 2003).
FACTORS AFFECTING SOIL MICROBIAL DIVERSITY
- The rhizosphere
- Rhizosphere communities
- Effects of land use
- Arable agriculture
- Grassland
- Forests
- Spatial heterogeneity
- Soil depth
- Effects of soil pollution
- Heavy metals
- Hydrocarbons
- Pesticides
Changes in the soil environment due to agricultural land use or management practices directly influence soil microbial diversity and activity (Jangid et al., 2008). They showed that long-term fertilization regimes influenced the structure and diversity of microbial communities in agricultural soils.
TECHNIQUES FOR ESTIMATING SOIL MICROBIAL DIVERSITY
- Non-molecular techniques
- Plating and microscopy
- Fatty acid methyl ester (FAME) analysis
- Phospholipid fatty acid (PLFA) analysis
- Substrate utilization
- Molecular techniques
- DNA extraction and purification
- Polymerase chain reaction (PCR)
- PCR-independent techniques
Also, stripped DNA adsorbs to soil particles, leading to biased population profiles (Sessitsch et al., 2002). Genome size and copy number of rRNA (rrn) genes also affect PCR amplification (Farrelly et al., 1995). This is due to genome copy number and size variability (Sharma et al., 2007).
Thus, band intensity may not be a true reflection of microbial community abundance (Malik et al., 2008).
CONCLUSIONS
Consequently, a powerful technique, microarrays, has been developed, which enables the analysis of an entire genome at the same time (Madigan et al., 2003; Hartmann et al., 2007). A large number of nucleic acids can be distinguished on a very small surface and then hybridized simultaneously (Kelly, 2003; Hartmann et al., 2007). Microarrays can characterize environmental microbial populations and their function, as the expression of thousands of genes can be compared both qualitatively and quantitatively (Kelly, 2003; Madigan et al., 2003; Hartmann et al., 2007).
Microarray technology avoids some of the limitations of 16S rRNA-based protocols as functional genes are analyzed (Kelly, 2003) and the method is relatively rapid (Tiedje et al., 2001).
EFFECTS OF LAND USE AND MANAGEMENT ON SOIL BACTERIAL
INTRODUCTION
Harvesting of green cane with litter blanket retention resulted in organic matter accumulation and concomitant increases in microbial biomass and basal respiration compared to preharvest burning (Graham et al., 2002a,b). In addition, fertilized plots generally had higher soil organic C content and microbial biomass than unfertilized plots due to higher yield and consequently greater return of organic residues to the soil (Graham et al., 2002b). Molecular profiling using DGGE analysis of amplified 16S rDNA is a powerful tool in studying bacterial diversity in complex environments (Smalla et al., 2001; Smit et al., 2001).
Therefore, PCR-DGGE was used to determine the impact of different land use and management practices on the genetic (structural) diversity of the soil bacterial communities at two sites in KwaZulu-Natal, where the organic matter status and the size, activity and catabolic diversity of the microbial communities had been previously studied (Dominy and Haynes, 2002; Graham et al., 2002a, b).
MATERIALS AND METHODS
- Sites and soils
- Site sampling
- Chemical analysis
- DNA extraction
- PCR amplification of 16S rDNA fragments
- Community fingerprinting by DGGE
- Data analysis
- Statistical analysis
For the Mount Edgecombe samples, because the DNA concentration was low, 0.7 g field-moist soil from each replicate of the four treatments was added to the MO BIO tubes. PCR conditions were as described in a method, adapted and optimized for environmental samples, in the laboratories of the University of KwaZulu-Natal (Pecku, 2003). Band intensity was expressed as a percentage of the summed average band intensities over each gel.
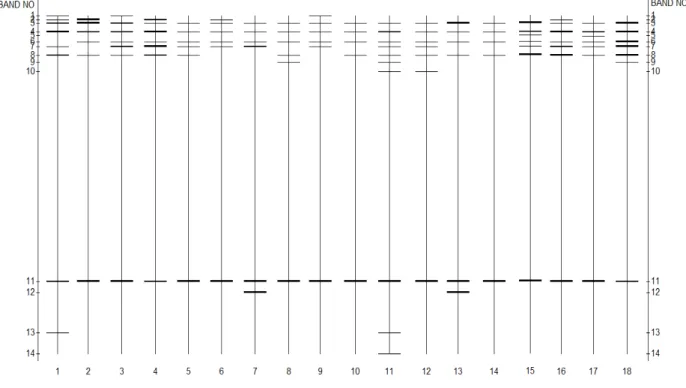
Each band was inferred to represent individual groups of species with similar melting domains, whereas band intensity indicates the relative abundance of the group under the PCR conditions used (Eaton and Farrell, 2004; Wakelin et al., 2008a).
RESULTS
- Analyses of soils at the Baynesfield experimental site
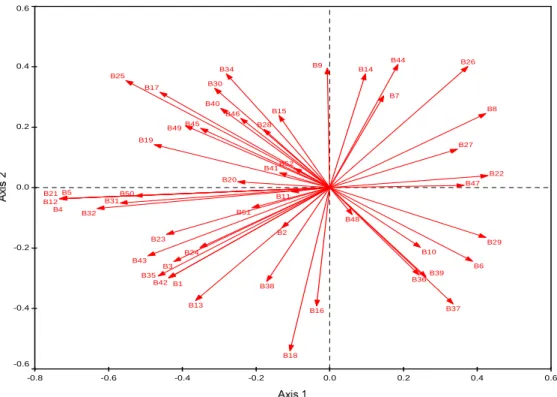
- Soil bacterial community structure at the Baynesfield experimental site
- Analyses of soils at the Mount Edgecombe experimental site
- Soil bacterial community structure at the Mount Edgecombe experimental
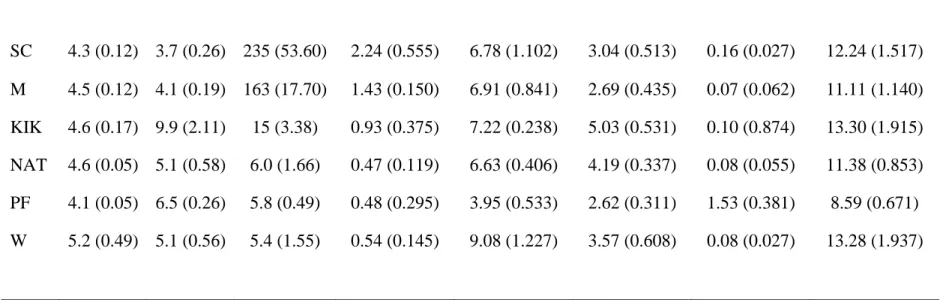
Analysis by PCA grouped the repeated soil samples from the different land uses based on the correlation between the samples and soil variables (Figure 3.1). The means (± standard deviation) of the different physico-chemical properties of soils under the four sugarcane residue management practices are summarized in Table 3.8. These variables together accounted for 100% of the total variance explained by all the soil properties tested (Table 3.10).
However, a two-way ANOVA of the main effects and interaction of litter mulch (T)/no mulch (Bto) and fertilizer (F)/no fertilizer (Fo) on bacterial community richness, evenness, and diversity showed a significant difference in richness as an effect of fertilizer application ( fertilizer / no fertilizer) (p = 0.051).
DISCUSSION
- Bacterial community structure under different land uses at the Baynesfield
- Bacterial community structure under different trash management practices
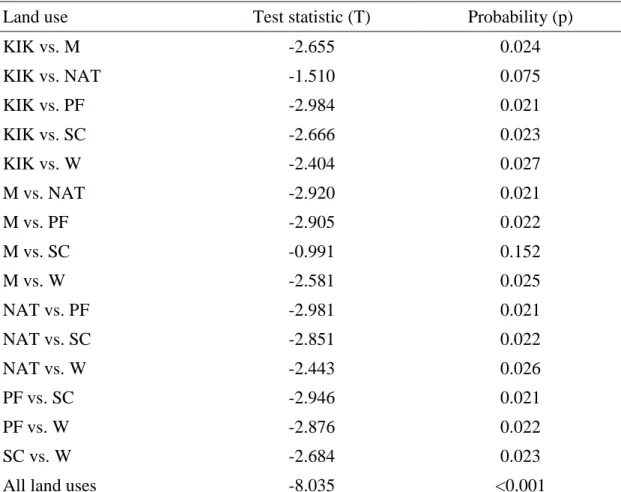
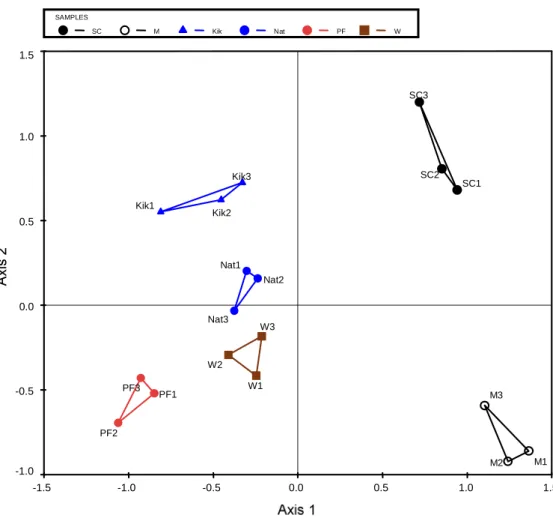
The DNA band profiles obtained allowed the study of the complex communities in the soil samples, since most bacterial genotypes (species) usually produce a single band (Dilly et al., 2004). In addition, the intensities of the DNA bands are strongly correlated with the relative level of abundance (mass) of the different bacterial strains (Dilly et al., 2004; Pairwise comparisons separated maize bacterial communities from those under pine and wattle, although no differences found in pairwise comparisons of the communities among the other land uses.
It has already been shown in the present study that litter retention results in an accumulation of soil organic matter and, as reported by Graham et al. 2002b), it is associated with an increase in the size and activity of the soil microbial community.
CONCLUSIONS
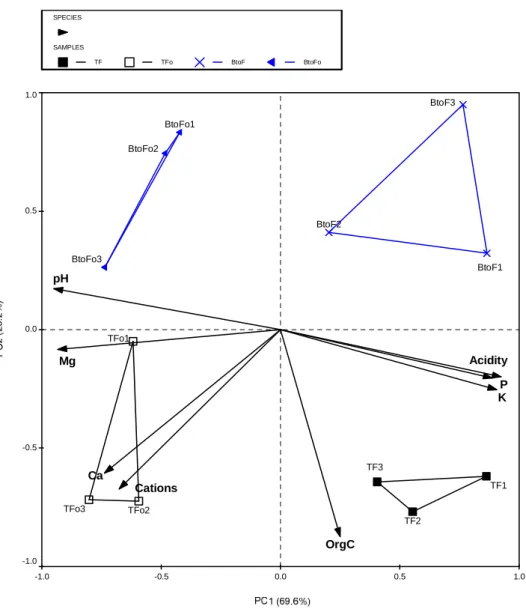
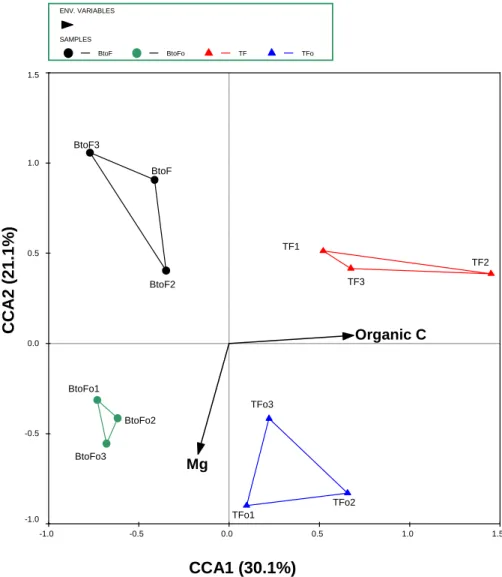
The substantial difference in the soil chemical environment between fertilized and unfertilized treatments resulted in large differences in bacterial community composition, especially under litter retention (Figure 3.7). However, the effects of the different treatments on the soil bacterial communities at site 2 were less noticeable than the effects of different land uses at site 1. The PCR-DGGE fingerprinting method used successfully separated the complex bacterial communities in the different experimental soils.
For future studies, PCR-DGGE combined with microarrays will provide a better quantitative assessment of the genetic diversity of the soil bacterial communities.
EFFECTS OF LAND USE AND MANAGEMENT ON SOIL FUNGAL
INTRODUCTION
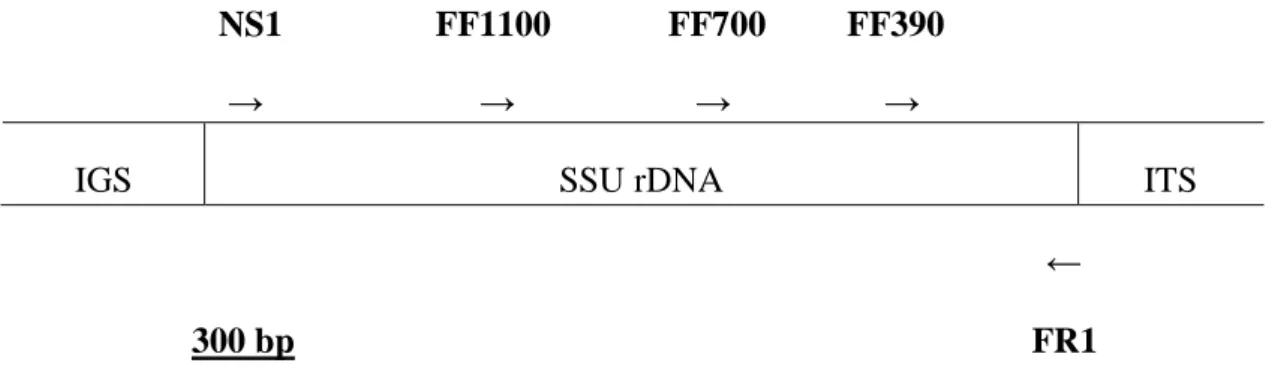
More specifically, the influence of the richness and evenness of saprotrophic fungal species on the decomposition of organic matter is unknown (Deacon et al., 2006). Molecular methods are increasingly used to investigate both cultivable fungi and the total fungal communities in soil (Hagn et al., 2003; Mitchell and Zuccaro, 2006). With the development of universal fungal-specific primers designed to amplify partial SSU rDNA fragments (18S rDNA), PCR analysis (section 2.4.2.2) can be used to reveal the species composition of a mixed DNA sample (Vainio and Hantula, 2000; Hagn et al., 2003).
Comparisons of 18S rDNA provide insight into the diversity of unrelated or distantly related fungal taxa, while an alternative target for fungal PCR, namely the ITS region, is mainly used to compare closely related species and strains (Hagn et al., 2003 ).
MATERIALS AND METHODS
- Study sites and soil sampling
- Chemical analysis
- DNA extraction and purification
- PCR amplification of fungal 18S rDNA fragments
- Community fingerprinting by DGGE
- Data analysis
- Statistical analysis
Reaction mixtures were prepared using the PCR Core Kit (Roche Diagnostics) according to the manufacturer's instructions and were optimized for the experimental soils. Partial SSU rDNA fragments were analyzed by the DCode™ Universal Mutation Detection System (Bio-Rad). Following the procedure, gels were either silver-stained (H. van Verseveld, personal communication)3 or stained for 30 min with SYBR® Green I (Roche Diagnostics) (10,000-fold diluted in 1 × TAE) according to the manufacturer's instructions. instructions.
SYBR® Green I-stained gels were visualized under UV light, and all gels were photographed and documented with a Bio-Rad VersaDoc imaging system.
RESULTS
- Analyses of soil physicochemical properties at both sites
- PCR-DGGE analysis of fungal communities
- Statistical analysis of fungal communities at Baynesfield Estate (site 1) . 113
- Effects of different land uses and management practices on soil fungal
- Baynesfield Estate (site 1)
- Mount Edgecombe (site 2)
- Overall assessment of the DGGE analysis of the soil fungal communities
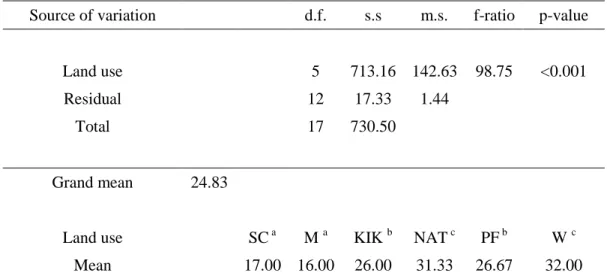
Analysis of species richness (S) (number of bands present = number of different groups of species) by one-way ANOVA of the soil fungal populations at this site, showed an overall difference between the different fungal communities (Table 4.3). An overall significant difference (p < 0.001) in species richness (S) of the fungal communities at this site was shown by one-way ANOVA (Table 4.4). This may possibly be responsible for the clustering behavior of the majority of bands observed in the fungal gels in this study as well as in those of other workers.
Analysis of the DGGE profiles clearly separated the different fungal communities from the four crop residue management soils.
CONCLUSIONS
Therefore, when using very long molecules, some of the base pair differences may remain undetected (Vainio and Hantula, 2000). Fertilizer applications, organic C and pH were all shown to have a positive impact on fungal community richness and genetic diversity under different land use types. At Mount Edgecombe, the fungal communities were also very homogeneous and stable, showing very little variation within and between treatments.
Here again, pH influenced fungal communities, with fertilizer and organic C application increasing community richness.
DNA-DERIVED ASSESSMENTS OF FUNGAL COMMUNITY
INTRODUCTION
Broad-based diversity studies can be performed with the small (18S rRNA) subunit ribosomal RNA gene, which can be used in phylogenetic analyzes to determine evolutionary relationships among taxa. A large, ever-expanding electronic database of SSU gene sequences (both of 16S in prokaryotes and 18S in eukaryotes) makes it possible to identify many soil bacteria, archaea, and fungi at the genus, species, and occasionally subspecies level. The aim of this component of the current study was to extend the scope of the initial work carried out in the period 2004–2006 by: (i) using an additional universal fungal primer pair to that used in Section 4.2.5 to provide a wider range of sequences; (ii) modifying the DGGE protocols and testing different denaturation gradients to improve band separation; and (iii) sequencing some of the prominent, common bands to show whether individual bands contained more than one fungal species, to reveal the presence of chimeras, and to identify if apparent.
This approach allowed a more accurate assessment of the effects of different land uses and management practices on the structural diversity of the soil fungal community at the two sites.
MATERIALS AND METHODS
- Study sites and soil sampling
- Chemical analysis
- DNA extraction, purification and quantification
- PCR amplification of fungal 18S rDNA fragments
- Community fingerprinting by DGGE
- Data analysis
- Statistical analysis
- DNA sequencing analysis of DGGE bands
Despite additional measures, no bands were visible in the subsequent agarose gel, which was attributed to a DNA concentration below the detection level of the gel (~2–5 ng), and indeed this was found to be the case. Band patterns of DGGE profiles were analyzed using Bio-Rad Quantity One™ image analysis software (version 4.6) for band number, position, and relative band intensity (details in Section 3.2.7). The aim was to test previous assumptions (Section 4.4) that individual DGGE bands may comprise more than one DNA fragment with a slightly different sequence but the same mobility (Kowalchuk et al., 2002), or that the band may contain fragments from different fungi that may have flowed together due to the similarity of G + C content among eukaryotic DNA (Stanier et al., 1987).
Comparisons of partial soil fungal 18S rDNA sequences from both locations obtained from excised strips and closest matches in the National Center for Biotechnology Information (NCBI) Nucleotide Database were made using the online standard BLAST (Basic Local Alignment Search Tool) program (http://www.ncbi.nlm.nih.gov/).
RESULTS
- Analyses of soils at the Baynesfield experimental site (site 1)
- PCR-DGGE analysis of fungal communities
- Soil fungal community structure at Baynesfield Estate (site 1)
- Analyses of soils at the Mount Edgecombe site (site 2)
- Soil fungal community structure at Mount Edgecombe (site 2)
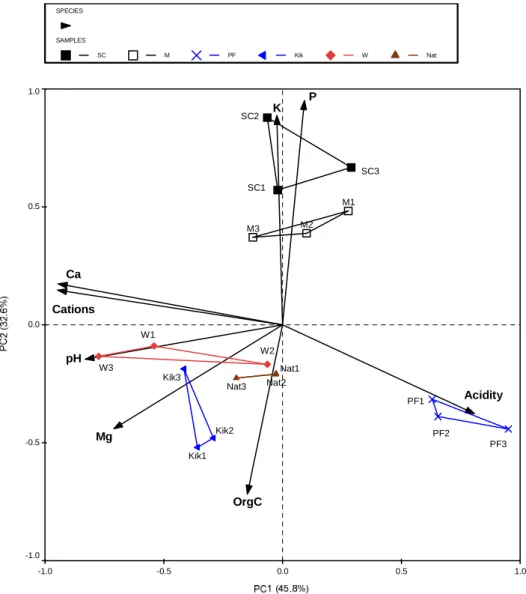
The PC1 (horizontal axis) and PC2 (vertical axis) accounted for 45.2% and 26.2% of the total variance in the soil data, respectively. ANOVA of soil fungal community evenness (J) among the different land uses at Baynesfield, showed a marked overall difference in the evenness of the fungal species present (Table 5.4). The PC1 (horizontal) and PC2 (vertical) components accounted for 75.0% and 16.0%, respectively, and cumulatively accounted for 91.0% of the total variance in the soil data.
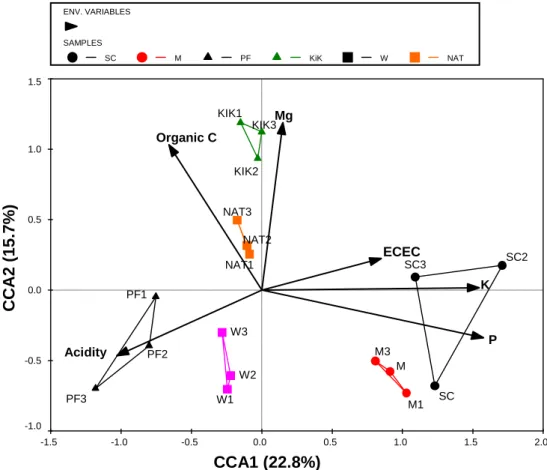
The results of sequencing the 18S rRNA gene fragments from the excised bands of the soil fungal communities under the different treatments at Mount Edgecombe (identified using the NCBI nucleotide database and the megaBLAST program) are shown in Table 5.7.
DISCUSSION
- Effects of different land uses on soil fungal community structure at
In addition, the number of bands produced in the fungal gels was lower than that of the bacteria from the same location. Moreover, diversity of the soil microbial community is considered an important measure of sustainable land use (Yao et al., 2006). The pine soil fungal communities were distinct from those of the other land uses as shown by NMS.
In this study, analysis of soil fungal community structural richness, evenness, and the Shannon Weaver Diversity Index indicated that land management practices had
CONCLUSIONS
The use of fertilizers in the treatment of harvested cane increased the richness of the fungal community in the soil compared to the unfertilized treatment. At site 1, different land use on the same soil type influenced the structural diversity of soil fungal communities. At site 2, differences in soil fungal communities under the four land management practices were less pronounced than at site 1.
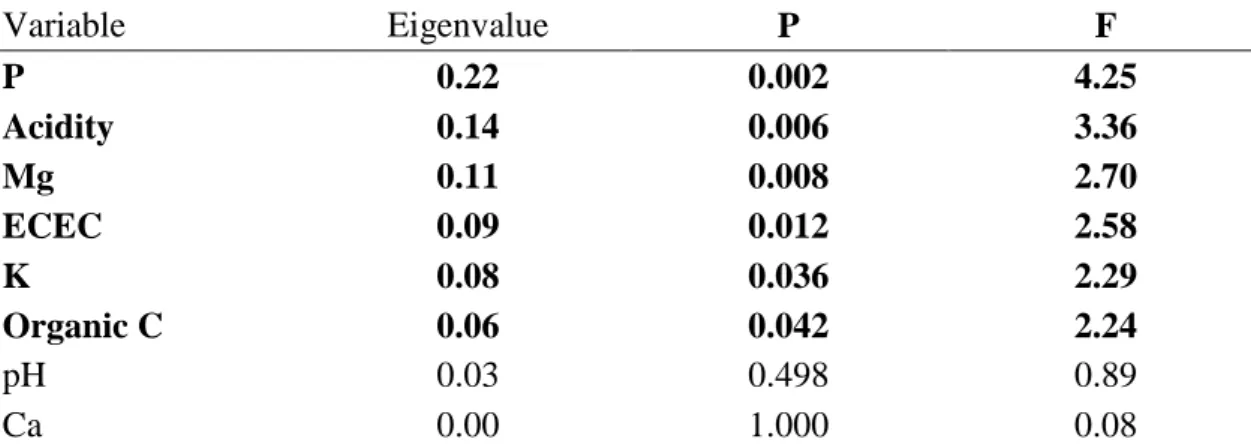
Soil variables that had a significant effect on the fungal communities at site 2 were organic C, ECEC and pH.
EFFECTS OF LAND USE AND MANAGEMENT ON SOIL BACTERIAL
INTRODUCTION
MATERIALS AND METHODS
- Study sites and soil sampling
- Chemical analysis
- Soil moisture
- CLPP using BIOLOG microplates
- Data analysis
- Statistical analysis
RESULTS
- Analyses of soils at the Baynesfield experimental site
- Bacterial catabolic (functional) diversity at Baynesfield
- Analyses of soils at the Mount Edgecombe site
- Bacterial catabolic (functional) diversity at Mount Edgecombe
DISCUSSION
- Bacterial catabolic (functional) diversity at Baynesfield Estate
- Bacterial catabolic (functional) diversity at Mount Edgecombe
CONCLUSIONS
EFFECTS OF LAND USE AND MANAGEMENT ON SOIL FUNGAL
INTRODUCTION
MATERIALS AND METHODS
- Study sites and soil sampling
- Chemical analysis
- Soil moisture
- CLPP using BIOLOG microplates
- Data analysis
- Statistical analysis
RESULTS
- Analyses of soils at the Baynesfield experimental site
- Soil fungal catabolic (functional) diversity at Baynesfield
- Analyses of soils at the Mount Edgecombe site
- Soil fungal catabolic (functional) diversity at Mount Edgecombe
DISCUSSION
- Fungal catabolic (functional) diversity at Baynesfield Estate
- Fungal catabolic (functional) diversity at Mount Edgecombe
CONCLUSIONS
GENERAL CONCLUSIONS
RATIONALE FOR THE RESEARCH
MEETING THE RESEARCH OBJECTIVES
CRITICAL EVALUATION OF THE RESEARCH
- Evaluation of the soil sampling procedures
- Evaluation of the PCR-DGGE profiling method
- Evaluation of the BIOLOG method for physiological profiling
IMPLICATIONS OF THIS RESEARCH FOR AGRICULTURE
- Baynesfield Estate
- Mount Edgecombe
RECOMMENDATIONS FOR FUTURE WORK
CONCLUDING REMARKS