To Professor D. Ramjugernath (Chemical Engineering UKZN) for the use of the Thermodynamics Laboratory (Chemical Engineering Building on the Howard College UKZN campus) and for conducting the chemistry-related parts of the research. Some fiber images taken with a microscope are presented with calculated average fiber diameters. Measurements were made over a range of frequencies to observe the change in the reactive component of the impedance.
INTRODUCTION
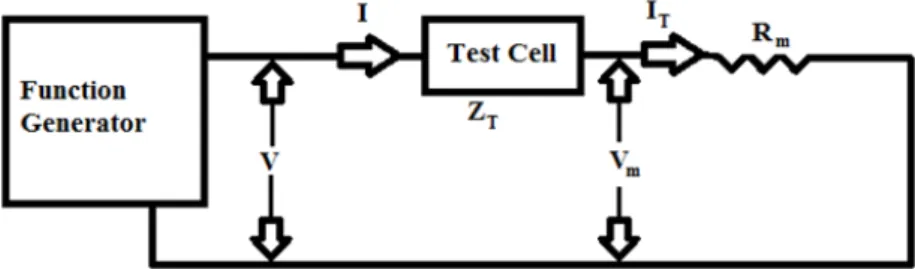
Conclusions about which electrospinning parameters are most suitable for producing the most uniform fibers with the smallest possible diameters are made based on the results of electrospinning fiber characterization. A good electrical insulator is defined by many different properties depending on the application (voltage level, power level, contamination level, etc.). The data obtained includes the absolute resistance, reactance, resistance and phase angle of the voltage across the sample with respect to the input waveform. Fiber impedance test results were analyzed in order to draw conclusions on the effects of different fiber morphologies on the impedance of an air gap.
LITERATURE REVIEW
- The Electrospinning Process
- Electrospinning Processing Parameters
- Field Control
- Delivery System
- Collection System
- Applied Voltage
- Feed/Flow Rate
- Tip to Collector Distance
- Electrospinning Solution Parameters
- Ambient Parameters
- Solutions Used in Electrospinning of Silica
- Spin on glass (SOG)
- Silatrane
- Tetraethoxysilane (TEOS)
- Simulation of the Electrospinning Process
- Initiation of the jet
- Stable section of jet
- Complete jet modelling
- Jet path modelling
- Possible causes of disturbance to the jet
- Methods of Nanofibre Characterization
- Chemical characterization
- Morphological characterization
- Mechanical characterization
- Impedance Spectroscopy
The preparation of the electrospinning solution was simply the addition of Poly(Vinyl Pyrrolidone) (PVP) to SOG interlayer solution [43]. Research on the stable part of the electrospinning beam was done by Spivak et al [56]. The gravitational forces were neglected due to gravity having a negligible effect when the jet has a small initial diameter (45µm in the case of the model and experiment presented by Spivak et al) [56]. The main variable inputs to the model were [56]: 1) Current density, 2) Average electric field and 3) Initial radius.
EXPERIMENTAL SETUP
Apparatus Used to Mix Electrospinning Solution
Electrospinning Apparatus
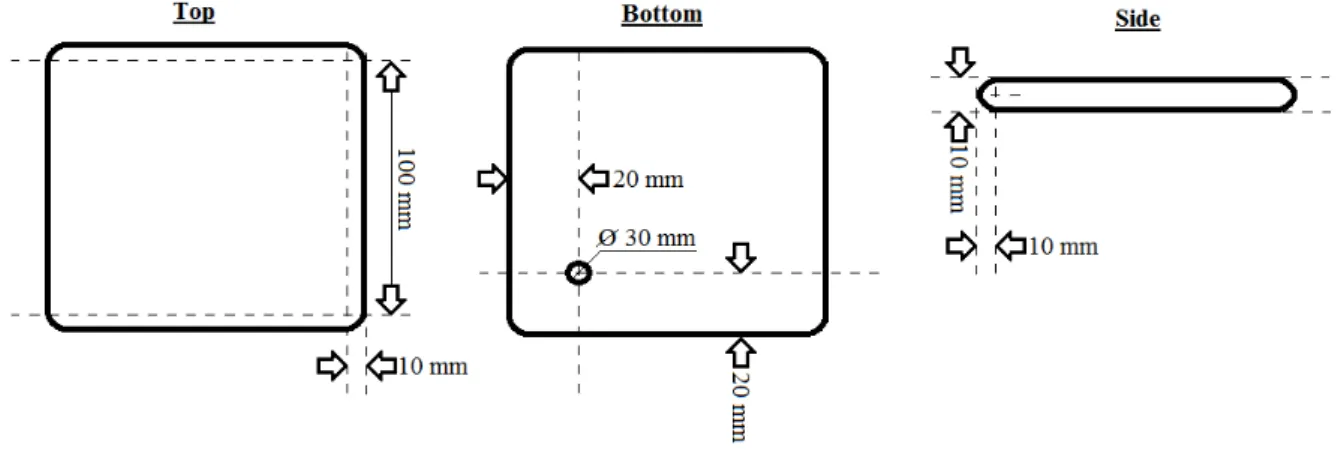
- Design of copper collector plates
- Design of perspex housing
- Optimisation of solution delivery system
- Design of high voltage supply
The purpose of the hood is to mitigate interference in the jet path (air leakage from the laboratory air conditioning, dust particles in the laboratory, etc.). To reduce the potential appearing in the syringe pump electronics, the resistance of the solution in the syringe was increased by adding a length of tubing between the syringe and the needle. The output voltage is controlled by changing the turn-on angle of the semiconductor devices in the final rectifier [74].
The flyback converter was feasible to build due to the availability of parts and the fact that some of the complicated circuitry for activating the semiconductor switch could be replaced by a function generator available for laboratory use. In the on position, the semiconductor switch will be forward biased, allowing the DC power supply to supply current to the primary coil of the flyback transformer [76]. The diode at the output of the secondary coil is reverse biased and prevents the flow of current [76].
The energy in the secondary coil of the flyback transformer is now discharged with reversed polarity. In the first stage of the flyback converter, a semiconductor device is required to switch the DC supply at high frequency. The design can be further optimized by introducing a voltage clamp on the collector of the BJT.
The optimal frequency and duty cycle of the flyback converter were determined by varying them through the function generator and monitoring the output on an oscilloscope.
Apparatus Used for Nanofibre Characterization
EXPERIMENTAL PROCEDURE
Mixing the Solution (Precursor) to be Electrospun
- Producing silica sol
- Producing aqueous poly (vinyl alcohol)
- Introduction of PVA to the silica sol
- Optimisation of the solution viscosity and surface tension measurement 35
- Loading up the precursor
- Prepping the collector for electrospinning
- Arranging processing parameters and preparing area for video capture
- Ramping up the voltage
It was found that the best equipment for mixing 30 ml of aqueous PVA is a 100 ml beaker and a stirrer large enough to span almost the diameter of the beaker. Sufficient stirring is required to prevent the crystals from sticking to the sides of the beaker. The standard test procedure was to increase the voltage until the most stable electrospinning current was observed at the top of the roll.
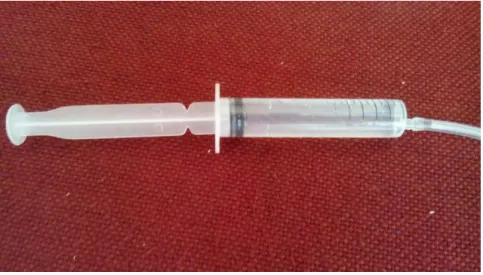
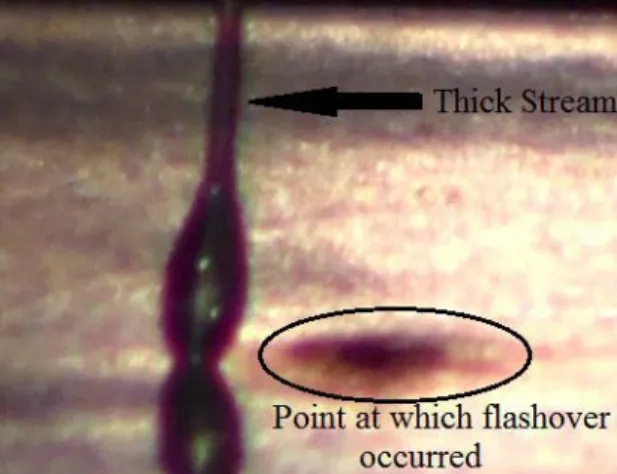
A video camera with 52x optical zoom was used to check the stability of the electrospinning jet. The operating point at which fiber formation is known to occur was identified during the optimization of the electrospinning precursor solution. A 10-ml syringe is used to inject the solution into the tubing until it half-fills the compartment connected to the end of the tubing (Figure 4.4).
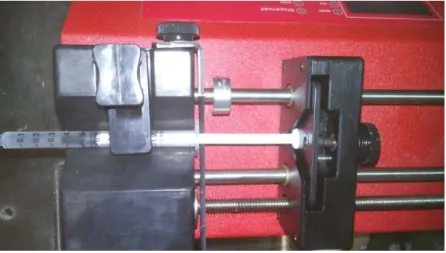
The centrifuge opening is then blocked while the 10 mL syringe is removed to prevent the solution from leaking out. Once this is done, the pre-solution completely fills the spinneret to the end of the needle. The inner diameter of the syringe must be entered into the syringe pump and the desired flow rate set.
A black box is placed on one side of the spinneret and collector so that the distinct electrospinning beam can be clearly seen.
Nanofibre Characterization
- FTIR
- SEM analysis
- Impedance Spectroscopy
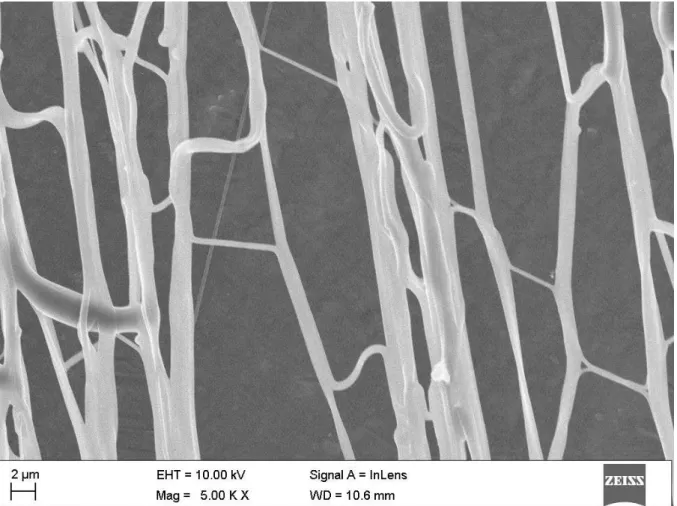
These were aimed at obtaining the average fiber diameter and determining the average area of fiber deposition. The average application area is defined as the average area of the film (the fibers were applied to this film during electrospinning) that is not visible due to the deposited fibers. ImageJ software detects all boundaries between white areas and black areas, and then finds the total area of all white areas.
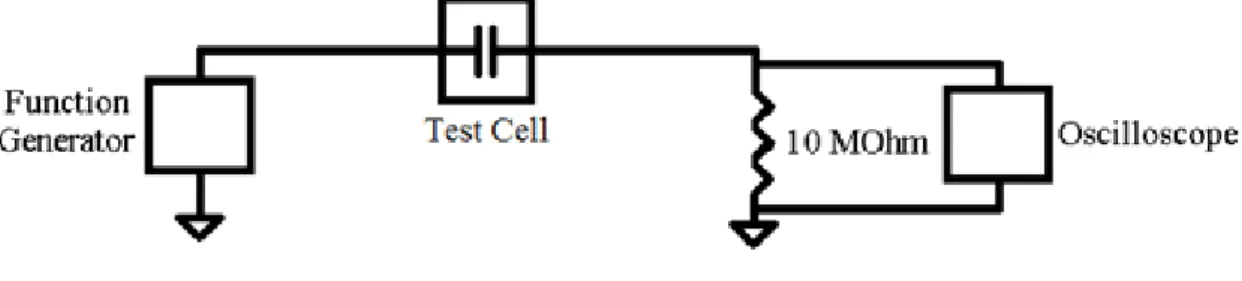
The deposition area was then calculated by subtracting the total area of all white areas from the total area shown in the image and dividing by the total area of 1971.2962 μm2 to give a percentage. The average deposition area for a given sample was calculated by averaging the deposition areas of all images obtained from that sample. The voltage waveforms displayed on the oscilloscope were used to determine the resistance of the test samples.
With the 10MΩ resistor, small currents of the order of μA could be measured as volts by the oscilloscope. Measurements were taken over a range of frequencies so that the frequency response of the test cell could be plotted. Accurate measurement was also impossible above 10 kHz due to the bandwidth of the measuring probe used.
These two values were used in Equation 9 (derivation in Appendix A1) to calculate the resistivity of the test cell.
RESULTS AND DISCUSSIONS
Results of analysing SEM images
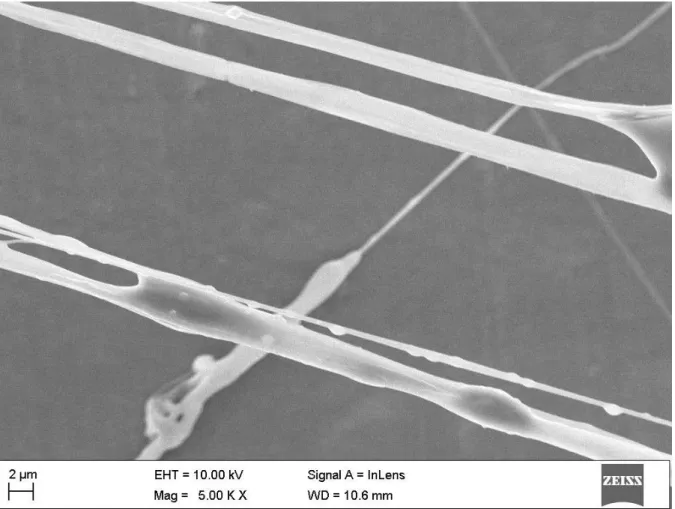
There are significant deviations in both fiber diameter and area of deposition between all the random areas imaged from sample one. 50 is 112 nm and the maximum fiber diameter is 1400 nm. Table 3 shows all the data obtained for sample 3 and the calculated average area of deposition. The area of deposition and mean diameters are relatively constant across the five random areas.
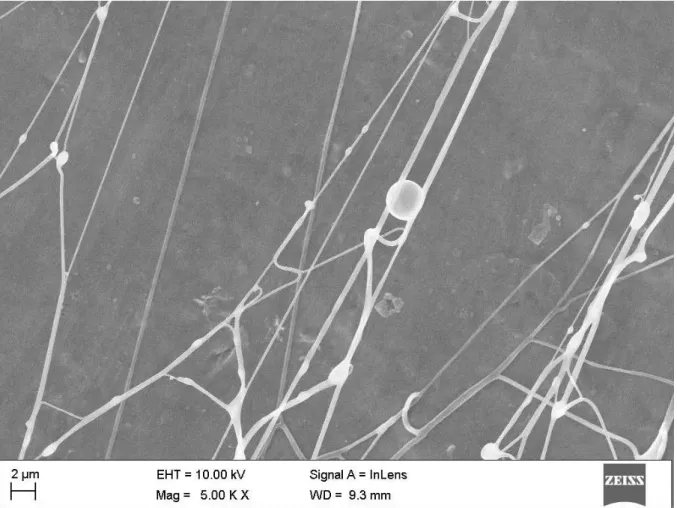
Thus, increasing the applied voltage decreases both the average diameter and area of deposition (area over which electrospinning occurred increased). The average diameter of fibers in the random area of sample 4 shown in Figure 5.4 approaches 816 nm. The lower flow rate produced fibers with a lower area of deposition and lower average fiber diameter compared to the base case.
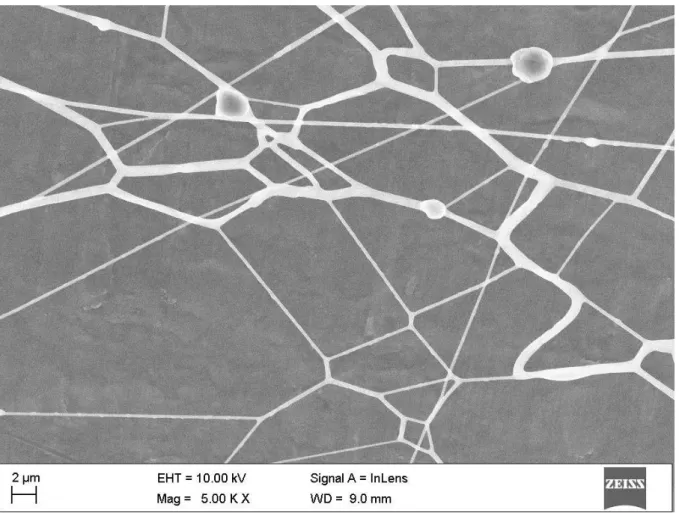
The minimum fiber diameter is 189 nm and the maximum fiber diameter is 472 nm. Table 5 shows all the data obtained for sample 5 and the calculated average deposition area. Although the area of settlement in the five random areas is more uniform than in the base case, it is much smaller. The results of varying the flow rate show that any change in flow rate (decrease or increase) decreases both the mean diameter and the deposition area.
The resulting deposit will result in a smaller diameter and a smaller deposit area.
Results of impedance testing
The intensity of the electric field changes slightly because the voltage can no longer pass to the edge of the spinner (now plastic). This means that less electric field strength is required to move the solution away from the spinneret. The combination of the two aforementioned factors would cause the solution to withdraw faster from the spinneret.
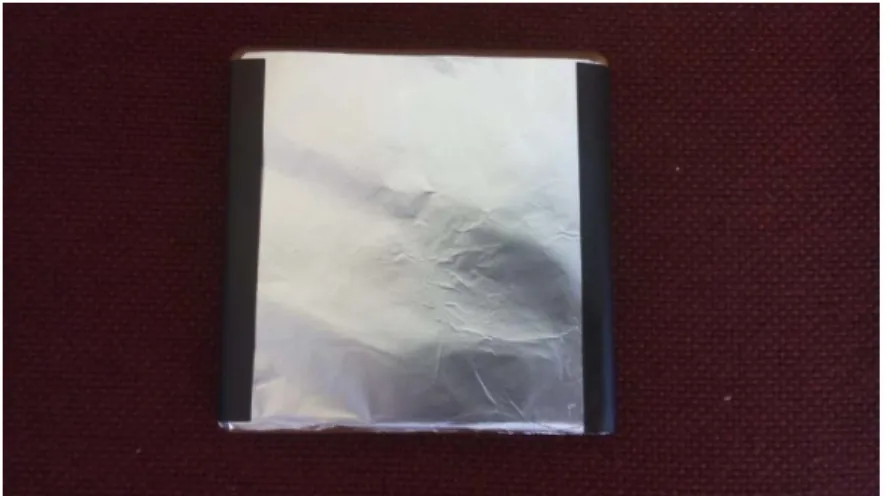
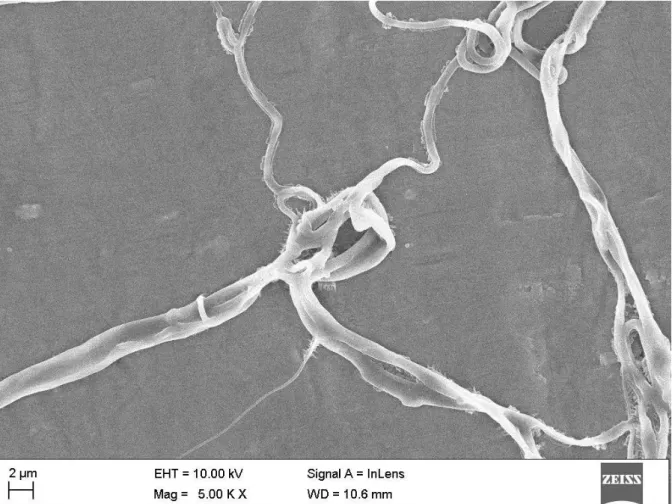
Areas of the collector where the braids are deposited will have very high deposition areas, while other areas will have a low deposition area. When these are averaged to get an average deposition area for the plastic spinneret, the deposition area is pushed up by the random areas that had high deposition areas. The mass of each sample was measured by first measuring the mass of a foil disk without nanofibers and subtracting this value from the mass of a foil disk with nanofibers.
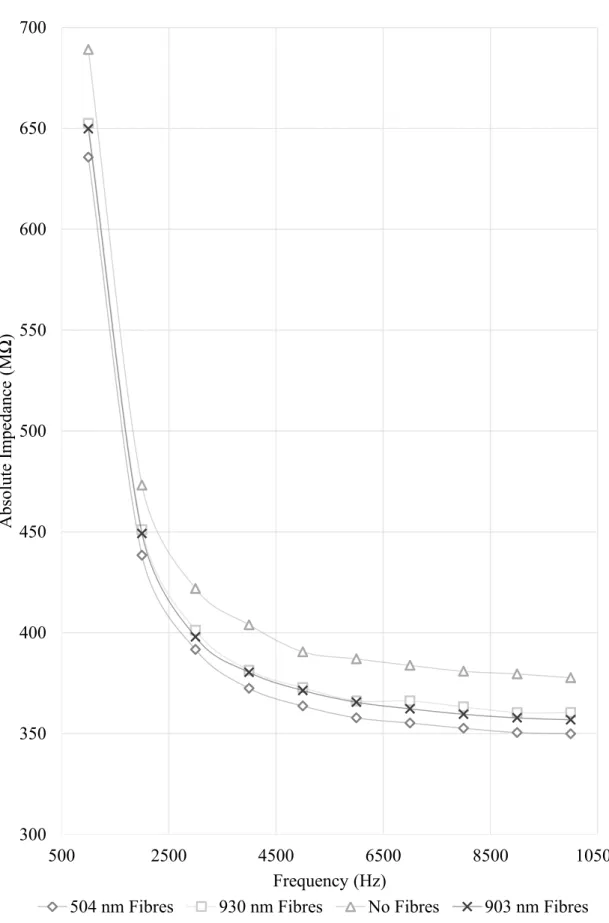
The calculated results of the absolute impedance of the air gap with different nanofiber morphologies present are shown in Figure 5.7. To better understand this result, the resistance and reactance for each sample were extracted from the impedance using the phase angle of the current through the sample with respect to the input voltage. This can be seen in the graphs of reactance versus frequency (Figure 5.9) and resistance versus frequency (Figure 5.10).
The resistance of the opening without fibers is significantly higher than that of the other samples.
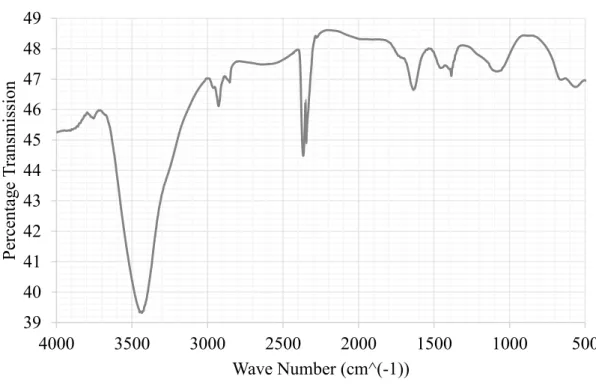
Infra-red spectroscopy
CONCLUSION
Nilsson, “The measurement of very low conductivity and dielectric loss in XLPE cables: a possible method to detect degradation due to thermal aging,” IEEE Transactions on Delectrics and Electrical Insulation, vol. Damerchely, “The effect of flow rate on the morphology and deposition area of nylon 6 nanofiber,” Journal of Engineered Fibers and Fabrics, vol. Park, “The effects of solution properties and polyelectrolyte on electrospinning of ultrafine poly(ethylene oxide) fibers,” Polymer, vol.
Taylor, "The force exerted by an electric field on a long cylindrical conductor," Proceeding of the Royal Society of London, vol. Stauffer, "The measurement of surface tension by the pendant drop technique," The Journal of Physical Chemistry, vol. Feng, “The stretching of an electrified non-Newtonian jet: A model for electrospinning,” Physics of Fluids , vol.
The raw measurement data includes: (a.) Peak-to-peak voltage measured across the 10MΩ resistor, (b.) The times at which one oscillation of the input voltage sine wave began and ended, and (c.) The time at which the output sine wave (over the 10 MΩ resistor) oscillation closest to the measured input oscillation start time started.