Discuss the problems and shortcomings of the current methodology used to obtain the various runoff forecasts. The previous chapter provided an overview of climate variability in South Africa.

Water Demand in South Africa
Industrial demand
The demand for water for industrial processes is relatively constant throughout the year, and increases linearly over time due to industrial expansion. The economic stability of industrial regions therefore depends on the stability and assurance of water supply throughout the year and between years.
The Relationship Between Water Supply and Demand
The relationship between domestic water demand and supply
This means that industrial demand for water is relatively constant regardless of fluctuations in supply. Variability could increase, leading to an increase or decrease in the frequency of extreme events at both ends of the scale.

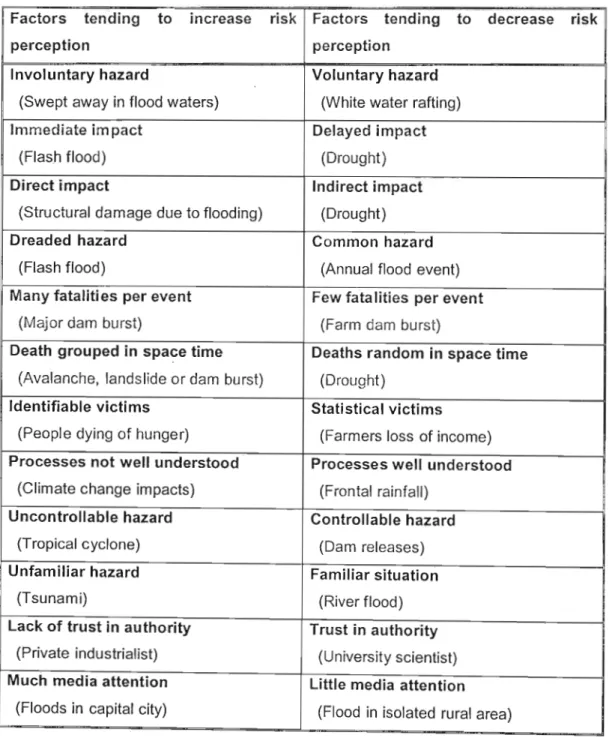
The major factors influencing the risk associated with environmental hazards in South Africa
- Changes occurring within the physical system
Perhaps the most important factor causing increased economic and life losses from hazards is the change in the vulnerability of the human environment. Changes in vulnerability in South Africa can be attributed to changes in resilience due to changes in the population dynamics of the country.
Age distribution of South African Population
In 1995, the urban population was 53.7%, implying that the majority of South Africans lived in urban areas (Orkin, 1999). Proportionally, a larger percentage of the economically active population between the ages of 20 and 60 lives in urban areas.
Age distribution of urban and non-urban black papulation
Percentage
I_Urban dwellers _ Non.urbarulweilers I
Drought
The majority of losses are confined to less developed countries (LDCs) that lack the financial and physical infrastructure to cope with drought disasters (Elements, 1990). The consequences of floods and droughts can be divided into different categories, depending on the nature of the consequences (direct indirect) or the measurability of the consequences (tangible or intangible), as shown in Figure 5.1. Some of the high-risk areas characterized by development in South Africa are listed below (van Beek, 1993; Smith and Ward, 1998).
In the case of a scarcity hazard event, such as a drought, the primary strategies to modify the event revolve around improving the phenomena that would result in a reduction of the hazard, such as promoting precipitation in the event of a drought. Implementation of such systems in less developed countries such as South Africa is limited due to financial implications. In less developed countries such as South Africa, the institutional and political framework and the lack of scientific knowledge make it difficult to implement land-use planning.

Methodologies Used to Obtain Hydrological Forecasts
Jury (2001) used stepwise multivariate regression techniques to obtain streamflow forecasts for a number of rivers in South Africa and provides a review of the use of statistical methods to forecast streamflow in southern Africa. However, many of the catchments that generate flow at gauge points have experienced significant changes in terms of land use changes and the construction of reservoirs, resulting in non-stationarity of flow data series (Kienzle et al., 1997). This method relies on the accuracy of the precipitation forecasts that can be obtained from either or both statistical and physical-numerical models.
The persistence approach simply assumes that SST will remain unchanged over the forecast period (Graham, 1996). A solution to the downscaling problem would be to add another level in the form of mesoscale local atmospheric models, which could increase the resolution of precipitation forecasts (Graham, 1996). However, when considering the coarseness of precipitation forecasts, these techniques have been shown to perform adequately (Lecler et al., 1996).

Objectives
A detailed description of the development and application of the indirect methodology used to produce runoff forecasts from one-month, three-month, and four-month categorical rainfall forecasts is provided. Discuss the problems and shortcomings of the current methodology used to obtain the various runoff flows. Therefore, before proceeding to review the individual rainfall forecasts and evaluate the results of the runoff forecasts, it is important to define two terms used to evaluate forecast performance, viz.
In terms of the categorical rainfall forecasts, the number of times the forecast falls into the correct category could be defined as the accuracy of the forecast, and for the purpose of this study will be referred to as the “hit rate”. The predictive data set was obtained from the South African Weather Bureau district rainfall data (van Rooy, 1972) for the same period as the predictive data set. A principal components analysis using empirical orthogonal functions was then used to identify the variables that explain the majority of the variation in both the predictive and predictive data sets.

REGIONS FOR FOUR MONTH
CATEGORICAL RAINFALL FORECASTS (after Landman, 1998)
Furthermore, in some years actual and forecast categories corresponded very well (bold letters), while in other years the categorical forecasts were less accurate. Therefore, only the forecasts up to the end of 1993 could be used in the verification studies. The overall accuracy for the 12-year period improves from 50% to 55.5%, as the last three years were poorly predicted, with fewer than three of the six regions' forecasts being correct.
Landman (1999, pers.) provided two data sets for different three-month categorical precipitation forecasts, shown in Tables 7.2 and 7.3, for eight regions covering the study area (Figure 7.2). Forecasts were generated using the June-July-August retrospective field data on three-month SST anomaly for the Pacific, Indian and Atlantic Oceans. The regions for the one- and three-month precipitation forecasts have been updated from the regions used for the four-month forecasts discussed in the previous section.

REGIONS FOR ONE AND THREE MONTH
CA TEGORICAL RAINFALL FORECASTS (after Landman 1999)
In this study, several different techniques were used to evaluate the accuracy and skill of the runoff predictions. Figure?7 Simplified depiction of the programming framework used to produce runoff forecasts from the categorical rainfall forecasts (both real-time or retroactive hindcasts). These rainfall records, extracted from the Quaternary Catchment database, are then used together with the categorical rainfall forecast data in the forecast processing module of the program (Figure 7.7) to generate representative daily rainfall forecasts for the region concerned, using the methods described . in section 7.4.
The median value (i.e. the value of rank 22 in a data set with 43 values) was then chosen to represent normal rainfall. For a given Quaternary basin, during a given 30-day precipitation forecast period (e.g., January 24, 1979 - February 22, 1979), the ACRU model with daily time steps was then run with historically observed daily precipitation for the two entire previous years (i.e., from January 1 1977). to December 31, 1978) and to the predicted date (i.e. to January 23, 1979) to initialize prior conditions and stores of e.g. a) the release of the base current storage and the base current b) the release of the storm current storage and the storm current c) the soil moisture content in the topsoil and subsoil. Techniques similar to those used in evaluating runoff forecasts based on the categorical rainfall forecasts were used to evaluate the accuracy and skill of the 30-day runoff forecasts.
The results of runoff forecasts produced using the categorical rainfall forecasts are compared to the results of runoff forecasts produced using the 100% accurate categorical rainfall forecasts. In Figure 9.1 (middle and bottom), the forecast skill results are represented in terms of 'benefit' and 'integer benefit' analyzes for the four months of runoff forecasts, comparing the actual runoff with the performance of the median value.

This section evaluates the accuracy and skill scores of the runoff forecasts produced using the three-month categorical rainfall forecasts (Tables 7.2 and 7.3 in section 7.2.3). Figures 9.3 and 9.4 show the skill and accuracy scores obtained using the actual quarterly categorical rainfall forecasts for the September and November forecasts, respectively. In Figure 9.3 (top), the quarterly runoff forecasts from September to November, which result from the retroactive precipitation forecasts, give an overall accuracy score of 42.9%, i.e.
The forecast accuracy and skill scores for the three-month runoff forecasts produced from 100% accurate categorical rainfall forecasts for September–November and November–January are given in Figures 9.5 and 9.6. Accurate rainfall forecasts therefore produce more accurate runoff forecasts for most of South Africa for the three-month runoff forecast period beginning in September. Therefore, the three-month forecast period starting in September shows that more accurate rainfall forecasts produce more accurate runoff forecasts.
Factors which could be Contributing to Low Skill and Accuracy Scores
- Improve the temporal downscaling technique used to translate both the percentage of normal rainfall forecasts and the categorical rainfall
For most of the area in the South African study region, it was found that runoff forecasting in an operational framework could not be used with current levels of accuracy and skill. Categorical precipitation forecast regions may not be fully representative of the regions for which they are delineated. In the case of statistical CCA forecasts, this could be achieved by using a larger dataset of rainfall stations to define different forecast regions.
Lower forecast accuracy and skill results of the runoff forecasts can also be attributed to the complexity of the rainfall:runoff relationship, which is clearly non-linear. In the case of the retrospective forecast period used for verification purposes, a higher percentage (50% or more for most of the study area) of the runoff generated from the actual rainfall falls into the middle Near Normal category. In the case of the categorical rainfall forecasts, a specific Quaternary Catchment Area is assigned to the same rainfall forecast category as the entire rainfall forecast region, if the Quaternary.
Suggestions for Future Research
- Improve forecasting methodology used to generate runoff forecasts
- Perform verification studies at a finer resolution on an actual operational catchment
- Produce more comprehensive agrohydrological forecasts
The level of benefit that could be derived from a forecast could thus be derived as a combination of the accuracy and skill of the forecast, the sensitivity to the causal phenomena and the vulnerability of that particular community/person to the occurrence of the hazard. Predictions in a given catchment area could be improved by better accounting for local variability. Proceedings of international conferences on world water resources at the beginning of the 21st century.
Contribution of Working Group I to the Second Report of the Intergovernmental Panel on Climate Change. Contribution of Working Group I1 to the Second Report of the Intergovernmental Panel on Climate Change. A modeling study of the relative role of tropical and extratropical SST anomalies in the variability of the global atmosphere-ocean system.