This dissertation is submitted to the University of KwaZulu-Natal for the degree of Master of Communication Pathology (Audiology).
LIST OF APPENDICES
LIST OF ABBREVIATIONS
DEFINITION OF TERMS
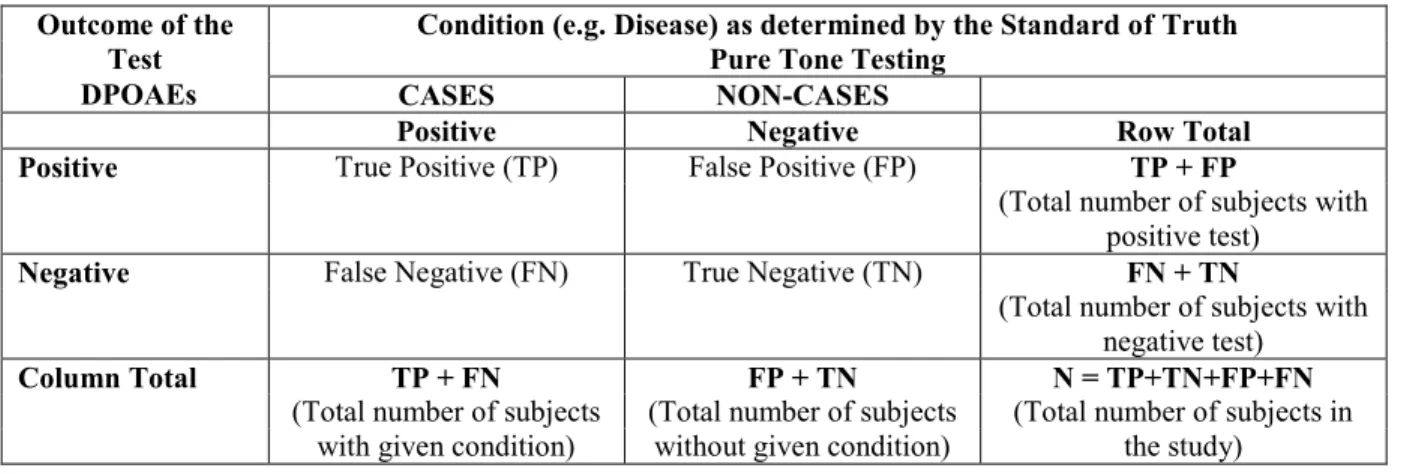
Sensitivity: The ability of the screening procedure to accurately identify the target population relative to the number of individuals screened who actually have hearing loss (Johnson, 2002). Specificity: The ability of the screening procedure not to identify those who truly do not have the disorder that the screening program is designed to identify (Johnson, 2002).
ABSTRACT
INTRODUCTION
The focus of this study was to determine the feasibility of including Distortion Product Otoacoustic Emissions (DPOAEs) in the annual medical monitoring test battery for the identification of noise-induced hearing loss in a group of workers in a beverage manufacturing industry. The beverage industry and the South African standards and guidelines regarding the annual medical surveillance test battery approach to the prevention and minimization of noise-induced hearing loss are also discussed.
RATIONALE FOR THE STUDY
As a result of these noisy processes, hearing conservation programs are essential for workers in the beverage industry. relies primarily on the use of pure tone audiometry to monitor noise-induced cochlear changes.
AIM AND OBJECTIVES
The chapter provides the rationale for the study and provides a summary of each of the chapters. In addition, an in-depth review of the literature related to the study is presented and discussed.
CONCLUSION
In order to determine possible explanations for the study results, the relevant literature related to any significant findings is reviewed in detail. The following chapters include a theoretical overview of noise and noise-induced hearing loss, a detailed review of the literature, a description of the methodology used in the study, a presentation of the results obtained in the study, and a discussion of relevant findings.
INTRODUCTION
NOISE-INDUCED HEARING LOSS
If swelling occurs, the hair cells may rotate, changing the orientation of the steriocilia relative to the tectorial membrane. The critical level for impulse noise is likely related to the duration of the impact and the spectral components, resulting in the most damaging effects at 3000 Hz (Tambs et al., 2006).
NON-AUDITORY EFFECTS OF NOISE
All of the participants in the study believed that working in noise had little impact on their work performance due to the repetitive nature of their tasks. However, many of the participants felt that working in noise poses a safety risk and that stress, fatigue and communication problems are exacerbated by noise.
GUIDELINES AND STANDARDS FOR THE PREVENTION OF NOISE-INDUCED HEARING LOSS
An important aspect in the diagnosis of NIHL is a review of the pure tone audiogram pattern (Rabinowitz et al., 2006). This indicates significantly more damage to the basal end of the cochlea in the inner ear.
CONCLUSION
Pure tone testing is therefore subjective in that it requires full patient cooperation and is influenced by learning effects (Attias et al., 2001). Recent literature suggests the use of DPOAEs to alleviate the limitations of previous testing procedures (Bockstael, et al., 2008; . Duvdevany & Furst, 2007).
INTRODUCTION
OTOACOUSTIC EMISSIONS
This suggests that DPOAEs may be more sensitive to changes in the cochlea when performed in a group of employees in the beverage industry. In addition, these workers may also have reduced amplitudes in the high-frequency range of the DP-gram.
DISTORTION PRODUCT OTOACOUSTIC EMISSIONS
DPOAE in the diagnosis and screening of NIHL and to compare its characteristics with pure tone audiometry. These factors highlighted by Clark (2005) and Wagner et al. 2008) have implications for the repeatability of DPOAEs in the present study.
CONCLUSION
The purpose of the discussion was to share recent research findings on the implementation of OAEs in the early identification of NIHL and the current work on developing standardized terminology and test methods for OAEs in a health surveillance setting. The present study therefore aims to determine the feasibility of including DPOAEs in the annual medical surveillance test battery for the identification of NIHL in a group of employees in the beverage manufacturing industry.
INTRODUCTION
OBJECTIVES
Repeated measurement designs involve at least three consecutive observations on the participants of the study and there are no established criteria regarding the period between measurements (Stommel & Wills, 2004). The first advantage is that this type of design aims to reduce random error by reducing individual differences, thereby increasing the internal validity of the study.
STUDY POPULATION
Participants with a family history of hearing loss were excluded from the study as a genetic basis accounts for approximately half of the cases of hearing impairment worldwide (Sheth & McHugh, 2007). 4.5.1.2.2 Medical history Participants who presented with any of the endogenous or exogenous audiological disorders were excluded from the study. The participants in the study consisted of employees regularly exposed to occupational noise and working within demarcated noise zones.
SAMPLING METHOD
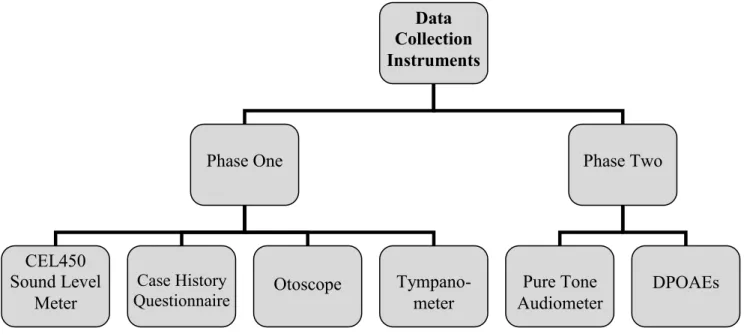
- Noise Measurements
- Case History Questionnaire (Pre-selection tool) .1 Instrument
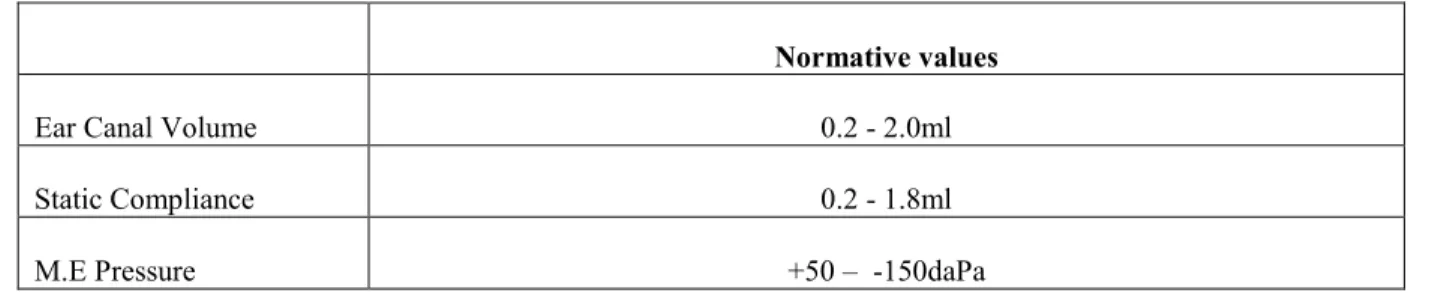
- Tympanometry
- Pure tone air conduction audiometry
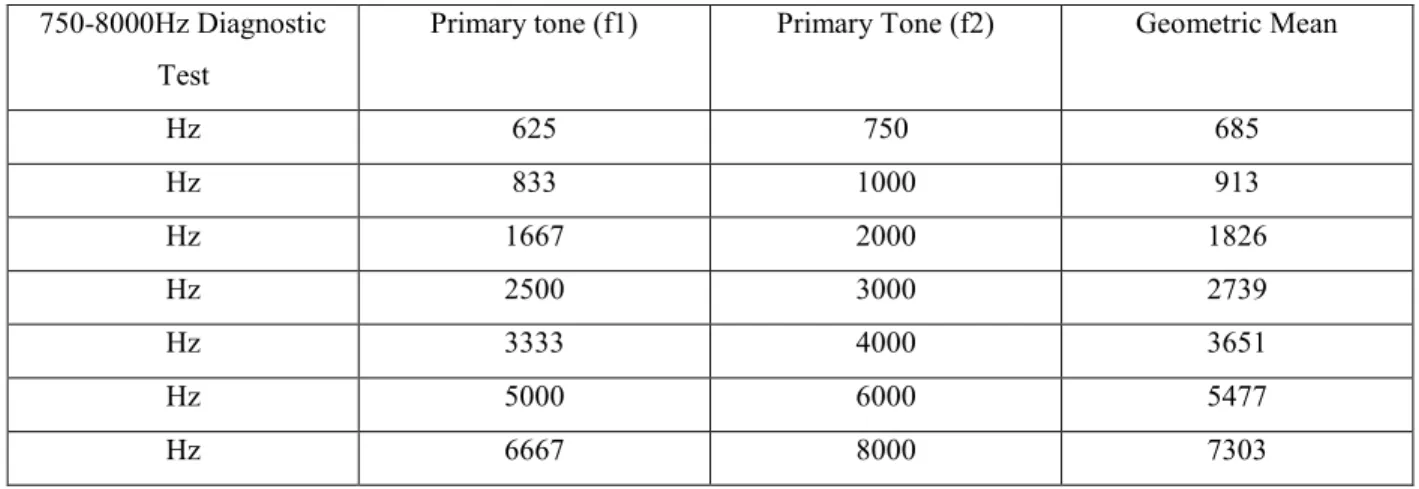
- Distortion product otoacoustic emissions (DPOAE) testing
These employees were invited to participate in the study as part of the company's annual health surveillance program. Then, a stratified sample approach was used to accomplish the second aim of the study (McBurney & White, 2007). The purpose of the case history questionnaire was to ensure that all participants met the study sample selection criteria.
PILOT STUDY
The results of the pilot study revealed that additional noise in the clinic contributed to overall environmental noise, e.g. The results of the pilot study are also used to determine a more accurate estimate for the sample size of the main study (Carter, 2010). With the help of a trained statistician, the pilot study results were analyzed according to objective one and two of the main study.
DATA COLLECTION PROCEDURE
Participants were given information sheets to further enhance their knowledge of the study (Refer to Appendix N & O). Additionally, the nurse practitioner was notified of the findings and the participants were then monitored through the company's existing hearing conservation program. Data were analyzed with the help of a trained statistician according to each study objective.
ANALYSIS
All calculations were performed using SPSS and a statistical significance level of p<0.05 in data analysis. The results of these comparisons will be discussed in the results section of the study (Refer to page 78). This was to ensure that all participants understood the audiological assessment testing procedures.
CONCLUSION
If any of the participants required additional audiological management, the occupational hygienist/nurse was informed of the results and the participants were then monitored via the company's existing management protocol. If pathological conditions were detected during evaluation procedures, participants were referred to the appropriate professional for further treatment (ie, general practitioner or ear, nose and throat specialist). Furthermore, the occupational nurse was notified of the results and the participants were subsequently monitored via the company's existing management protocol.
INTRODUCTION
OBJECTIVE ONE
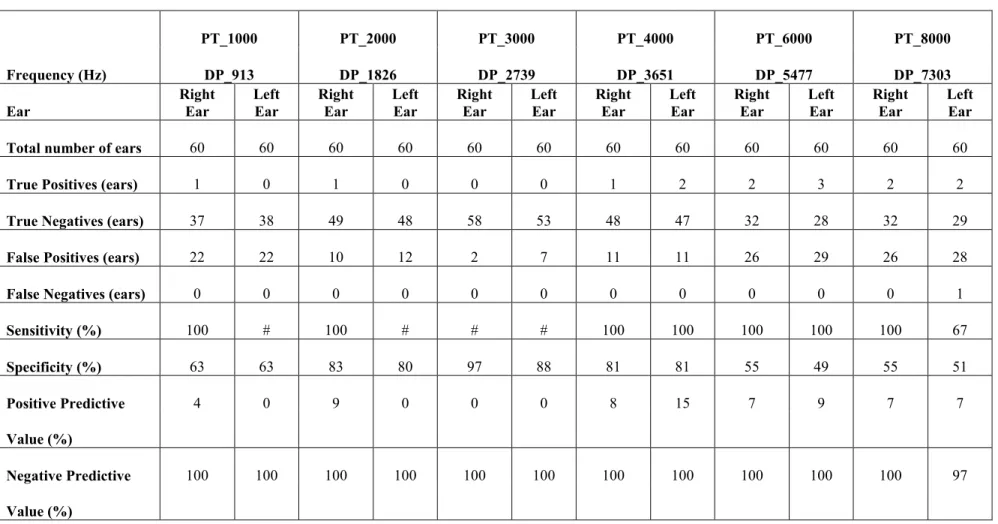
The negative predictive value of DPOAEs was calculated to be 100% across the entire frequency range bilaterally, except at 7303Hz in the left ear, where it was observed to be 97%. In the present study, a negative predictive value of 100% was obtained bilaterally in the entire frequency range except at 7303 Hz in the left ear. The low positive predictive value in the current study suggests that DPOAEs should probably be interpreted with caution when a positive test result is obtained.
OBJECTIVE TWO
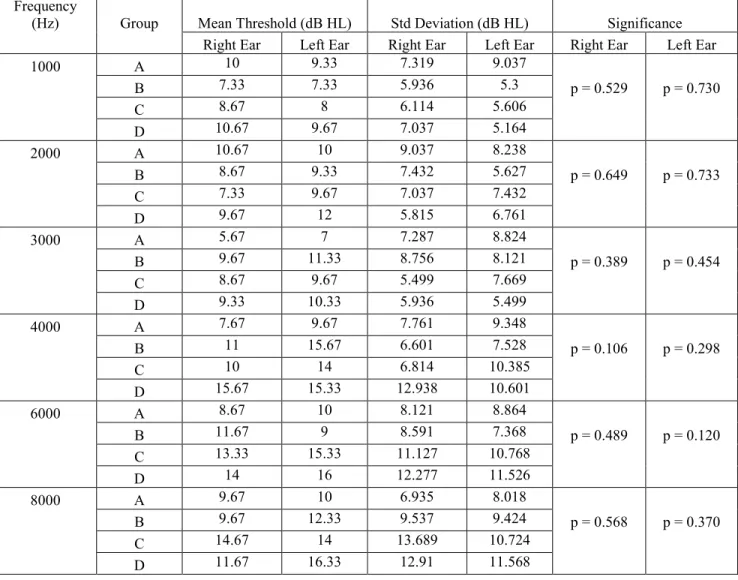
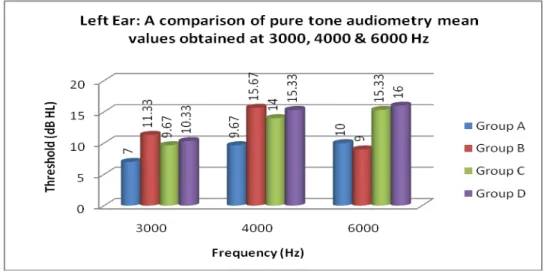
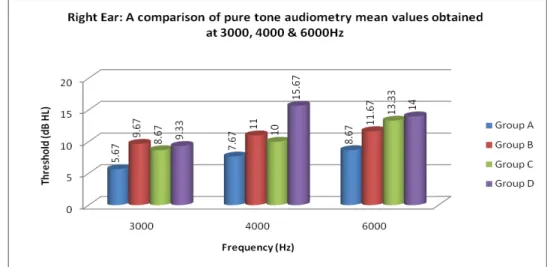
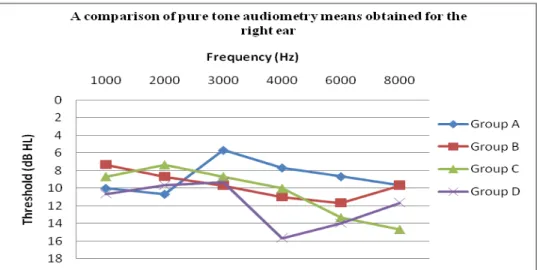
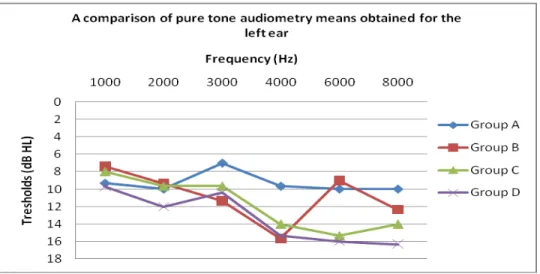
However, there appear to be no notable differences in the high-frequency pure tone audiometry thresholds for air conduction of group A bilaterally. In the current study, visual inspection of the right ear means that Group C pure-tone air conduction thresholds decreased at 6000 Hz and 8000 Hz in the absence of a noise break. However, visual inspection of the mean pure-tone audiometry thresholds in the current study revealed that 1–3 kHz bilaterally was unaffected by occupational noise exposure.
OBJECTIVE THREE
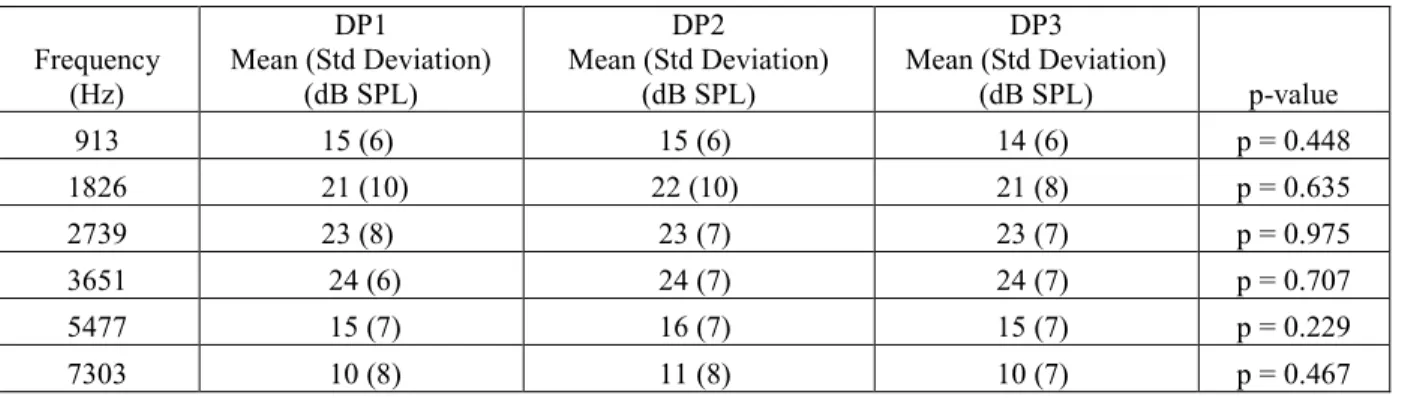
The results presented in Table 5.4 and Table 5.5 above revealed that Group A mean DPOAE amplitude (DP-NF) for all three tests were within the normal range of >6dB SPL across the frequency range 913Hz – 7303Hz bilaterally (Biologic Systems Corp., 2001). The results shown in Table 5.6 and Table 5.7 above revealed that group B mean DPOAE amplitude (DP-NF) for all three tests were within the normal range of >6dB SPL across the frequency range 913Hz – 7303Hz bilaterally (Biologic Systems Corp., 2001). The results shown in Table 5.8 and Table 5.9 above revealed that Group C mean DPOAE amplitude (DP-NF) for all three tests was within the normal range of >6dB SPL across the frequency range 913Hz – 7303Hz bilaterally (Biologic Systems Corp., 2001).
CONCLUSION
Being a quick test to administer increases the possibility of including DPOAE in the annual medical surveillance test battery. A good test-retest reliability obtained across the frequency range in the present study further suggests the feasibility of including DPOAEs in the annual medical surveillance test battery. It is clear that it may be possible to include DPOAE as part of the annual medical surveillance test battery for the early identification of noise-induced cochlear changes for a group of workers in the beverage industry.
INTRODUCTION
CONCLUSION
Pure tone audiometry is considered the gold standard in the identification of noise-induced hearing loss. Otoacoustic emission test for early identification of noise-induced hearing loss in South African miners. Early identification of noise-induced hearing loss: A pilot study of the use of distortion product otoacoustic emissions as an adjunct to screening audiometry in the mining industry.
UNIVERSITY OF
INYUVESI
In addition, the personal details and periodic audiometric screening results of all participants will be stored in a locked cabinet on the University of KwaZulu-Natal (Westville Campus) premises. The results of all audiological testing procedures will be carefully explained to each participant, using visual aids, i.e. Full clearance will be granted pending a letter from the company where I will be doing data collection.
APPENDIX C
APPENDIX D
COI:JSTIC SERVICES CC
TE OF CALIBRA TTON
Conduction: The built-in Y,-Oelav.,/Octave meter corresponded .. measurement uncertainty was reduced according to Ihc principles laid down in GUY. Please: note that these spo:<.:ificd SAl\S slJe"ilicalions. u..,hnicaJ and prescriptive content. are pflXisdy inclined to be the same as all IRe S~cificali.:)I1s mentioned. Please: nute to thcSC' sp:<.:ificd SAI\S sp.:ciJications. I<:o;hnical wwl pn'scripti\'e content'!. is presd)' same: as ahovcmemioncd IRC SpecificHliol1~.
APPENDIX E
Have you been hospitalized or received long-term treatment for any medical or surgical condition? Do you participate in any hobbies or sports that involve exposure to very loud sounds? The researcher wishes to inform you that the information you have provided will be reviewed and selected individuals will be required to undergo a full audiological evaluation.
APPENDIX F
This certificate is issued in accordance with the conditions Mr calibration of the instrument as described by the manufacturer or the South African Bureau of Standards (SANS. The accuracy will subsequently depend on factors such as the care exercised in the handling and use of the instrument and the frequency of use. Tile certification of the calibration is valid for a period of one year (subject to the expectations given in SANS. While every effort is made to ensure that this certificate is accurate, Slanyer Electrosarve cc or its employees in no way l)e liable for any errors, whether in fact or opinion.
APPENDIXJ
Your participation in this research study is voluntary and there is no obligation to participate. Panday at the Department of Audiology, University of KwaZulu-Natal, if you have any questions regarding the research study. If you agree to participate in this research study, you will be asked to sign this document as evidence of your agreement to participate.
APPENDIX M
APPENDIX N
APPENDIX O
APPENDIX P
APPENDIX Q
6 UNIVERSITY OF
YAKWAZULU-NATALI
![Development of noise induced hearing loss prediction model using Levenberg Marquardt / Siti Fairus Mohd Zain … [et al.]](data:image/gif;base64,R0lGODlhAQABAIAAAP///wAAACH5BAEAAAAALAAAAAABAAEAAAICRAEAOw==)