General Introduction
Objectives
The main goal is to improve the properties of the Nafion membrane so that it can be used in transportation or automotive applications and in portable electronic devices. With the introduction of this evolutionary technology in PEM fuel cells, these energy sources can be used efficiently.
Thesis Overview
The effect of different CNT content on the thermal and mechanical properties of Nafion is studied and discussed in this chapter. In this chapter, we studied the influence of different MMT loadings on the properties of Nafion.
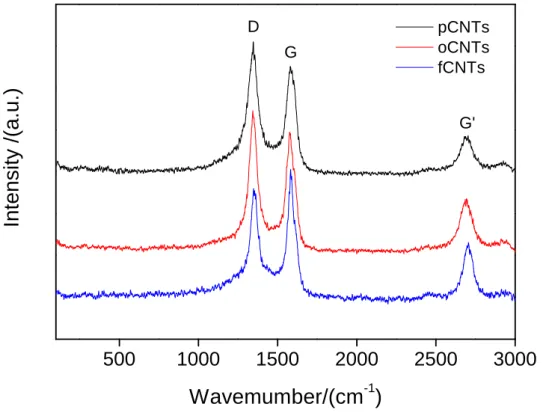
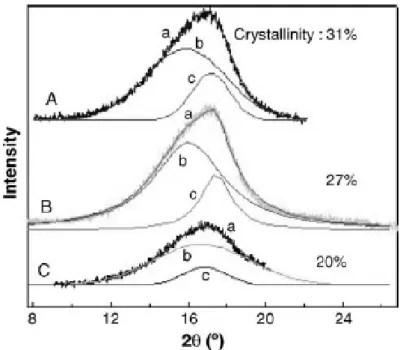
Peaks appearing around 1580-2800 cm-1 correspond to the characteristic E1g and E2g or tangential modes of the graphite sheet.[25] Relationship between. The peaks at around 16° (100) and 40° (101) are attributed to the crystalline perfluorinated backbone (–CF2–. CF2–) in Nafion.[11] The peaks from anatase and rutile phase of TNTs are dominant in the nanocomposite membranes.
Recent Progress on Nafion-based Nanocomposite Membranes for
Fuel Cells
- Alkaline Fuel Cells (AFCs)
- Phosphoric Acid Fuel Cells (PAFCs)
- Molten Carbonate Fuel Cells (MCFCs)
- Solid Oxide Fuel Cells (SOFCs)
- Proton Exchange/Electrolyte Membrane Fuel Cells (PEMFC)
A fuel cell is an electrochemical device that converts the chemical energy of a fuel into electrical energy.[2, 5, 6] Fuel cells can be classified based on the type of electrolyte used and are of five main types.[7, 8] ]. The hydrogen fuel cell uses H2 gas as fuel and provides excellent fuel cell performance and efficiency.
![Figure 2.1 A schematic diagram of methanol PEM fuel cell. Reproduced from Ref. [9] with permission from John Wiley & Sons.](https://thumb-ap.123doks.com/thumbv2/pubpdfnet/10384884.0/35.892.150.691.392.931/figure-schematic-diagram-methanol-reproduced-permission-john-wiley.webp)
Chemistry and Synthesis of Nafion
On the other hand, this proposed copolymer was believed to be significantly different from all other TFE copolymers that had been made before, as it has the ability to interact with the environment instead of just resisting harsh chemical or thermal environments. The copolymer, which became known as Nafion, lacked the properties then believed to be desirable in a fluorocarbon polymer.
Preparation and Characterization of Nafion-based Nanocomposite
- Clay-containing Nafion-based Composite Membranes
- CNTs Containing Nafion Composite Membranes
- Silica Containing Nafion Composite Membranes
- Various Nanoparticles Containing Nafion Composite Membranes
- Thermal Stability
- Methanol Permeability
- Proton Conductivity
- Water Uptake/Hydration
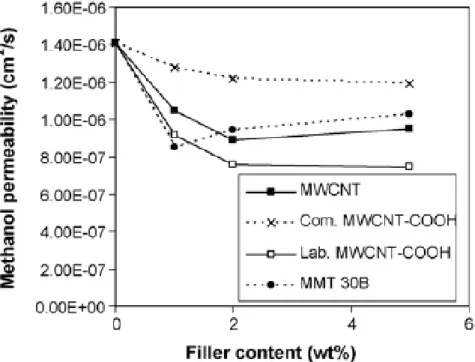
The results showed that the methanol permeability was reduced even as the proton conductivity of the composite membrane decreased. This may be due to the increased aggregation of the tubes in the Nafion matrix.
Fuel Cell Efficiency
The theoretical maximum potential of the reaction [Equation (2.15)] corresponds to the free energy (ΔG) at 25°C and the atmospheric pressure is 1.229 v. When a load is connected to the fuel cell, the cell potential further decreases as more and more power is generated after adding the load. 110] Fuel cell efficiency is directly proportional to cell potential, as shown in equation (2.15), and is therefore also a function of power density.
Conclusion
Jung et al.[20] found, using Nafion 117 and 2.5 M methanol, an increase in the performance of the cell when operating temperatures increased. 60], where a difference in the operating temperature is found to make a significant difference in the cell performance. An increase in temperature led to an increase in the methanol crossover, as previously mentioned.[60] For this reason, other researchers have studied the possibility of vapor feed DMFCs.[112] The fuel cell performance is depicted by current vs.
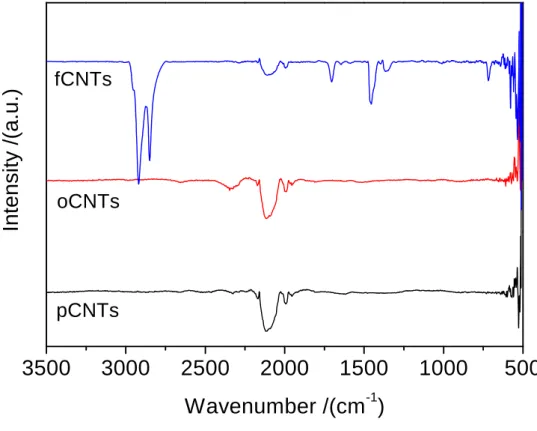
The peaks centered around 2900–2600 cm–1 are contributed by N-H stretching vibrations.[23] The broad peaks at around 1650–1590 cm–1 are attributed to NH deformation of the amine group.[24] This confirms that the amino groups were grafted into the CNTs. The second stage of decomposition (300–430 °C) is related to the desulfonation of the sulfonic acid groups of Nafion.[22, 24] The third stage (430–550 °C) is related to the decomposition of the polytetrafluoroethylene (PTFE) backbone. 22–26] The degradation profiles for all samples are similar. The system produces a shear flow and the largest separation forces on the nanoparticles when they are oriented at an angle of 45 degrees.[1–2] The magnitude of the force trying to separate the agglomerated particles is given in Appendix A4.
Experimental Methods
Materials
- Carbon Nanotubes (CNTs)
- Layered Silicates
- Titanium Dioxide (TiO2) Nanotubes (TNTs)
The most commonly used layered silicate to improve the Nafion membrane properties is montmorillonite (MMT). MMT has been used to improve the properties of Nafion membranes for direct methanol fuel cell applications. TiO2 is used as a filler in Nafion membranes and the photo-corrosion resistance property is expected to improve Nafion's mechanical stability at high temperatures.
Preparation of Polymer Nanocomposites Membranes
- Solvent Casting Method
- Melt–Blending Method
This method is used for the production of engineering plastics, optical films, medical films and skin forming for electronic applications. In this study, this method was used using a mixture of Nafion in low aliphatic alcohol and water with required amounts of desired nanofillers. This method is commonly used in industry as it provides a good dispersion and repeatability output.[21] In this study, this method was used to disperse fillers such as CNTs, MMTs and TNTs in the Nafion matrix.
Characterization Techniques
- Fourier Transforms Infrared (FTIR) spectroscopy
- Raman Spectroscopy
- Setup of Raman
- Brunauer Emmett and Teller (BET) Surface Area Determination
- Thermogravimetric Analysis (TGA)
- Dynamic Mechanical Analysis (DMA)
- Electron Microscopy
- Scanning Electron Microscopy
- Transmission Electron Microscopy (TEM)
- Atomic Force Microscopy (AFM)
- X–ray Diffraction
- Wide Angle X-ray Diffraction (WAXRD)
- Small Angle X-ray Scattering (SAXS)
- Electrochemical Impedance Spectroscopy (EIS)
The complex module consists of a storage module E' (real part) and a loss module E” (imaginary part). Contact mode is only used for special applications such as force curve measurements.[32] AFM is used to image and manipulate atoms and structures on various surfaces. The interaction of the incident rays with the sample causes constructive interference (and beam deflection) when the conditions correspond to Bragg's law (nλ=2d sin θ).
Water/Methanol Uptake
The proton conductance of fuel cell membranes is generally measured using a galvanostatic four-point probe AC EIS technique, which is relatively so insensitive to the contact impedance that it could be sufficient to accurately test membranes with high conductivity. An electrochemical conductivity cell is used. The electrochemical cell was connected to an Auto lab model 4.90006 potentiostat and frequency response analyzer (FRA) using a two-point probe technique.
Methanol Permeability Measurement
Electrical Conductivity Measurements
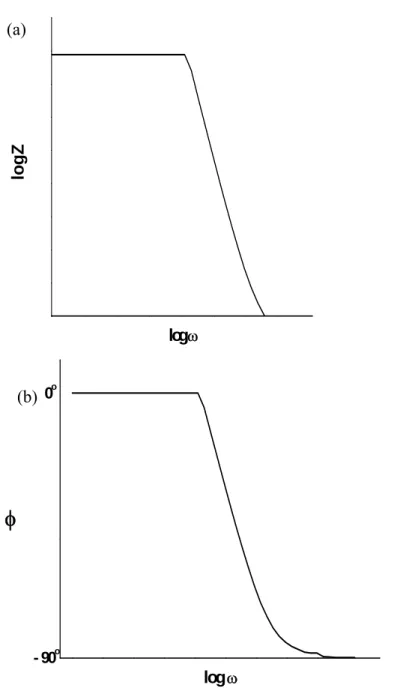
However, polymer membranes that can be operated at elevated temperatures of around 120°C can benefit from increasing carbon monoxide (CO) tolerance.[7-8] The main barrier to operating a PEM fuel cell at that temperature is maintaining proton conductivity. . of the membrane.[6–9] Higher temperatures increase the water vapor pressure required to hold a given amount of water in the membrane, thereby increasing the possibility of water loss and significantly reducing proton conductivity. This is attributed to the loss of SO2 and CO2 gases due to Nafion degradation.[23] The final decomposition step between 350–500°C is attributed to the further loss of SO2, CO2 and the release of SF4, CO, CF and CF2 from the Nafion backbone.[24] It is observed that the weight loss associated with Nafion backbone is moderate for nanocomposite compared to Nafion resin. If the slope (Z vs. ω) = –1, it means that the material has ideal capacitor behavior and if < –1 the material has pseudocapacitive behavior.
Modification of MultiWalled Carbon Nanotube Surface for
Experimental Procedure
- Materials
- Oxidation of CNTs
- Functionalization of CNTs with Hexadecylamine
- Characterization Techniques
The FT-IR measurements were performed on a Perkin-Elmer Paragon 1000 Fourier transform infrared spectrometer at room temperature (25°C). TGA was performed on a TGA Q500 (TA Instruments) at a heating rate of 10°C/min under oxygen from room temperature to 800°C. The conductivity of the films was measured at room temperature by pressing the probe on the surface of CNTs.
Results and Discussions
- FT-IR
- Raman
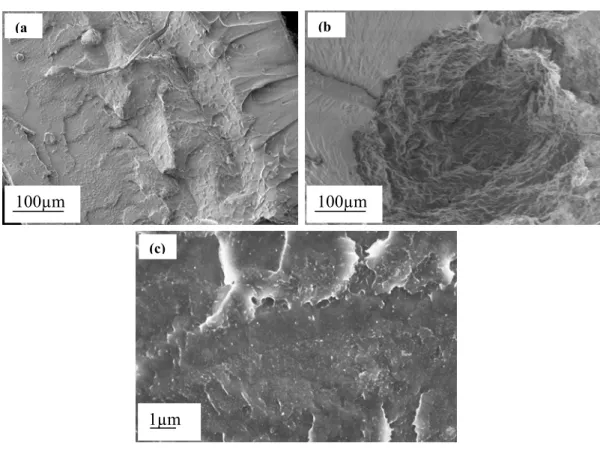
- Morphology
- X-ray Diffraction
- Thermal Stability
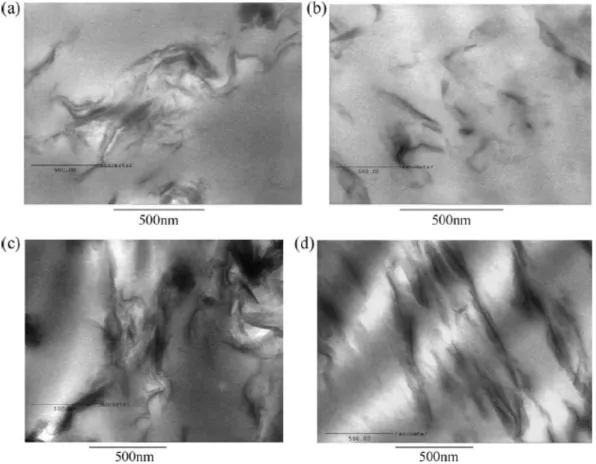
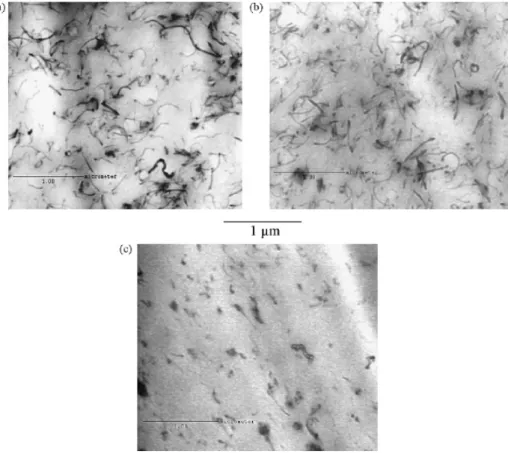
This can be attributed to the electrostatic attraction between the tubes in the presence of amine groups. TEM imaging of the sample (see Figure 4.3) reveals the presence of hollow CNTs with a catalyst (iron) at the tips of the tubes. This difference in the intensity of the (002) peak can be explained by the alignment or orientation of the tube with respect to the incident and scattered beams, the incident beam and the symmetry axis between them.
Conclusion
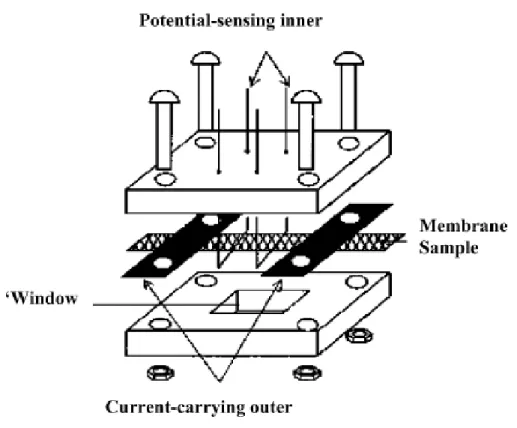
This is due to the thermal condensation reaction between clustered tubes and Nafion. This feature is also observed with N-1 wt% pCNTs, but is not prominent. The cell geometry was chosen based on previously reported experiments to ensure that the membrane resistance dominates the response of the system. The four-point conductivity cell was made of two perplexed blocks, with an area of 5x5 cm2 and an open groove on the top, to keep the membranes fully hydrated. This suggests that the interlayer spacing between the TNTs has increased, possibly due to polymer intercalation. This also indicates electrostatic interaction forces between polymer and inorganic filler.
Effect of MultiWalled Carbon Nanotubes loading on the
Characterization and Property Measurements
The bulk DC resistance of various membranes was measured at room temperature using the four-point collinear probe method. The resistance of the Nafion membrane is assumed to be given by the high-frequency extrapolation of the Nyquist plot to the real axis (Z′). At the lowest frequency values, the impedance changes are dominated by the frequency response of the electrode-membrane interface.
Results and Discussions
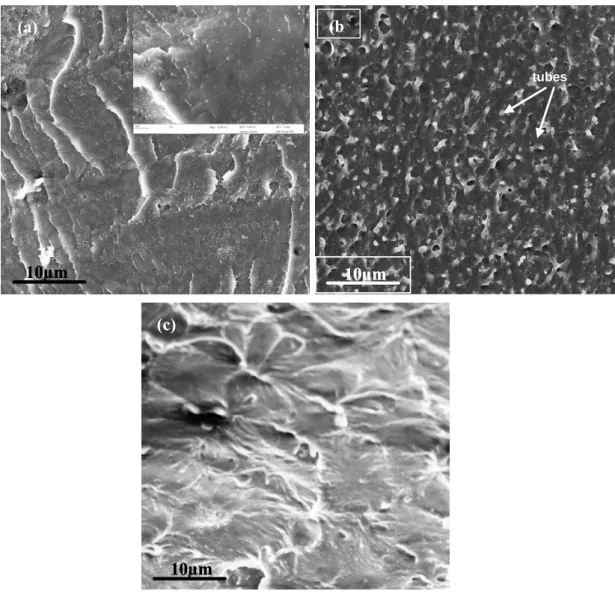
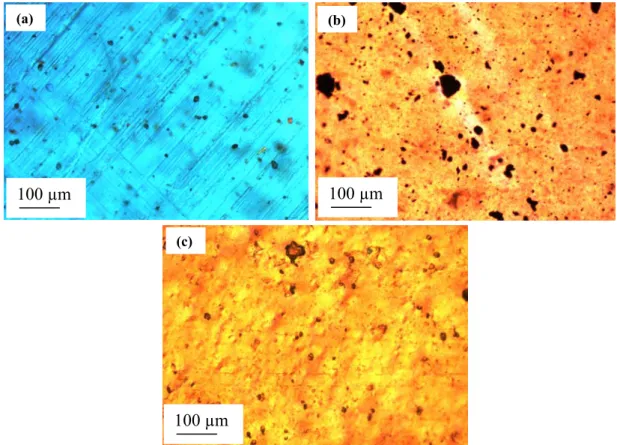
- Morphology
- Electrical Conductivity and Water Uptake of the Membranes
- Thermal Properties
- Dynamic Mechanical Measurements
- Electrochemical Impedance Spectroscopy Measurements
In Figure 5.7 b, the water uptake and electrical conductivity of Nafion increase with an incorporation of 0.2 wt% oCNT. The higher electrical conductivity is also due to the higher content of tubes in a polymer composition. The poor thermal stability of N-0.5 wt% pCNT nanocomposites is attributed to the poor dispersion of CNTs within a polymer observed by SEM.
Conclusion
This is due to the high degree of compatibility between the outer surfaces of the oCNT and the Nafion matrix. The first peak (30°C) is attributed to the transitions between SO2 and CF groups of Nafion. The intensity of the peaks is also reduced, and this is attributed to the interaction of TNTs with CF2-CF groups of Nafion and reduced crystallinity.
Carbon Nanotube-based Nafion Composite Membranes for Fuel
Experimental Procedure
- Membrane Preparation
- Characterization and Property Measurements
Nafion composite membranes were prepared by melt mixing the Nafion precursor with CNTs at 250°C in a Reomix OS instrument (HAAKE), with a rotor speed of 60 rpm for 10 m. The dried composite fibers were then converted into 0.12–0.2 mm thick sheets by pressing at 2 MPa pressure at 250°C for 5 m. AC impedance measurements of regular composite membranes containing Nafion and CNTs were performed on films about 0.1–0.3 mm thick at 26°C and 100% relative humidity.
Results and Discussion
- Studies on CNTs and Composites Morphology
- Thermogravimetric Analysis
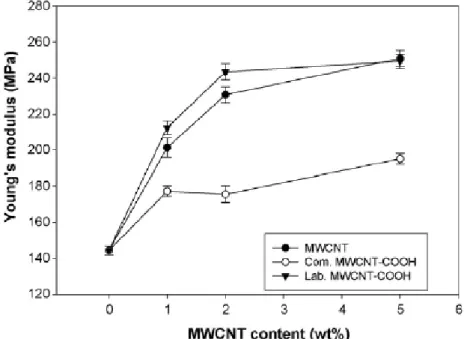
- Mechanical Properties
- Bulk DC Electrical Resistivity Measurements
- Proton Conductivity
However, the temperature corresponding to the initial thermal decomposition (ton) and the mass loss slope (wt%) are different for different composite membranes. The experimental data were fitted with R1(C[R2W]) equivalent circuits for pure Nafion resin, N-pCNT and N-oCNT composite membranes, while the N-fCNT composite membrane was equipped with R1(R2C) circuit. The poor dispersion of fCNTs in the Nafion matrix also contributes to the very low ionic conductivity of the composite membrane containing N-fCNTs.
Conclusion
The electrical conductivity of Nafion and its TNT-based nanocomposite membranes is shown in Figure 8.7. The thermal stability of SO3H groups of Nafion increases with N-0.5 and N-2.0 wt% of TNT composite. The proton conductivity of Nafion increases slightly at 0.5 wt% TNTs and then decreases with further increase in the amount of TNTs.
Low Methanol Permeable Nafion-Organically Modified
Experimental Details
- Membrane Preparation
The permeability of methanol through the membrane can be expressed by the diffusion coefficient, P (cm2.s–1) using equation 7.1.[15].
Results and Discussions
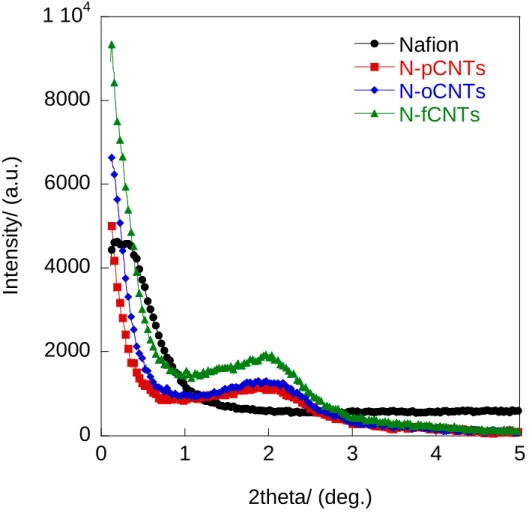
- X-ray Diffraction
- Thermal Stability
- Mechanical Properties
- Electrical Conductivity and Water Uptake of the Membranes
- Proton Conductivity and Methanol Permeability
This suggests that side chains of Nafion resin may be involved in the interactions with C30B. The thermal stability of Nafion resin and its C30B-containing nanocomposite films was investigated by TGA. However, when C30B is incorporated into the Nafion matrix, the Tg of Nafion matrix shifts to the higher temperature range.
Conclusion
It can be seen from Table 7.3 that a decrease in proton conductivity is small compared to a decrease in methanol permeability.
The resistance of TNTs in the presence of H2 is likely to improve the swelling and mechanical properties of Nafion membranes at higher temperatures above 100 °C. The increase in water uptake with the addition of TNTs suggests an increase in the hydrophilic nature of Nafion. The thermal stability of the PTFE backbone in Nafion increases from approx. 400 to approx. 450°C after dispersing with CNTs.
Nafion-Titania Nanotubes Nanocomposite Electrolytes for High
Experimental
- Membrane Preparation
Results and Discussions
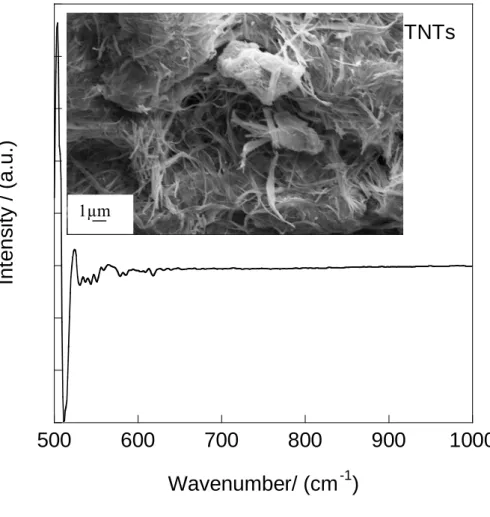
- Structure, Morphology and Thermal Stability of Titania Nanotubes
- Structural Properties of Nanocomposite Membranes
- Morphology
- Water Uptake and Electrical Conductivity
- Thermal Stability
- Proton Conductivity and Methanol Permeability
To study the interaction between sulfonic acid groups of Nafion and TNTs, composite films were characterized with FT-IR. In this case, it indicates the electrostatic interaction between the polar polymeric groups of Nafion (acid groups and carbonyl functions) and negatively charged titania nanotubes. This decrease is associated with the electrical percolation threshold of Nafion and also the weak interaction between Nafion and TNTs as observed in FTIR spectra for 2 wt.%.
Conclusion
The improved results are attributed to the benefits, such as clean forces, involved during processing. This improved thermomechanical property is attributed to the good dispersion of CNTs in Nafion matrix observed by SEM. This is due to the low chain mobility of the C30B layers and the lower molecular weight compared to Nafion.
General Conclusions
Appendices A1 through A5 describe some of the polymer concepts, conversions, characterizations, and material properties covered in this study. When the particles are oriented at 45 degrees, the magnitude of the forces trying to separate the agglomerate is given by:
Schematic grafting: (a) neat–MWCNT by carboxylic acid, and futher (b)
![Figure 1.1 Distribution of South African power plants by fuel type based on 2004 annual production [2]](https://thumb-ap.123doks.com/thumbv2/pubpdfnet/10384884.0/25.892.147.764.247.606/figure-distribution-south-african-power-plants-annual-production.webp)
![Figure 3.5 Illustration of possible signals generated when a high beam interacts with a thin specimen [27]](https://thumb-ap.123doks.com/thumbv2/pubpdfnet/10384884.0/93.892.191.646.192.532/figure-illustration-possible-signals-generated-high-interacts-specimen.webp)