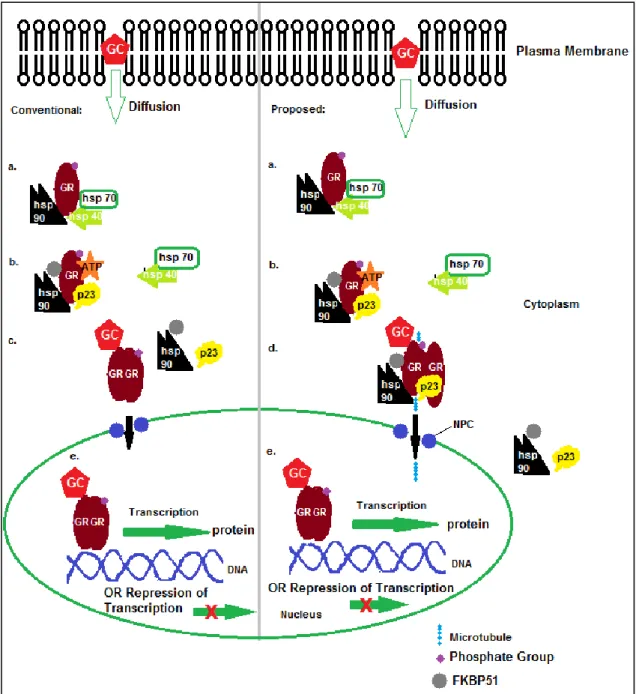
CRH – Corticotrophin-releasing hormone, ACTH – Adrenocorticotropin hormone, GC – Glucocorticoid hormone (Constructed by author).4 Figure 1.2: Signaling pathway of transcriptional activity of glucocorticoid receptors (GR);. TF: transcription factor..11 Figure 1.5: GR protein domains (Adapted from Nicolaides et al., 2010) NTD – N terminal domain, DBD – DNA binding domain, HR-Hinge region, LBD – Ligand binding domain.
Lung Cancer
2 Lung cancer is considered the final stage of a multistep process of carcinogenesis (Hirsch et al., 2001; Panani and Roussos, 2006). NSCLC consists of squamous cell carcinoma, adenocarcinoma, large cell carcinoma and bronchoalveolar carcinomas (Panani and Roussos, 2006; Alberg et al., 2007).
Small Cell Lung Cancer (SCLC) 1. Characteristics and Prognosis
Ectopic Secretion of Adrenocorticotropin Hormone (ACTH)
The POMC protein undergoes proteolytic cleavage to produce ACTH, β-endorphin, β-lipotropin, and other peptides (Munck et al., 1984). Fifty percent of patients show aberrant production of ACTH leading to elevated cortisol levels (Ray et al.
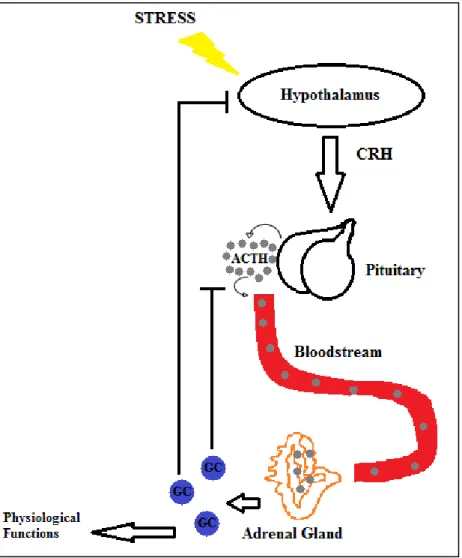
Hypothalamus-Pituitary-Adrenal Axis
The adrenal cortex synthesizes mineralocorticoids and GCs in response to both activities (Munck et al., 1984). GCs mediate their functions in various tissues by binding to a ubiquitous cytoplasmic and nuclear receptor known as the glucocorticoid receptor (GR) (Munck et al., 1984; O'Connor et.
Glucocorticoid Receptor 1 GC Activation of the GR
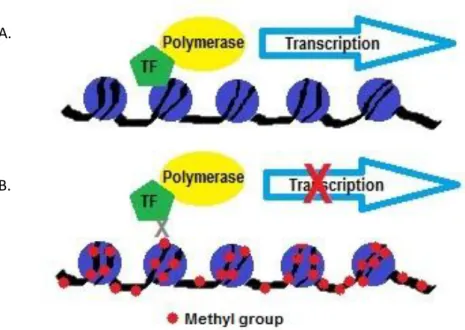
- CpG Islands
- Methylation
- Domains of the Glucocorticoid Receptor
- N-terminal Domain (NTD)
- DNA Binding Domain (DBD)
- Intrinsic Pathway
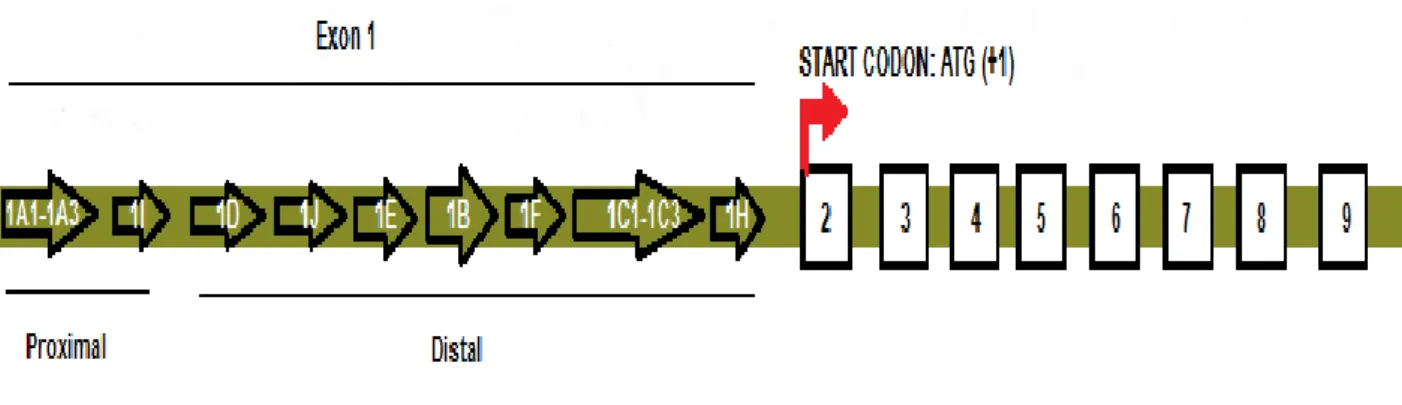
The first exon is believed to be responsible for the differential expression of the GR protein (Turner et al., 2010). Hsp90 plays a central role in complex formation and is bound to the LBD of GR (Schaaf and Cidlowski, 2003; Nicolaides et al., 2010).
Re-expression of Glucocorticoid Receptor in SCLC 1. Exogenous expression of GR
The GR gene has been shown to be silenced by methylation, where treatment with a DNMT inhibitor resulted in re-expression of GR (Kay et al., 2011). The aim of this study is to determine which promoter is responsible for the re-expression of the GR that leads to apoptosis.
Cell Culture
De-methylation Treatment
Preparation of 5-Aza-2’-deoxycytidine
The working solution was prepared by a 1:100 dilution of 5-Aza in the respective medium, i.e. 1 μl of 5-Aza stock was added to 99 μl of medium.
Treatment with 5-Aza
RNA Extraction
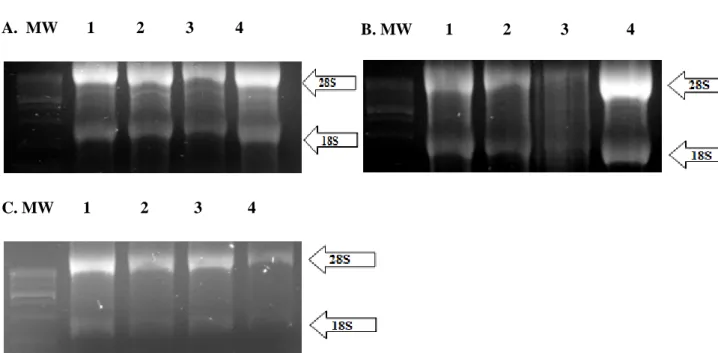
RNA Electrophoresis
In a fume hood, 10 ml of 10x MOPS buffer (Appendix B.6) (Sigma) and 18 ml of formaldehyde (Merck) were added to the agarose solution before the gel was poured into the mold. The gel was imaged using a ChemiDoc XRS+ imaging system (Bio-Rad) and Image Lab software package (Bio-Rad).
Tetro cDNA Synthesis Kit
Two micrograms of RNA, 1 μl of Oligo(dT)18 primer (uses the poly-A tail principle), and 1 μl of 10 mM dNTP mixture were added to the tube. The reaction premix was added to the tubes after incubation and mixed gently by pipetting.
Conventional PCR
Four microliters of 5x RT buffer, 1 μl of Ribosafe RNase inhibitor, 1 μl of Tetro reverse transcriptase (200 units/μl), and 4 μl of DEPC-treated water were used per premix. A 1% agarose gel was used where 1g TopVision™ agarose (Fermentas) was dissolved in 100 ml 1 x TBE buffer (Appendix B.9).
Mapping of CpG Islands in Exon 1
To identify the promoters present in HEK, A549 and DMS79 cell lines, agarose gel electrophoresis was used to visualize the PCR products. The agarose gel was run for one and a half hours at 80V with a Bio-Rad Powerpac. An O'GeneRuler™ DNA ladder mix molecular marker (Fermentas) was used to deduce the size of the bands.
Real Time Quantitative PCR (qPCR)
The 2 -ΔΔCt Method of qPCR and Statistical Analysis
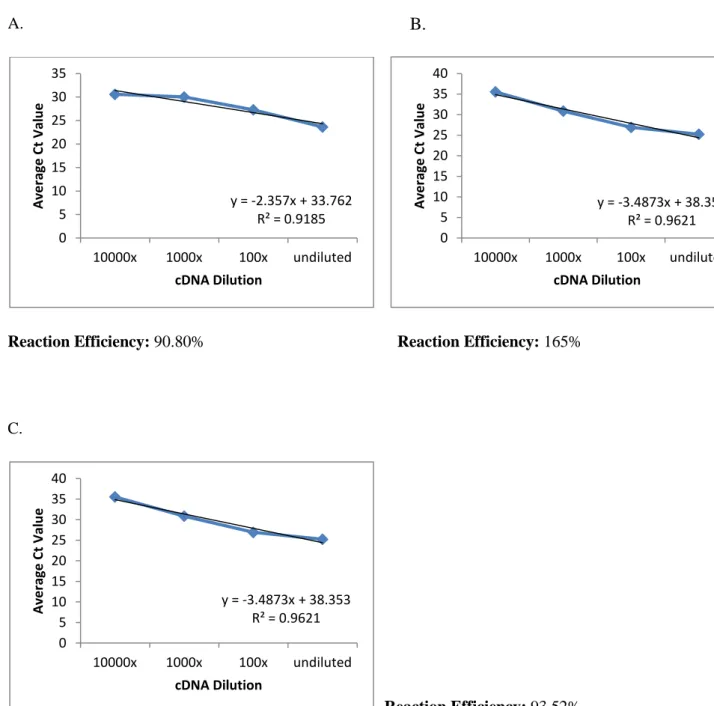
Validation of the use of the 2-∆∆Ct method was performed in accordance with MIQE guidelines. The efficiency of the reaction of each set of primers was quantified by analyzing the Ct value of the cDNA dilution series. The parameters for the reaction efficiency were met, so it was possible to perform a data comparison (Appendix A.6.1).
Glucocorticoid Receptor and Mutant Glucocorticoid Receptor Constructs 1. Plasmid Elution
Transformation of Competent Cells
Subcloning efficiency competent™ DH5α™ cells (Invitrogen) were thawed on ice and a 1.5 ml microcentrifuge tube was placed on ice to cool. Thawed competent cells were gently mixed with a pipette tip and 50 μl of cells were transferred to the chilled microcentrifuge tube. The tube was incubated on ice for 30 minutes and heat shocked for 20 seconds at 42oC in an MRC dry bath incubator (Polychem Supplies Ltd.).
Purification of Plasmids 1. Growth of Bacterial Colonies
- Digestion of Purified Plasmid DNA
- Midi-prep of Plasmid
Ten nanograms of plasmid DNA was added to the cells and mixed with a pipette tip. 250 μl Buffer P2 was added and mixed thoroughly by inverting the tube between four to six times. Eight milliliters of Buffer P2 was added to the tube and vigorously inverted between four to six times to create a blue solution.
Microscopy
A confluent 10 cm dish of 7x10⁶ HEK cells was cultured, trypsinized and transferred into a 1.5 ml microcentrifuge tube. Thirty microliters of the suspended cells were pipetted onto the cover slips and 1 ml of medium was added to each well. Three microliters of XtremeGENE was added to the DNA complex and gently mixed by tapping the tube.
Retrovirus Construction
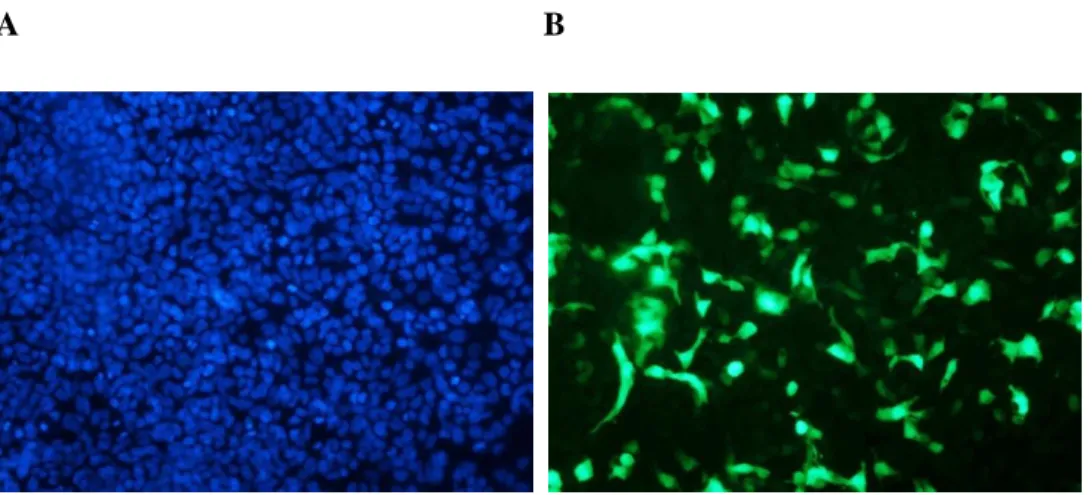
31 Slides were analyzed using a Nikon Eclipse 80i fluorescent microscope using the FITC range filter for eYFP and UV filter for DAPI staining of nuclei.
Retroviral Infection 1. Adherent Cell Lines
Five of the T25 flasks were spin-infected with one of the five retroviral supernatants (pFUNC1-eYFP, pFUNC1-GR-eYFP, pFUNC1-GRA458T-eYFP, pFUNC1-GRΔAF1-eYFP or pFUNC1-GRC736S-eYFP). The supernatant was removed and the pellet of cells was resuspended in retroviral supernatant. After spin infection, the supernatant was discarded and the pellet of cells was resuspended in 1 ml of RPMI 1640 medium.
Spin-infection Efficiency
To increase infection efficiency, hexadimethrin bromide was added to each centrifuge tube to a final concentration of 8μg/ml.
Apoptosis Induction
Microscopic Analysis of Apoptosis and Cell Death
The tubes were centrifuged and the pellet resuspended in 50 μl of a 1:50 dilution of DAPI. The tubes were centrifuged at 1000 x g for 5 min and the cell pellets were washed with 1 x PBS. The cells were centrifuged and the supernatant discarded and the pellet resuspended in at least 1x PBS.
Statistical Analysis
Evaluation of RNA extraction
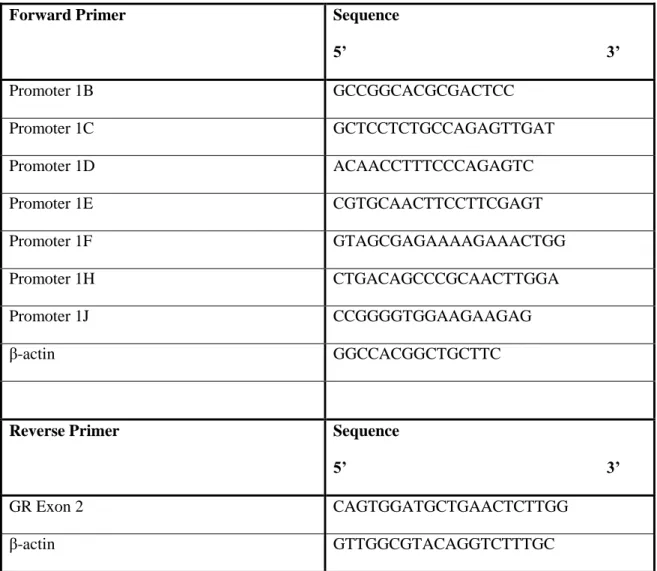
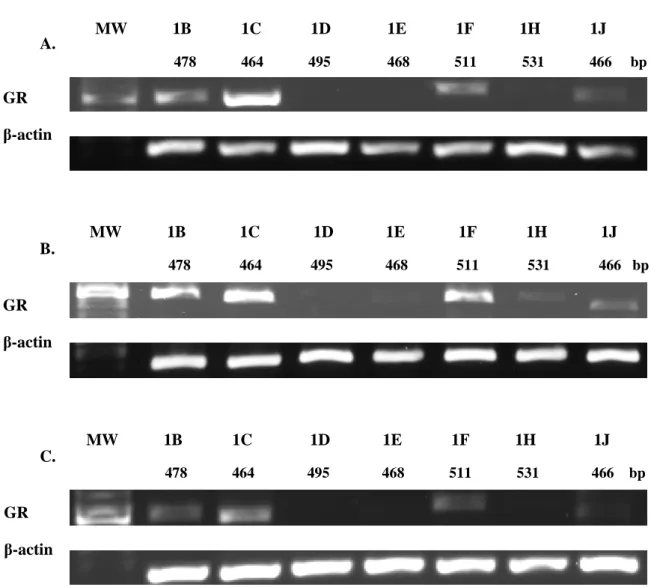
To identify which GR promoters are used by A549, HEK, and DMS79 cells, conventional PCR was performed using primers for promoters 1B–1J. DMS79 cells had high levels of promoters 1B and 1C present, while promoters 1F and 1J were present at low levels. Before qPCR analyses, the presence of CpG islands within or near promoters 1B and 1C was determined by bioinformatic analysis.
CpG Island Identification
In HEK cells, promoters 1B, 1C, and 1F were present at high levels, while 1E, 1H, and 1J were expressed at low levels. As promoters 1B and 1C were frequently transcribed in all three cell lines, these promoters were determined to be suitable target genes for qPCR analyses. Relative expression level of promoter 1B and 1C in A549, DMS79 and HEK cell lines after 5-aza treatment.
Relative level of Promoter 1B and 1C expression in A549, DMS79 and HEK cell lines after 5-aza treatment
39 Figure 3.4: Relative promoter 1B and 1C expression in A549 cells treated with varying concentrations of 5-aza and control cells with mean ± standard error (n=6; Promoter 1B and 1C expression: p>0.05). Cells treated with 1 μmol/l 5-aza showed a slight increase in promoter 1B expression, but this expression was not statistically significant (F = 2.882; p>0.05). Treatment of DMS79 cells with all concentrations of 5-aza appeared to increase the level of promoter 1B and 1C transcripts.
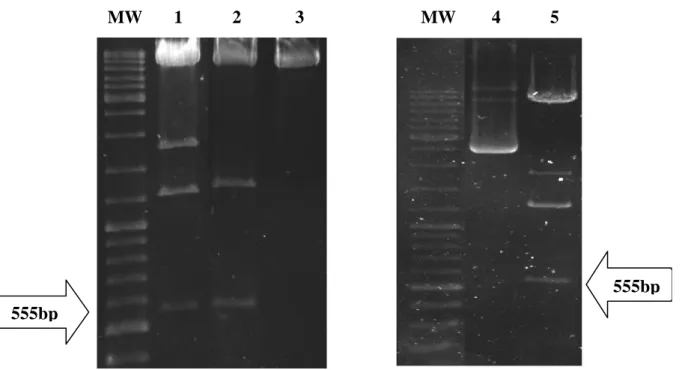
Digestion of Plasmids
Digestion with BglII would yield a 555bp fragment that was representative of the AF1 transactivation domain of the GR gene. Plasmid constructs of pFUNC1-GRC736S-eYFP, pFUNC1-GRA458T-eYFP and pFUNC1-GR-eYFP had the 555bp fragment encoding the AF1 region of the NTD. For these plasmids there are three BglII restriction sites creating three possible combinations of BglII restriction sites for digestion of the plasmid DNA.
Transfection of HEK cells
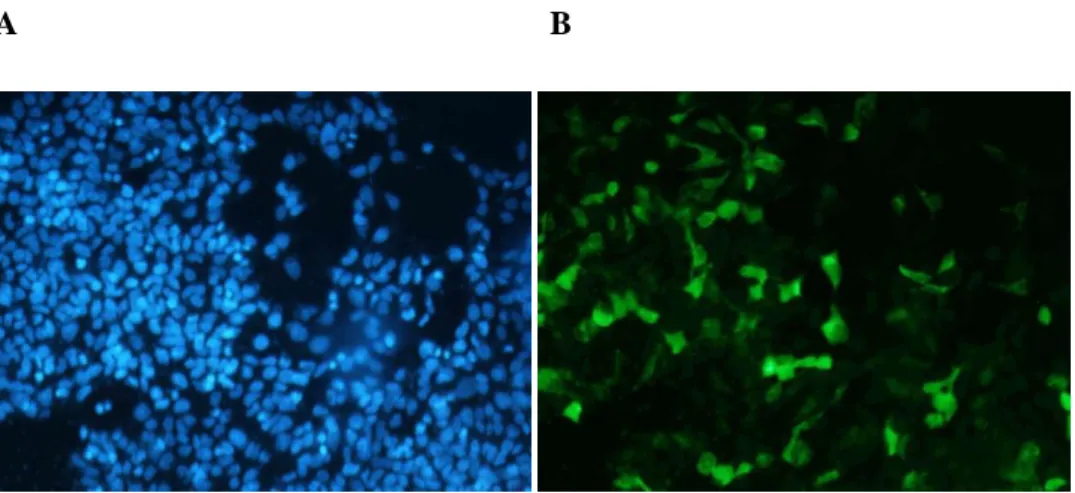
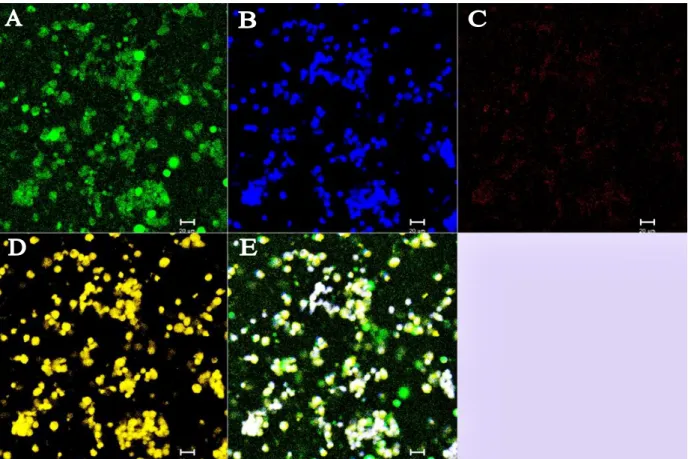
Nuclei stained with DAPI can be seen in A, while expression of pFUNC1-GR-eYFP can be seen in B. The overall fluorescence is lower than that of the eYFP alone (Figure 3.8), as the pFUNC1-GR-eYFP has a large fusion protein. Again, all cells expressed pFUNC1-GR-eYFP, as evidenced by the eYFP fluorescence (original images are provided on the accompanying CD).
Retroviral Infection
In Figure 3.8, the nuclei of all cells in the field are stained with DAPI dye (A). eYFP fluorescence is shown in B, where highly eYFP-expressing cells are seen. This is not particularly clear in the printed figure 3.8, therefore the original images are provided on the attached CD. Transfection efficiency (Figure 3.8) was very high and it was estimated that all cells were transfected.
Spin-infection Efficiency
DMS79 cells spin-infected with retroviral constructs had minimal expression of eYFP compared to the control (Table 3.1). The best infection efficiency was observed in HEK cells infected with pFUNC1-eYFP (54%) and pFUNC1-GRΔAF1 (130%) (Table 3.1). DMS79 cells spin-infected with pFUNC1-eYFP, pFUNC1-GR-eYFP, pFUNC1-GRA458T-eYFP, and pFUNC1-GRC736S-eYFP retroviral constructs had extremely low spin-infection efficiency, less than 1%.
Microscopic Analysis of Apoptosis and Cell Death
The percentage of Annexin V APC positive cells in pFUNC1-GR-eYFP and pFUNC1-GRA458T-eYFP was statistically significant when compared to the control (Figure 3.13). The low percentage of apoptotic cells pFUNC1- GRC736S-eYFP was statistically significant when compared with pFUNC1-eYFP, pFUNC1- GR-eYFP and pFUNC1-GRA458T-eYFP. Thirty percent of cells expressing the pFUNC1-GR-eYFP virus were apoptotic while cells infected with pFUNC1-GRA458T-eYFP displayed 29% apoptotic cells.
Glucocorticoid Promoter Usage in SCLC cells and Control Cells
Identification of promoters utilised by A549, HEK and DMS79 cells
Methylation occurs when a methyl group is added to a cytosine present in a region of high guanine-cytosine content (CpG islands) (Baylin et al., 2004). These promoter regions harbor CpG islands which have the potential to be methylated (Cao-Lei et al., 2011). A recent study by Kay et al. 2011) has shown that GR in SCLC cells is methylated and treatment with a demethylating agent resulted in GR re-expression.
Relative level of Promoter 1B and 1C expression in A549, DMS79 and HEK cell lines after 5-aza treatment
Nunez and Vedeckis (2002) investigated promoter utilization of promoter 1B and promoter 1C in several cultured human cell lines. The DMS79 cells showed an increase in both promoter 1B and promoter 1C transcripts with increasing 5-aza concentrations (Figure 3.6). This study reported here suggests that promoter 1B may be methylated in regions not identified by Kay et al. 2011) and that promoter 1B and possibly promoter 1C are responsible for GR re-expression after 5-aza treatment.
Spin-infection efficiency of SCLC cells
A study by Sommer and colleagues (2007) showed that overexpression of GR in SCLC cells restored GC sensitivity. This overexpression of GR was shown to induce apoptotic cell death in SCLC cells (Sommer et al., 2007). The addition of the GR ligand, the synthetic GC dexamethasone, did not appear to affect apoptotic cell death.
Microscopic Analysis of Apoptosis and Cell Death
Silencing of the AF1 region resulted in abolition of the induction of the human inhibitor of apoptosis 2 gene (hIAP2) (Rogatsky et al., 2003). Restoration of the GR protein by transfection restored apoptotic activity in cells (Miller et al., 2005). It appears that, due to the loss of the transactivation domain, the GR cannot interact with the p65 subunit (Scheinman et al., 1995).
Appendix
MIQE Guidelines
- Experimental Design
- Sample Information
- Nucleic Acid Extraction
- qPCR primer and target gene information
- qPCR Protocol
- qPCR Validation
- Evaluation of qPCR reaction efficiency
- qPCR Melt Analysis Verification
- Data Analysis
84 Figure 7.1: qPCR protocol used in all qPCR experiments using Bio-Rad CFX Manager Software. Analysis of qPCR data with the 2-ΔΔCt method can only be performed if the reaction efficiency of the target genes is equal to that of the reference gene, β-actin (Livak and Schmittgen, 2001). A melting curve analysis was performed for each qPCR run for each target gene and cDNA sample.
Recipes
- DEPC-treated Water
- Ethidium Bromide Stock Solution
- dNTP stock
- LB Broth
- Preparation of LB Agar Plates
- Glycerol Stock of Plasmids
- Sodium Butyrate Stock Solution
- Hexadimethrine Bromide Stock Solution
- Propidium Iodide
1 ml of stock solution was dissolved in 199 ml of distilled water to create a working solution of 0.05 mg/ml. A 500 mM EDTA stock solution was prepared by dissolving 9.3 g in 50 mL of distilled water at pH 8. Four grams of paraformaldehyde (Merck) was dissolved in 100 mL of distilled water and filter sterilized.