127 Table 4.45: Comparison of the quality of green spaces within selected grassland sites using the eThekwini and Custom typologies. 132 Table 4.48: Comparison of the quality of green spaces within selected shrubland sites using the eThekwini and Adapted typologies.
Preamble
Problem identification
3 Africa It is national rather than local environmental conservation priorities that are often implemented to the greatest extent (Cilliers et al.). This is concerning because contestations over urban green space need to be addressed at a local scale, as it is at this scale that human nature interactions occur (McConnachie et al., 2008; Shwartz et al., 2014).
Motivation for the study
Again, a review of the literature shows that these techniques are very rarely used to create and manage green spaces in rapidly developing cities such as eThekwini (Cilliers et al., 2014). In addition, social geography methods were used to assess residents' perceptions of and interactions with green spaces in the highly industrialized and environmentally contested area of South Durban (SDA) (Sutherland et al., 2009), located within the municipality.
Aim and objectives
To develop a spatial representation of the quality/integrity of selected green spaces within the municipality of eThekwini in relation to land use patterns. What are the factors that influence the quality/integrity of the selected green spaces examined in this study?
Brief summary of methodological approach
Which socio-economic characteristics of residents influence their perception of the value and use of green spaces within the SDA. How does the status of the selected green spaces differ when using the eThekwini and Custom typologies.
Structure of dissertation
6 interrogating secondary spatial data for selected green areas using spatial geography methods enabled an assessment of the adequacy of the typology currently used by eThekwini Municipality to describe the status of green areas.
Conclusion
Introduction
Importance of the environment and conservation
9 Both in practice and research, environmental conservation is often linked to a non-urban context (ie conservation outside cities) (Elander et al., 2005). As far back as the mid-1970s, most European countries began to develop strategies and programs aimed at improving nature conservation in urban areas (Dearborn and Kark, 2010; Rands et al., 2010).
Environmental sustainability
After the transition to democracy in 1994, South Africa, like many other countries in the world, prioritized environmental sustainability as one of the country's central socio-economic and political agendas (Ncube et al., 2009). Initiatives in the country included policies and strategies that sought to promote and support the socio-economic well-being of the people while conserving the country's natural capital (Ncube et al., 2009).
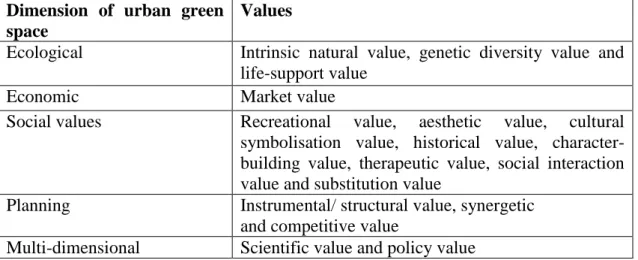
Theoretical framework
Environmentalism
In addition, Davey (2009) claims that environmental awareness is one of the global imperatives needed to achieve ecologically sustainable landscapes, especially in poorer, less developed ones. In the context of this study, it is important to note that the current approach to environmental awareness within South Africa aims to maintain and reduce the susceptibility of urban green spaces in light of the adverse effects of climate change (Roberts et al., 2012).
Ecological modernisation
In South Africa, the use of sustainability ideologies is mainly driven by a global conventional approach to ecological modernization (Oelofse et al., 2006). South Africa has enormous potential to move towards a strong form of ecological modernization as the country offers a 'gap' where new strategies and approaches can be applied to environmental legislation and decision-making (Oelofse et al., 2006).
Political ecology
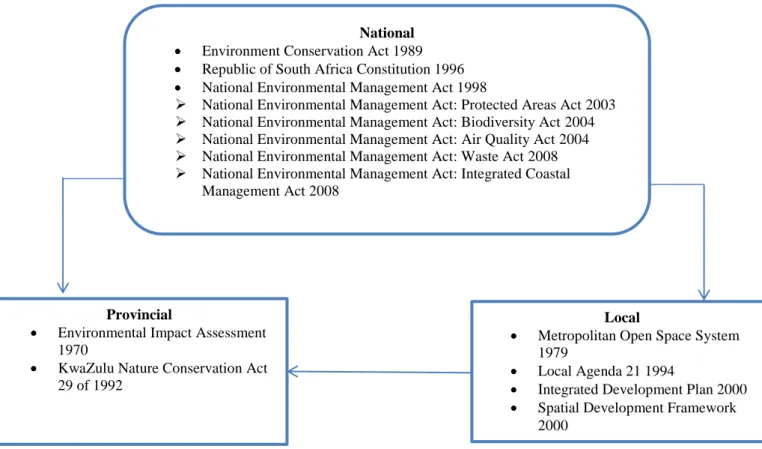
In relation to the present study, it is important to highlight some of the relevant environmental legislation and policies that influence the ways in which open green spaces are planned in South Africa. The Environmental Conservation Act of 1989 was enforced with the dual purpose of protecting and controlling the use of the environment (Van der Linde, 2006).
Urban green spaces
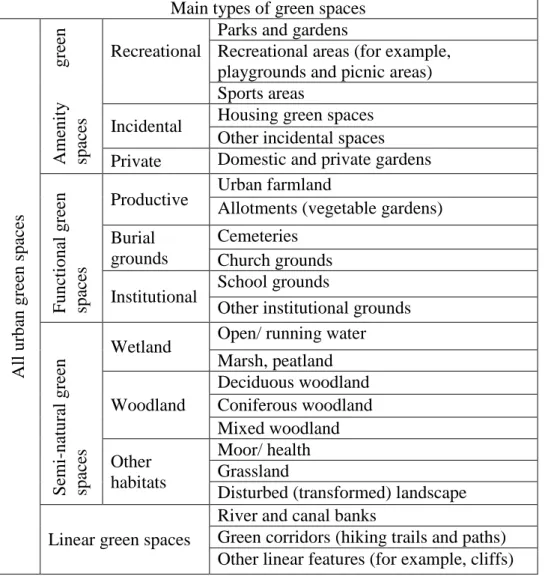
- Urban green space typologies
- Anthropogenic impacts on urban green spaces
- Approaches to urban greening
- Benefits of urban green space
- Ecological
- Social
- Economic
- Challenges associated with urban green spaces
- Human perceptions of urban green spaces
The main ecological value of green areas in the city according to Niemelä et al. In addition, Jadhi and Khanmohamadi (2013) suggested that younger individuals have more energy and spirit, which affects their views and type of activities (often recreational) when interacting with urban green spaces.
Conclusion
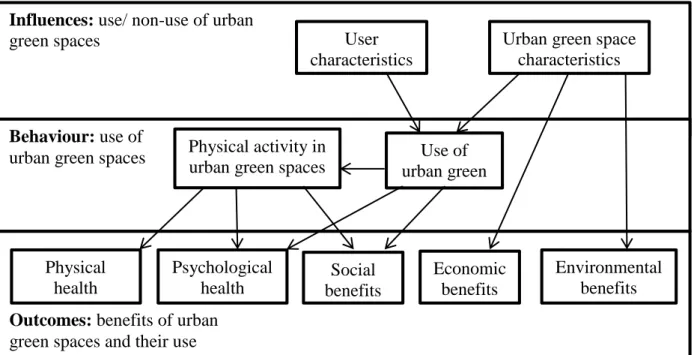
This is important to consider as collective evidence from the field of environmental psychology and landscape planning shows that people's perceptions and behaviors are influential factors in terms of land use patterns and transformations (Balram and Dragićević, 2005; Jim and Chen, 2006). From the perspective of urban planners and managers, it is important to recognize that each individual has different preferences and needs.
Introduction
Background and geographical setting of eThekwini
- Demographics
- Climate
- Biodiversity
- Status of green spaces within the eThekwini Municipality
- Durban Metropolitan Open Space System (D’MOSS)
However, many of the vegetation types found within the municipality are severely threatened due to increasing urban pressures (Ethekwini Municipality, 2007). Based on the data presented in table 3.1 and figure 3.2, artificial habitats occupy most of the green space within the eThekwini Municipality, covering 71.7% of the land, while natural/.
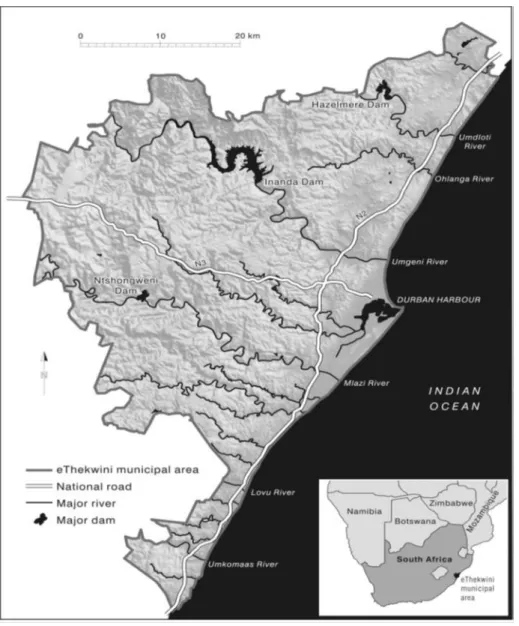
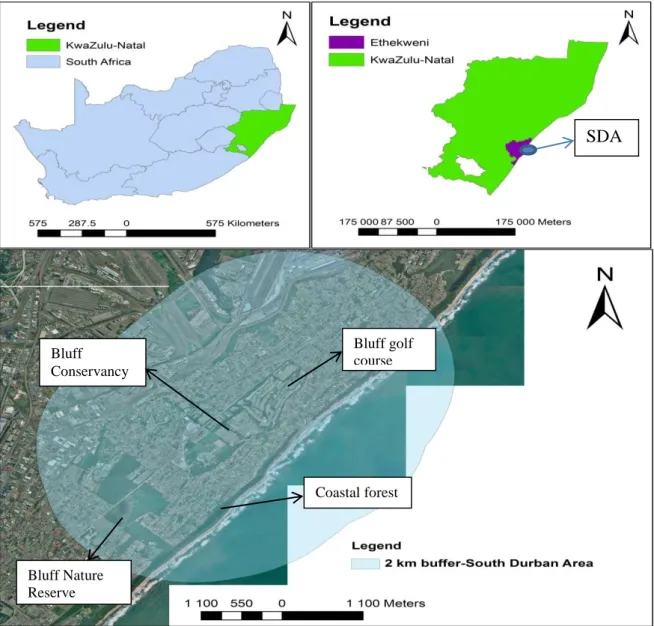
South Durban Area (SDA)
The 48 D'MOSS areas must be thoroughly assessed before any action takes place (Roberts et al., 2012). 49 environmental issues in the area are highly controversial, with residents often expressing concerns about environmental hazards, health impacts and social amenity concerns (Sutherland et al., 2009).
Research design and approach
Data acquisition
Survey data
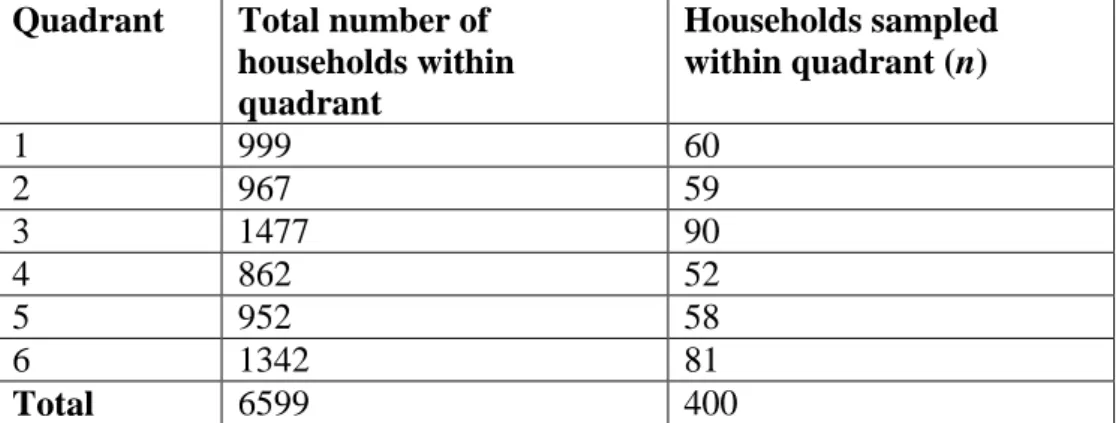
- Sampling framework
- Questionnaire
In light of the above, this study used a questionnaire (Appendix A) to obtain quantitative data regarding residents' use and perceptions of the value of urban green spaces within the SDA. In addition, respondents were also invited to provide their interpretation of a context-based definition of urban green spaces.
Spatial data
The questions focused on issues related to residents' interactions and the value of green spaces within their surroundings. Attributes such as generic and detailed habitat description, D'MOSS status, ecosystem condition, invasive alien plant infestation and open space area within the eThekwini Municipality.
Data analysis and evaluation
Statistical analysis
Spatial analysis
57 Table 3.4: Criteria used to assess the quality of selected types of green spaces as part of the adapted typology. Classification The adapted classification of the ecosystem condition (degraded, good, intermediate or transformed) of the green space area.
Limitations and challenges
Conclusion
59 The overall aim of the spatial analyzes carried out was to assess whether the developed adapted typology could be used to generate a more refined quantitative assessment of the quality of green space.
Introduction
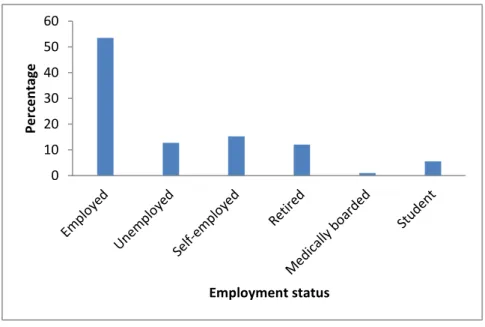
Socio-economic and demographic characteristics of respondents
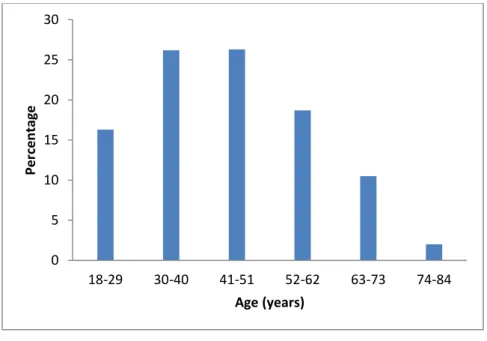
The age profile also shows that most of the respondents (87.50%) interviewed were in the age group of 18-62 years. This indicates that the study population reflected the typical age profile of the eThekwini Municipality.
Respondent uses and perceptions of urban green spaces
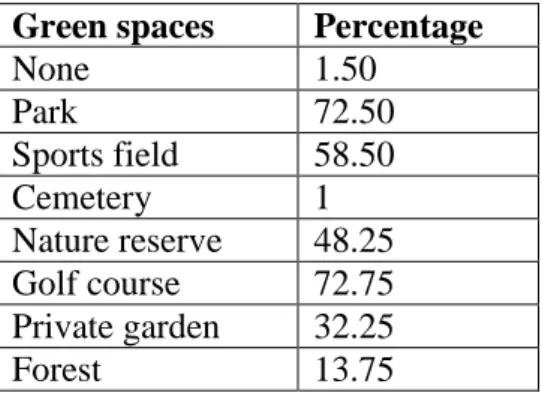
The results show that the majority of respondents would like to have access to ecological (fruit and medicinal plants) and social (recreational spaces and green paths and paths) resources within these green areas. This reinforces Sutherland et al's (2009) claim that there is a lack of green space maintenance within the SDA.
Environmentally-friendly practices of respondents
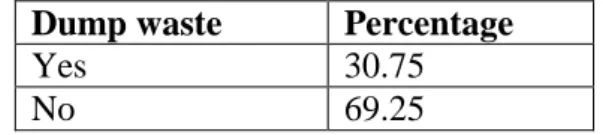
However, the majority of respondents (69.25%) indicated that they do not deposit waste in green areas within the study area. The results showed similar results, with about a third of respondents indicating that they dump waste in green areas within the study area, suggesting that this is also an environmental concern in the area.
Respondents awareness and perceptions of the D’MOSS programme
Settlements
107 Table 4.33: Comparison of the quality of green spaces within selected settlement sites using the eThekwini and Adapted typologies. In summary, the quality of the five settlement green spaces assessed with the eThekwini typology collectively differed by approximately 40% from those assessed with the more discriminating Adapted typology.
Tree crops
113 Table 4.36: Comparison of the quality of green areas within selected tree crop sites using the eThekwini and Adapted typologies. The quality-based area coverage percentages calculated for the five tree crop sites as part of the adapted typology (Table 4.36) must be interpreted in combination with the statistics shown in Table 4.37.
Woodland
118 Table 4.39: Comparison of the quality of green spaces within selected forest areas using eThekwini and the adapted typology. The proof of the above was further confirmed by the adapted typology (Figure 4.10 and Table 4.39), which.
Forest
124 Table 4.42: Comparison of the quality of green spaces within selected forest areas using the eThekwini and Adapted typologies. Furthermore, the use of the Adapted typology resulted in the identification of less degraded land than.
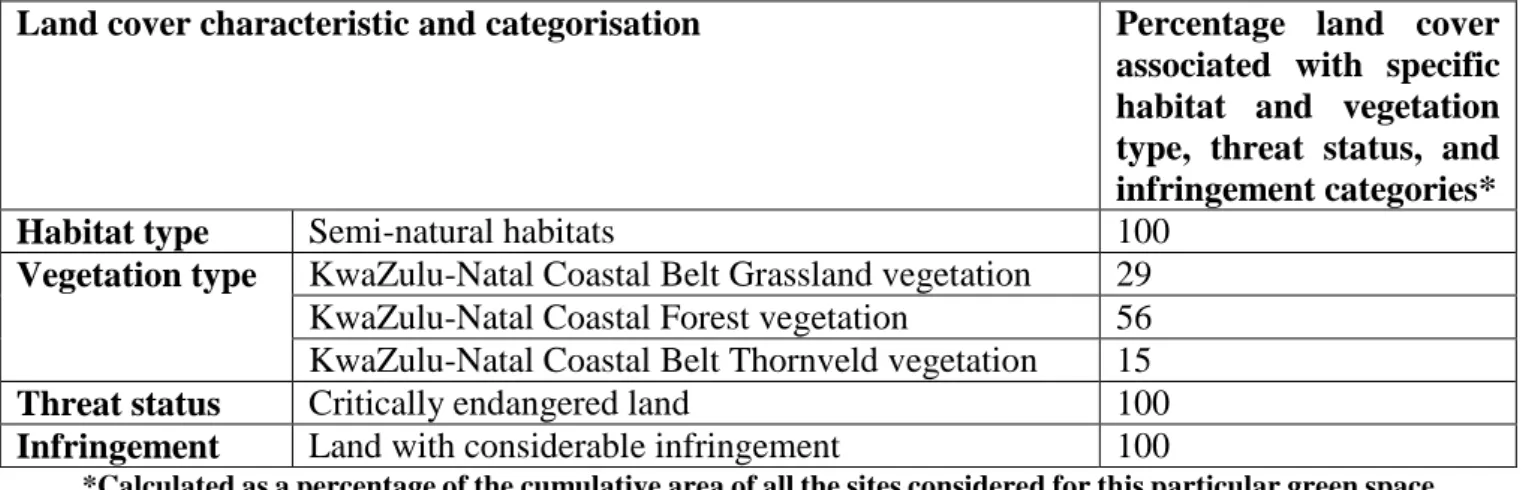
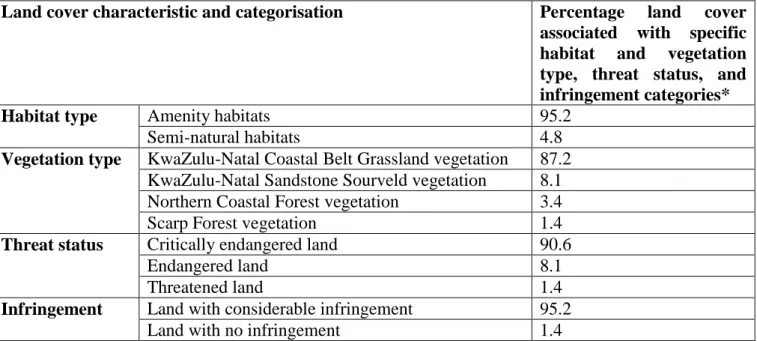
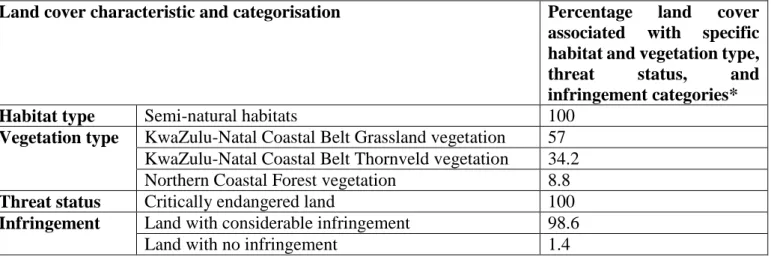
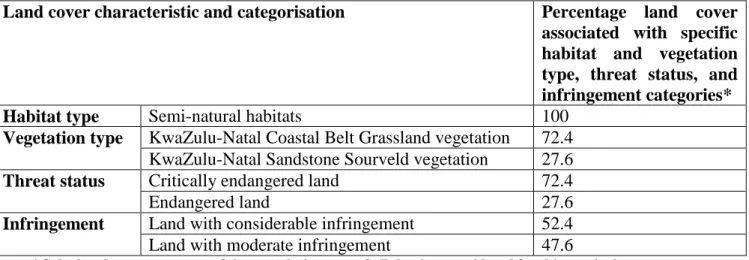
Grassland
129 Table 4.45: Comparison of the quality of green areas within selected grasslands using the eThekwini and Adapted typologies. Using the adapted typology also led to the identification of less good land than that reflected by the eThekwini typology at site 4.
Thicket
134 Table 4.48: Comparison of the quality of green spaces within selected bushland sites using the eThekwini and Adapted typologies. Moreover, the use of the Adapted typology led to the identification of less degraded (sites 1 and 2) and intermediate (site 5) land than reflected by the eThekwini typology; however, additional intermediate microenvironments were identified in two sites (1 and 4).
Summary for the collective spatial assessment of the quality of selected green
138 major green spaces that could be misclassified in terms of their ecological integrity when using the eThekwini typology. Summary for the Joint Spatial Quality Assessment of Selected Green Spaces in the eThekwini Municipality.
Conclusion
139 revealed that the five green space areas assessed using the eThekwini typology deviated by a total of about 60% (the largest cumulative deviation among all green space types analysed) from those assessed using the adapted typology. In addition, the results showed that green areas in close proximity to settlements and industry had higher degradation rates than those located further away and that were more intact.
Introduction
Summary of the results and key research findings in relation to the objectives
To examine social perspectives on the value and use of green spaces within the
- Socio-economic and demographic characteristics of respondents
- Respondent uses and perceptions of urban green spaces
- Environmentally-friendly practices of respondents
- Respondents awareness and perceptions of the D’MOSS programme
The results showed that respondents identified more negative than positive changes to green areas in their local communities. It was also interesting to note that the majority of respondents indicated that they would like to see additional green areas within the study area.
To assess the appropriateness of the typology presently used by the eThekwini
- Settlements
- Tree crops
- Woodland
- Forest
- Grassland
- Thicket
Overall, it was evident that there was minimal difference in land cover between eThekwini and the adapted typology. Deviation indices calculated for the forest areas studied showed that three areas deviated from the eThekwini typology.
Recommendations
Recommendations to increase user benefits of urban green spaces
The fourth recommendation relates to safety issues and the condition (maintenance and facilities) of some green spaces in the eThekwini municipality. This sub-section provides recommendations for the conservation and management of urban green spaces in eThekwini Municipality.
Concluding remarks
Using the ecosystem approach for better planning and conservation of urban green spaces: a case study in Finland. Differential community and perception of urban green spaces and their content in the megacity of Karachi, Pakistan.