Applications of hydrate crystallization
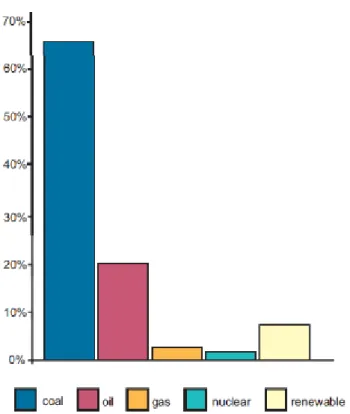
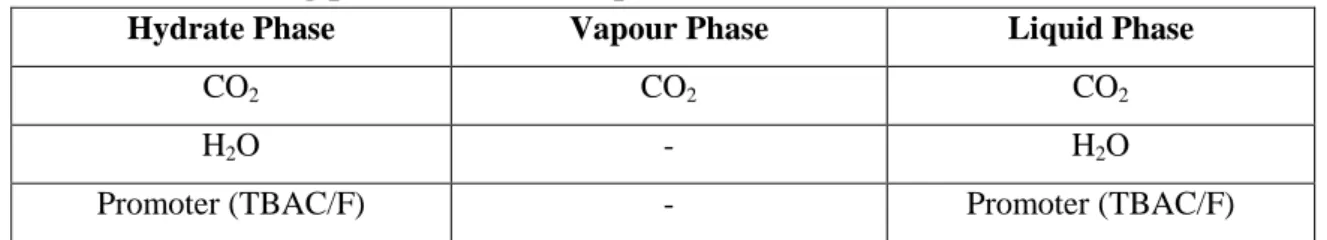
CO 2 capture via hydrate crystallization
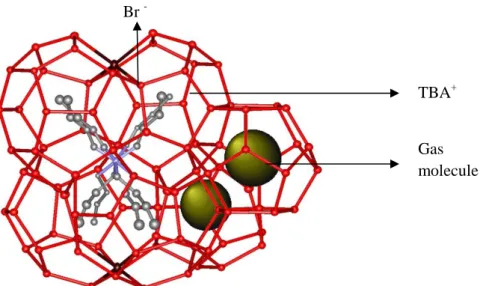
Clathrates and semi-clathrate hydrates
Clathrates containing water molecules as host species are called clathrate hydrates or gas hydrates (Englezos, 1993). This period includes the gas hydrates as a scientific interest, where gas, dissolved in water, was converted into a solid.
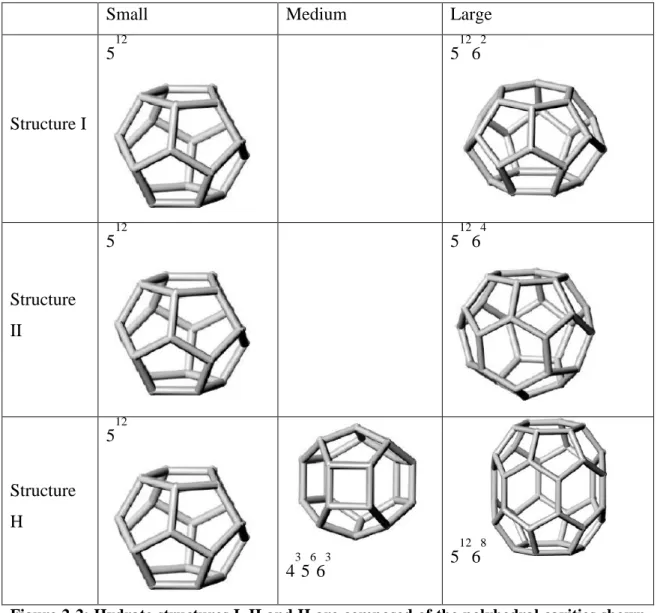
Hydrate structure
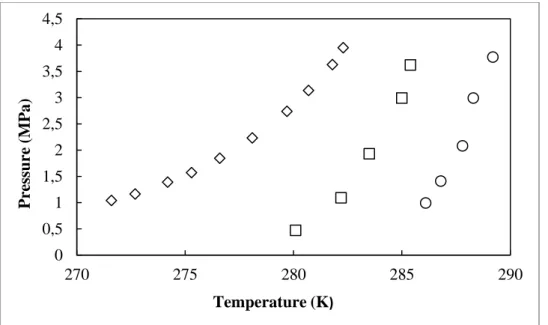
Phase diagrams
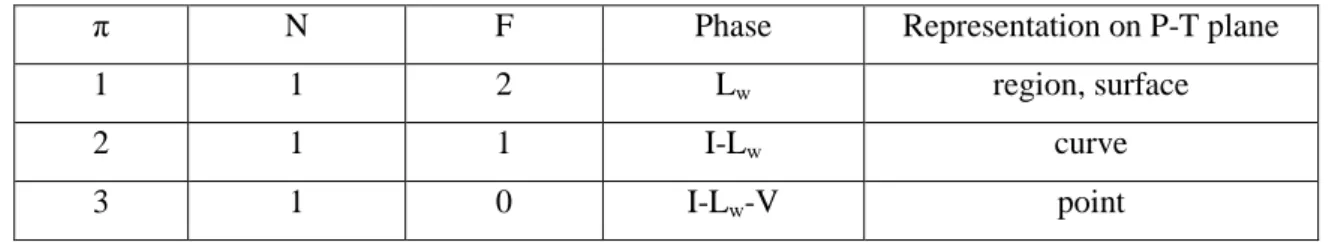
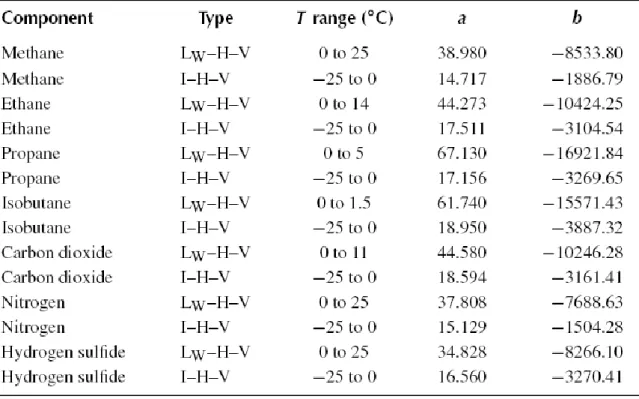
The equilibrium curves of I-V, I-Lw and Lw-V intersect at the triple point I-Lw-V, where the three phases of H2O coexist stably. In a hydrate binary system consisting of H2O and a single hydrate-forming gas, four three-phase curves intersect to form a quadruple point, where the four phases stably coexist.
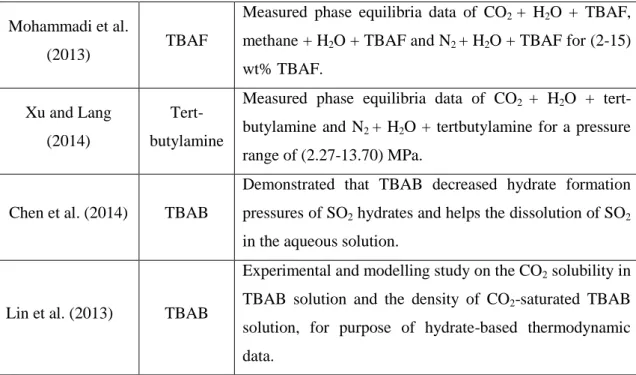
The use of additives as thermodynamic promoters
The rate of hydrate formation is the time required for the completion of the three-step process. Thus, the gas solubility and hydrate formation rate decrease with the progress of the hydrate formation process. The first statistical model that can predict equilibrium data in the hydrate phase was developed by van der Waals and Platteeuw (1959). The model is based on the equality of the chemical potential of the hydrate phase and the liquid phase.
The conditions for hydrate formation are not reproducible as these conditions are device dependent (e.g. the rate of hydrate formation is highly dependent on the degree of stirring). Initially, 10% and 15% (by volume) of the equilibrium cell were filled with a tetrabutylammonium salt solution. The hydrate equilibrium data from TBAC sample 2 was appropriately positioned within the data trend from TBAC sample 2, as shown in Figure 7-5. The experimentally measured phase data in this study have maximum temperature and pressure uncertainties of ±0.30 K and ±1.71 kPa.
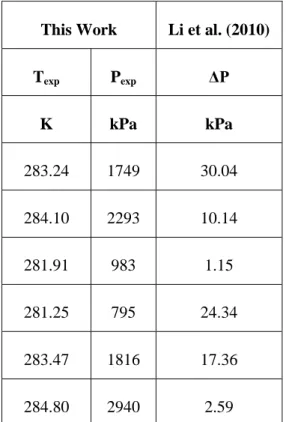
111 The assessment of the hydrate equilibrium phase data of this study against Li et al. A similar approach was used to predict the hydrate phase equilibrium data of the CO2 + H2O + TBAF system. 125 constants for the tetrakaidecahedra cages and pentakaidecahedra cages were calculated using the model of Eslamimanesh (2012). The model takes into account the disturbances in the structures of cavities formed by Cl and F bonds with water molecules and the interactions between large TBAC molecules. /TBAF with each other.
The performance of the model for predicting CO2 semi-clathrate phase equilibrium data was examined. The measurement of the hydrate equilibrium phase data of this study against Li et al.
The effects of promoters on the hydrate formation rate
Review of hydrate phase equilibrium models
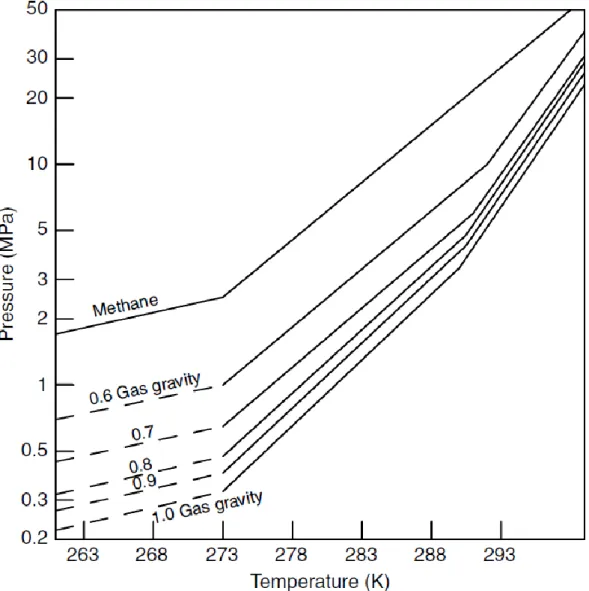
Such techniques are useful for predicting the approximate hydrate phase equilibrium of pure CO2 hydrates. 33 The simplest method for estimating hydrate equilibrium data is the gas gravity method.
Thermodynamic phase equilibrium
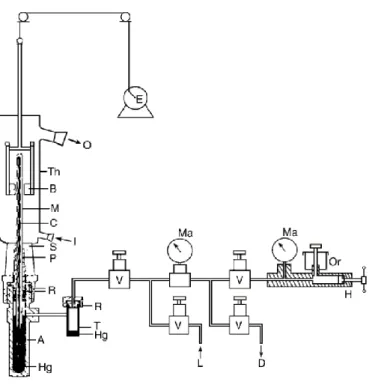
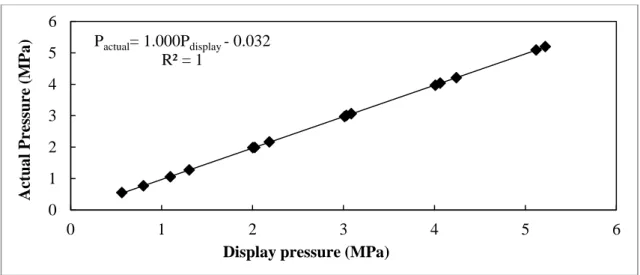
The equilibrium cell contains a sight glass to visually confirm the formation and disappearance of the hydrate. Valve V2 provided for the degassing of the fill line from the gas cylinder to the equilibrium cell. The maximum uncertainty in this study is attributed to the accuracy of the pressure transducer.
The uncertainty of the hydrate phase equilibrium data (±0.3 K and ±1.71 kPa) is presented as error bars in Chapter 7.5. The isobars provide a better representation of the dependence of the hydrate equilibrium temperature on the tetrabutylammonium salt concentration.
Thermodynamic model for hydrate phase
Equipment review
The temperature of the cell is then lowered, resulting in a drop in pressure (points A to B). 79 probe was used to report hydrate phase equilibrium measurements as hydrate forms at the bottom of the equilibrium cell. The mathematical intersection of the two polynomials was recorded as the hydrate dissociation/hydrate equilibrium point.
Lower gas solubility results in a delayed rate of gas hydrate formation due to slower kinetic rates. The initial heating of the hydrate resulted in a pressure drop due to the rate of hydrate formation opposing the rate of hydrate dissolution. Hydrate phase equilibrium data of CO2 + H2O + TBAC (tetrabutyl ammonium chloride) and CO2 + H2O + TBAF (tetrabutyl ammonium fluoride) were reproduced to validate the use of the isochoric pressure method in the measurement of systems containing tetrabutyl ammonium salts.
Lower gas solubility resulted in a slower gas hydrate formation rate due to the deceleration of the kinetic rate. An increase in TBAC and TBAF concentration resulted in a promoting effect of the equilibrium pressure.
Review of experimental method
Materials
Ultrapure water used in this study was supplied by the University of KwaZulu-Natal Chemistry Department with a conductivity of 18.3 Ω at 298.15 K.
Leak test
Pressure and temperature sensor calibration
The Pt-100 temperature probes are calibrated against a standard 100Ω platinum resistance using a processor calibrator CTH 6500, which is supplied by WIKA and has an accuracy of 0.06 K. The uncertainty of the lower probe and upper probe calibration correlation were estimated to be 0.03 K and 0.05 K respectively.
Vapour pressure measurements
Hydrate measurements
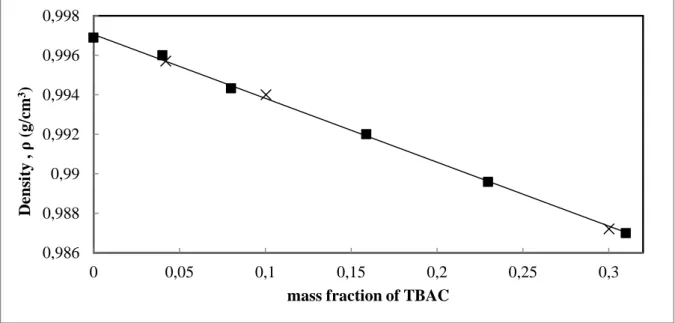
An Anton Paar vibrating tube digital densimeter (model DMA 5000) was used to measure the density of the tetrabutylammonium salt solutions. Density measurements are based on the oscillation period of the vibrating U-shaped hollow tube (packed with the sample). 21ml of the degassed tetrabutylammonium salt solution was drawn into the cell under vacuum.
90 An abrupt increase in pressure during isochoric heating marked the start of the dissociation process. Prior to the equilibrium point, a large pressure increase was observed during heating (see the steep polynomial in Figure 6-10). Uncertainty is a parameter associated with the result of the measurement that characterizes the dispersion of the reported value.
Reported measured values are the best estimate of the value and all uncertainty components contribute to the dispersion (Chirico et al., 2003).
Experimental apparatus
The key parameters of the rate of hydrate formation are a) type of hydrate former/gas composition b) mixing efficiency c) volume of H2O. The time of hydrate formation depends on the degree of mixing, the surface area of the system and the rate of heat and mass transfer. TBAC (4 wt %) and CO2 + H2O + TBAF (4 wt %) phase data from the literature were reasonably placed within the error bars of the experimental phase data.
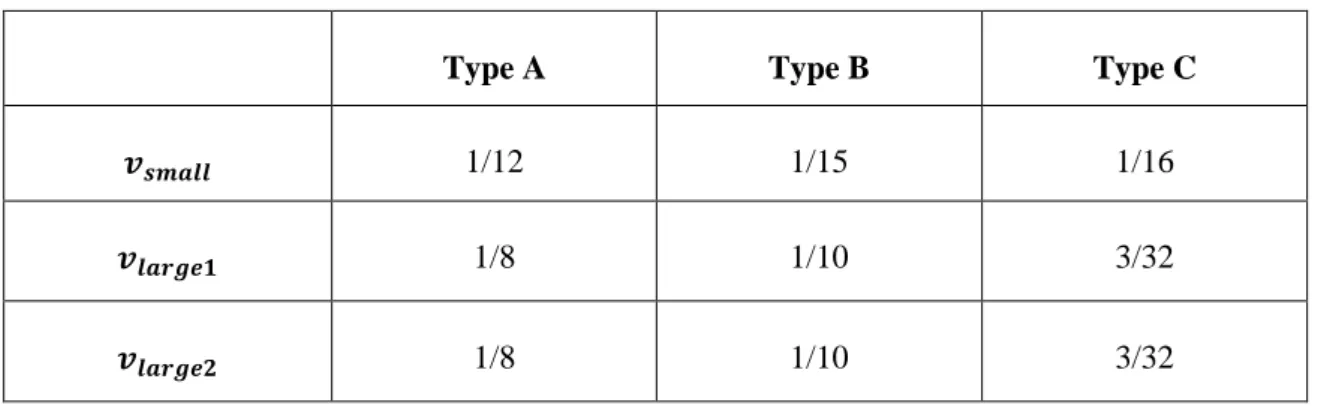
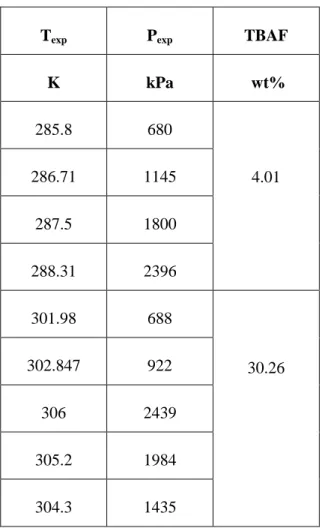
The hydrate equilibrium conditions were measured at different concentrations of the tetrabutylammonium salt ranging from 4 wt% to 30 wt%. The phase equilibrium data of the CO2 + H2O + TBAF (30.26 wt%) system measured in this study were compared with data from lower TBAF concentrations. Due to the dependence of the volatility of water in the hydrate phase on the hydrate structure type, the phase data modeling approach was performed three times for TBAC (for type A, type B and type C) and twice for TBAF (for type A and type B).
The predictive results of the Eslamimanesh (2012) model showed sufficient accuracy for the experimental pressure range. Phase equilibrium data by Li et al. 2010) was used as a test system to verify the prediction accuracy of the Eslamimanesh (2012) model on semi-clathrate hydrates of tetrabutylammonium salts. Analysis of hydrate phase equilibrium data measured for CO2 + H2O + TBAC and CO2 + H2O + TBAF at a fixed pressure illustrated a significant increase in the hydrate equilibrium temperature when a small amount (~4 wt%) of tetrabutylammonium salt is present.
Vapour pressure apparatus
Experimental procedure
A small amount of water used will result in less gas encapsulation and the resultant pressure drop will be too small to be seen graphically and hydrate formation cannot be observed. If no hydrate formation was observed, isochoric cooling was restarted at a higher temperature to increase the driving force of undercooling. An inconsistent cooling rate will result in a change in gradient and will prevent graphical observation of hydrate formation.
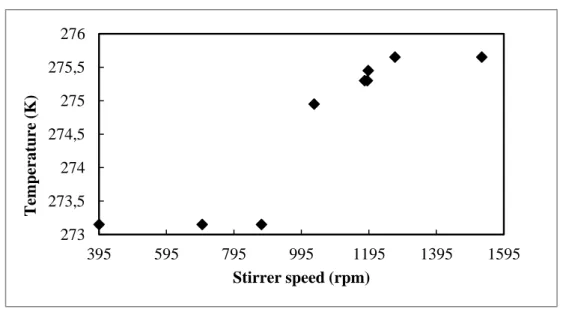
Once the cooling stage was completed, the temperature was held for 20 minutes to exclude the metastability and complete the hydrate formation. To achieve the most beneficial hydrate formation rate, the effects of the magnetic stirrer speed on the rate of hydrate formation were investigated. Since the rate of hydrate formation is apparatus dependent, the data presented in Figure 7-3 will change for a different unit.
The optimum stirring speed of 1272.73 rpm was determined by observing the highest hydrate formation temperature (275.65K) and fastest formation time (30 minutes).
Uncertainties
102 The sudden increase in pressure is due to the increase in temperature, which means the release of gas from the hydrate crystal. 103 The experimental data were measured in ascending order (measured pressure) followed by descending order to reduce the occurrence of hysteresis. The dissociation steps near the cooling curve were repeated to minimize hysteresis effects in the graphical method of finding the isochoric pressure.
Eslamimanesh (2012) also measured CO2 + H2O + TBAB systems and calculated the hydrate phase data uncertainty of ±50 kPa and ±0.1 K. The uncertainty of solution composition is estimated to be ±0.0.0001 g, which is the uncertainty of the mass balance.
Hydrate phase equilibria measurements
Test systems
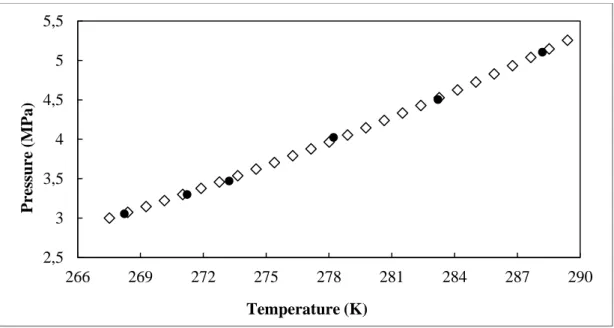
The experimentally measured phase data in this study have maximum temperature and pressure uncertainties of ±0.14 K and ±1.71 kPa. The experimentally measured phase data in this study have a maximum temperature of ±0.14 K and are represented by error bars. The experimentally measured phase data were compared with the literature data of Deaton and Frost(1946), Larson(1955) and Vlahakis(1972).
The deviation between experimental phase data and literature phase data was reported in print and shown in table.7.5. The experimentally measured phase data in this study have maximum temperature and pressure uncertainties of ±0.30 K and ±1.71 kPa. The experimentally measured phase data in this study have a maximum temperature of ±0.29 K and are represented by error bars.
The hydrate equilibrium phase data of Li et al. 2010) were plotted on a log graph and a linear trend line was fitted.
New systems
An increase in the TBAC concentration resulted in an enhanced promoting effect of the equilibrium pressure. The fugacity of the promoter in the liquid phase accounts for the number of TBA+ occupying cavities (see Equation 3.65. The activity coefficient for water in the liquid phase was calculated using the Non Random Two Liquid (NRTL) model proposed by Renon and Prausnitz (1968).
The prediction data depict a change in the crystal structure of the TBAC semi-clathrate at 3630 kPa and 285.4 K. This indicates that the type C structure of the TBAC semi-clathrate hydrate does not exist at the experimental conditions (temperature, pressure and salt concentration) ) of this study. The trend of the CO2 + H2O + TBAF (30.26 wt%) system was not parallel to the trend of literature data at lower TBAF concentrations.
The predicted results of Eslamimanesh model (2012) showed sufficient accuracy at the experimental pressure range. The phase data trend of the CO2 + H2O + TBAF (30.26 wt%) system was not parallel to the trend of literature data at lower TBAF concentrations. 145 Mohammadi A, Mehrdad M, Richon D, Mohammadi A, 2013, Phase equilibrium measurements for semi-clathrate hydrates of the (CO2 + N2 + tetra-n-butylammonium bromide) aqueous solution system.
Hydrate formation and dissociation rate
Modelling
Activity coefficient of the hydrate promoter in the aqueous phase Actual liquid mole fraction of the component.