THE IMPACT OF WATER AND SEDIMENT QUALITY ON THE HEALTH OF CLARIAS GARIEPINUS (BURCHELL, 1822) AND LABEO ROSAE
(STEINDACHNER, 1894) AT THE PHALABORWA BARRAGE, OLIFANTS RIVER, LIMPOPO PROVINCE
by
MATLALE LETTICIA MAHLATJI
DISSERTATION
Submitted in fulfilment of the requirements for the degree of
MASTER OF SCIENCE in
ZOOLOGY in the
FACULTY OF SCIENCE AND AGRICULTURE SCHOOL OF MOLECULAR AND LIFE SCIENCES
at the
UNIVERSITY OF LIMPOPO
SUPERVISOR: Prof. A. Jooste
CO-SUPERVISOR: Prof. A. Addo-Bediako
2014
DELARATION
“I declare that the dissertation hereby submitted to the University of Limpopo, for the degree of Master of Science in Zoology has not previously been submitted by me for a degree at this or any other university; that it is my work in design and in execution, and that all material contained herein has been duly acknowledged.”
__________________________ ______________
M.L Mahlatji (Ms) Date:
i
ACKNOWLEDGEMENTS
To God be the Glory, for blessing me with courage and wisdom during the extended course of my study
I wish to acknowledge and thank the following persons and organisations whose involvement made this research project successful:
My supervisors, Prof. A. Jooste and Prof. A. Addo-Bediako for their support, guidance and above all their endless patience. It is highly appreciated
Dr M.M Matla and Prof. W.J Luus-Powell for assisting with the identification of parasites and staining, support and motivation throughout the project
The South African National Research Foundation (NRF), the Water Research Commission (WRC), the Vlaamse Interuniversitaire Raad – University Development Cooperation, (VLIR/UOS) University of Limpopo Scholarship (UOS) for financial support during this study
Water-Lab (PTY) LTD team for chemical analysis of water, sediment and fish muscle tissue samples
Dr Bettina Genthe (CSIR, Stellenbosch) for conducting the Human Health Risk assessment.
Dr S M Marr for assisting with EndNote and data analysis.
Staff and post-graduate students in the Department of Biodiversity, for fieldwork assistance and technical service during the study
My sisters for motivation, encouragement and support to further my studies
ii ABSTRACT
Contamination of aquatic ecosystems by agricultural and mining activities, as well as by industrial discharges and urbanization in the catchment of the South African river systems has been the cause of increasing public concern. These activities may result in water pollution. One such river is the Olifants River System in Mpumalanga and Limpopo provinces which is highly impacted.
The main aim of the study was to assess the impact of the water and sediment quality on the health of Clarias gariepinus and Labeo rosae and human risk when the fish is consumed at the Phalaborwa Barrage in the Lower Olifants River, Limpopo Province.
This was achieved by assessing the water and sediment quality of the barrage at the three sampling sites; assessing the condition of the fish and the fish parasites by applying the fish HAI (Health Assessment Index) and PI (Parasite Index); determining the bioaccumulation of selected metals in the muscle tissue of the two fish species;
and to determine the Human health risk factor upon consumption of fish contaminated with metals at the barrage.
Ten fish from each fish species were collected seasonally at each site using gill nets of different mesh sizes. Standards methods were followed when testing selected water and sediment constituents. For water quality sampling, the water samples were collected over four seasons (autumn, winter, spring and summer) at three sites (inflow, wall and below wall) from April 2010 to January 2011. Sediment samples were also collected using a Friedlinger mudgrab (225cm3) at the three sites during winter and summer.
Fish hosts were examined for mobile ectoparasites, weighed and measured. Blood samples were drawn and skin smears were made. Fish were killed, dissected and all external and internal organs were examined as prescribed in the fish health assessment index. The condition factor was determined for each fish population. All parasites were collected, fixed and preserved using standard methods.
The highest water temperature (28.5 ºC) was in spring and lowest in winter (18 ºC).
Overall pH was in an alkaline condition as it ranged from 7.4 to 8.7. Most water quality parameters were recorded at higher concentration in spring which includes; water
iii
temperature, pH, conductivity, salinity, TDS, alkalinity, and turbidity. Major ions (cations and anions) recorded were all within the TWQR. Sulphates concentrations were all within the TWQR. Calcium concentration levels exceeded the typical concentration limit in spring but the levels were still within the TWQR for domestic use.
Nutrients levels (nitrate, nitrite, sulphate) were very low which indicate oligotrophic conditions. Highest total nitrogen was recorded in spring which is an indicative of eutrophic conditions. Highest phosphorous concentrations were recorded in winter, spring and summer which are an indicative of eutrophic conditions. Noticeable elevated levels were recorded at the inflow in summer which is an indicative of hypertrophic conditions.
The results of the metals concentrations analysed demonstrated that metals within the barrage are present in trace amounts in the water. Analysis of the metal concentrations in water, sediment and fish muscle tissue revealed that the sediment contained the highest concentrations of metals followed by fish tissue and then the water. Metals that were detected in the water column includes; aluminium, antimony, arsenic, barium, boron, iron, manganese, selenium, strontium and tin. Metals that were detected at concentrations above the TWQR for aquatic ecosystem were; aluminium, antimony and selenium.
Arsenic, cadmium and chromium were recorded at concentrations above the detection limit as suggested by CCME. Zinc concentrations were recorded at levels below suggested detection limit. Aluminium, barium, boron, cadmium, chromium, manganese, selenium and strontium were all detected at elevated levels in water and above the TWQR. Among the metals recorded in the water column, significant seasonal variations in concentration were found for aluminium, barium, boron, lead selenium and strontium whereas only boron showed a significant variation between sites.
In comparison to the metals concentrations accumulated in the muscle tissue of both fish species. It was noted that C. gariepinus accumulated more metals than L. rosae;
however L. rosae accumulated more metals at elevated concentrations than C.
gariepinus. The metals that were accumulated at elevated levels in C. gariepinus were barium, boron, zinc and selenium. In L. rosae, iron, aluminium, strontium, titanium, vanadium and arsenic accumulated at elevated levels. All these metals pose a high risk to fish and human’s health.
iv
The highest population HAI was recorded in summer for both fish species. The lowest HAI value was recorded in autumn for both fish species. Although a high HAI population value was recorded higher in summer for both fish species, in general both fish species from the barrage were in a normal condition. A high number of ectoparasites were recorded in L. rosae than in C. gariepinus while high numbers of endoparasites were recorded in C. gariepinus than L. rosae. The dominating ectoparasites for both species were from the class monogenea. Although the prevalence for Contracaecum sp. in C. gariepinus was 100% in all season, it did not influence the condition of the host. None of the parasites identified from both fish species neither reached alarmingly infection levels nor caused any visible damage to the host.
In conclusion, the water quality at the Phalaborwa Barrage is slightly polluted based on the water quality parameter(phosphorous) presence and recorded of some metals at the inflow that were recorded at elevated levels above the TWQR. Further recommendations are refereed such as extension of this study to all tributaries and to include other fish species in addition to constant monitoring of the impoundment.
v
TABLE OF CONTENTS
Acknowledgements i
Abstract ii
CHAPTER 1: GENERAL INTRODUCTION
1.1 Introduction 1
1.2 Rationale for the study 2
1.3 Research Questions 3
1.4 Aim of the study 4
1.5 Objectives 4
1.6 Literature review 4
1.7 Description of the study area 5
1.7.1 Olifants River System 5
1.7.2 Phalaborwa Barrage: sampling site 8
1.8 Fish species 9
1.8.1 Clarias gariepinus 9
1.8.2 Labeo rosae 10
1.10 Layout of the dissertation 11
CHAPTER 2: WATER AND SEDIMENT QUALITY
2.1 Introduction 12
2.2 Methodology 13
2.2.1 Water and sediment sampling and analysis 13
2.2.2 Results analysis 14
vi
2.3 Results and discussion 16
2.3.1 Physico-chemical parameters 17
2.3.2 Metals and metalloids 29
2.3.3 Metals in sediment 31
2.3 Conclusions 35
CHAPTER 3: BIOACCUMULATION AND HUMAN HEALTH RISK
3.1 Introduction 38
3.2 Methodology 39
3.2.1 Fish collection and muscle sampling 39
3.2.2 Laboratory analyses 39
3.2.3 Human health Risk Assessment 40
3.2.3 Statistical analysis 40
3.3 Results and discussion 40
3.3.1 Bioaccumulation in fish muscle tissue 41
3.3.2 Human health risk assessment 48
3.4 Conclusions 50
CHAPTER 4: FISH HEALTH ASSESSMENT INDEX AND PARASITES
4.1 Introduction 52
4.2 Methodology 53
4.2.1 Health Assessment Index and associated Parasite Index 53
4.2.2 Field work 53
4.2.3 Calculation of the Health Assessment Index 54
vii
4.2.4 Fixing and preserving parasites 55
4.2.5 Laboratory work 55
4.2.6 Data analysis 56
4.2.7 Parasite index 56
4.2.8 Calculating the Condition factor 57
4.3 Results and Discussion 57
4.3.1 Health Assessment Index 57
4.3.2 Parasites 61
4.3.3 Parasite Index 61
4.3.4 Infestation statistics 65
4.3.5 The Condition Factor 74
4.4 Conclusions 76
5. CHAPTER 5: GENERAL CONCLUSIONS AND RECOMMENDATIONS 79 6. CHAPTER 6: REFERENCES 87
7 APPENDICES 104
APPENDIX A 104
APPENDIX B 107
viii LIST OF FIGURES
Figure 1.1: Map of the Olifants River system showing the location of major towns, impoundments and tributaries. Major impoundments are depicted by numbers: B) the study site the Phalaborwa Barrage is circled. (Google earth 2013)...……...…...…....6 Figure 1.2: I- Satellite image of the Phalaborwa Barrage with the three sampling sites (water and sediment); I - inflow, B - wall and C –-below wall. LNW – Lepelle Northern Water board (from Google Earth), II- Sluices at the barrage
=wall……...10 Figure 1.3: Fish species used for the study A: Clarias gariepinus (sharptooth catfish) B: Labeo rosae (rednose labeo)...9 Figure 2.1: Seasonal mean concentrations for water quality data analysis: water temperature, dissolved oxygen, pH and turbidity at three sites at the Phalaborwa Barrage (May 2010- January 2011)……….……….………..16 Figure 2.2: Seasonal mean concentrations for water quality data analysis: total dissolved solids, electrical conductivity, salinity, alkalinity and water hardness at three sites at the Phalaborwa Barrage (May 2010- January 2011)………...20 Figure 2.3: Seasonal mean concentrations for water quality data analysis: water hardness; chloride; fluoride and sulphate at the three sites at the Phalaborwa Barrage (May 2010- January 2011)……….……….………..23 Figure 2.4: Seasonal mean concentrations for water quality data analysis: calcium;
magnesium; potassium and sodium at three sites at the Phalaborwa Barrage (May 2010- January 2011)……….………24 Figure 2.5: Seasonal mean concentrations for water quality data analysis: total nitrogen and phosphorous at three sites at the Phalaborwa Barrage (May 2010- January 2011...………..………...27 Figure 4.1: Seasonal population Health Assessment Index (HAI) and Inverted Parasite Index (IPI) for Clarias gariepinus and Labeo rosae at the Phalaborwa Barrage………...57 Figure 4.2: A-D Anomalies recorded from internal organs of Clarias gariepinus from Phalaborwa Barrage. A: Healthy liver; B: white spots on the liver C: Mesenteric fat
ix
in the body cavity; D: Discoloured liver with blackened portions…………....……….……..59 Figure 4.3: A: Mesentric fat >50% from L. rosae; B: Lamproglena sp. on skin of Labeorosae; C: Yellow bile. D: Green bile………..…………59 Figure 4.4: A-E ecto and endo-parasites recorded from the gills of Clarias gariepinus A: Macrogyrodactylus clarii; and B: Quadriacanthus aegypticus; C: Lamproglena clariae attached on the gill filament; endo-parasites from intestines D:
Paracamallanus cyathopharynx; endo-parasite from the stomach lining E:
Glossidium pedatum (adult)……….………..………..70 Figure 4.5: A-D ecto and endo-parasites recorded from gills of Labeo rosae A:
Dactylogyrus pienaari B: D. Pienaari copulatory organ; C: Lamproglena sp. attached on the skin; D:Lamproglena sp.; endo-parasite collected from eye socket E:
Nematobothrium sp……….…………...………..70 Figure 4.6: Seasonal condition factor in both fish species at the Phalaborwa Barrage……….………...………...75
LIST OF TABLES
Table 2.1: Water quality guidelines for aquatic and domestic use…….………….……….……….……….…..15 Table 2.2: The mean seasonal (with standard deviations) physico-chemical values for the water (n=3) at the Phalaborwa Barrage (May 2010- January 2011)….……..17 Table 2.3: The seasonal mean concentrations (with standard deviations) of inorganic nitrogen, phosphorous and major ions (n=3) recorded at the Phalaborwa Barrage (May 2010- January 2011)………....……23 Table 2.4: The seasonal average metals and metalloids variations (with standard deviation) in water: aluminium, antimony: arsenic, barium, boron, iron, manganese, selenium strontium and tin at the Phalaborwa Barrage………...……...29 Table 2.5: Seasonal metal concentrations in the sediment (n=6) at the Phalaborwa Barrage in mg/kg dry weight (July 2010 and January 2011)……….………...32 Table 3.1: The mean concentrations of metal and metalloid (mg/kg dw) and the standard deviations in the muscle tissue of Clarias gariepinus and Labeo rosae (n=15) and sediment (n=6) from the Phalaborwa Barrage (May 2010-January 2011).
x
……….41 Table 3.2: The contribution of the respective metals to the Hazard Quotient for Clarias gariepinus and Labeo rosae from the Phalaborwa Barrage; calculated for one fish meal (150 g) consumed on a weekly and daily basis. (Adapted from Jooste et al. 2013). The shaded values indicate where HQ value of one was exceeded………..………...……….49 Table 4.1: The revised Parasite Index (Jooste et al. 2004) and Inverted Parasite Index (IPI) (Heath et al. 2004)………...………..…….56 Table 4.2: Summary of the number of ectoparasites collected from Clarias gariepinus and Labeo rosae at the Phalaborwa Barrage……..…...………62 Table 4.3: The endoparasites collected from Clarias gariepinus and Labeo rosae at the Phalaborwa Barrage………...………..…..63 Table 4.4: Seasonal Parasite Index and Inverted Parasite Index for Labeo rosae and Clarias gariepinus………..………..………..65 Table 4.5: The parasite abundance (MA), prevalence (P) and mean intensity (MI) of Labeo rosae at Phalaborwa Barrage………..………..…..66 Table 4.6: The parasite abundance (MA), prevalence (P) and mean intensity (MI) of Clarias gariepinus at Phalaborwa Barrage………..………..…67
LIST OF APPENDICES
APPENDIX A: WATER AND SEDIMENT QUALITY
Appendix A 1.1: The seasonal water quality constituents at the three sampling sites of the Phalaborwa Barrage……….………103 Appendix A 1.2: Seasonal metal concentrations in the water at the three sampling sites at the Phalaborwa Barrage……….………..104 Appendix A 1.3: Seasonal mean concentrations in sediment at the Phalaborwa barrage per site……….…………...105 APPENDIX B: FISH HEALTH ASSESSMENT INDEX PARASITES
Appendix B 1.1: Seasonal values of fish HAI variables for Clarias gariepinus at the Phalaborwa Barrage………...………..………..106 Appendix B 1.2: Health Assessment Index (HAI) of Labeo rosae from Phalaborwa Barrage……….108
xi
Appendix B 1.3: Fish Health Assessment Index (HAI) variables with assigned characters showing the norm and deviation from the norm in the necropsy based system (adapted from Adams et al. 1993; revised by Heath et al. 2004a; Jooste et al. 2004)………...……….110
LIST OF ABBREVIATIONS AEV Acute Effect Value
ATSDR Agency for Toxic Substances and Disease Registry CEV Chronic Effect Value
CCME Canadian Council of Ministers of the Environment CSIR Council for Scientific and Industrial Research DWAF Department of Water Affairs and Forestry DWA Department of Water Affairs
HAI Health Assessment Index
ICP-OES Inductively coupled plasma - optical emission spectrometry IPI Inverted Parasite Index
PB Phalaborwa Barrage PI Parasite Index
SAWQG South African Water Quality Guidelines SQG’s Sediment Quality Guidelines
TWQR Target Water Quality Range UL University of Limpopo
US-EPA US United States Environmental Protection Agency WHO World Health Organisation
1
CHAPTER 1
GENERAL INTRODUCTION
1.1 INTRODUCTION
Freshwater is the most precious yet a limiting natural resource on earth. Although the earth surface is comprised of 70% of water, only 3% of it is made up of freshwater and it deteriorates mostly due to anthropogenic activities (Davies and Day 1998). Water quality problems caused by pollution is a major concern in the world due to expanding urban settlements, industrial sectors, and commercialized agriculture which contribute to the contamination (pollution) of the aquatic ecosystem (Dallas and Day 2004).
There is a global concern about the progressive pollution of valuable freshwater systems which most organisms, including humans, are reliant upon (Kotze et al. 1999).
Water pollution refers to the contamination of the water bodies (e.g. rivers, lakes, oceans, aquifers, and ground water) resulted from anthropogenic activities, this can be harmful to plants and organisms living and /or relying to the water bodies (Heath and Claassen 1999). Aquatic ecosystems are increasingly affected by several anthropogenic impacts, like the elevated levels of nutrients which results in eutrophication, toxic contamination of industrial, agricultural and domestic origin, heat pollution, reaching the water bodies through their catchment area and the atmosphere (Davies and Day 1998).
The pollution of freshwater aquatic systems can be linked to point source discharges (waste water treatment works and industrial effluents) and diffuse surface runoff (agricultural, mining, industrial and urban) (Dallas and Day 2004). The Olifants River is impacted by several anthropogenic activities, particularly mining in the upper catchment, and urbanisation, industrial and agricultural activities in the upper and lower catchments. The major sources in the lower catchment areas of the Olifants River are municipal (treated and untreated sewage waste), mining and industrial discharges (Heath et al. 2010). A vast number of mines and industries, as well as the demographic situation in the catchment of the Olifants River, is an indicative of a possible pollution to the freshwater systems (Stimieet al. 2001). Earlier studies have shown that these activities resulted in the degradation of the Olifants River System
2
(Ashton and Dabrowski 2011). As a result of these anthropogenic activities, humans and animals as well as other biota, may be exposed to harmful contaminants (Davies and Day 1998, Moss 1998, Dallas and Day 2004).
Modern agriculture, industrialization and urbanisation have negatively affected environmental quality and aquatic systems (du Preezet al. 2003). Water quality is a term used to describe the chemical, physical, and biological characteristics of water, usually in respect to its suitability for an intended purpose .These characteristics are controlled or influenced by substances that are either dissolved or suspended in water (DWAF 1996a). Water quality plays an important role in the wellbeing of all users. Most water quality problems in South Africa are as a result of salinization, enrichment by plant nutrients, microbiological proliferation, particulate sedimentation and silt migration, and acidification (Chapman 1992). Water-borne pollutants (metals, sediment, nutrients, acidic compounds and biocides) are considered to be most important in terms of their impact on the aquatic ecosystems (Adams et al. 1993).
Fish parasites are indicative of many biological aspects of their hosts and they are receiving a lot of attention worldwide from parasite ecologists as potential indicators of environmental quality because of the variety of ways in which they respond to anthropogenic pollution (Sures et al.1999). Ectoparasites are found on the external surfaces such as skin, fins and gills (e.g. gill flukes, anchor worms, fish lice and leeches). Endoparasites are found in the internal tissues such as muscles and organs such as the alimentary canal, liver, and kidney (e.g. trematodes, cestodes, acanthocephalans and nematodes) (Paperna 1996). In addition, the ecto-parasites are exposed to the environment as their hosts whereby it was then assumed that poor water quality will adversely affect ectoparasites to a greater degree than it would to endo-parasites (Avenant-Oldewage 1994).
1.2 RATIONALE OF THE STUDY
Several of the rivers in South Africa are being adversely impacted by contaminated water due to constant increase in anthropogenic activities in the catchments. One of such rivers is the highly impacted Olifants River System in Mpumalanga and Limpopo provinces; a tributary of the trans-boundary Limpopo River System (Ashton 2010). The
3
Olifants River in the Limpopo province is subsequently receiving pollutants from the upper catchment, which can adversely impact the functions of the aquatic ecosystem in the province. The Olifants River System is the third most polluted river systems in South Africa and has been polluted by anthropogenic activities from agricultural and mining activities, industrial development and urbanisation over the years and contaminated with metals, chemicals and organic pollutants (Heath et al. 2010, Ashton and Dabrowski 2011). There have been reports on major unexplained crocodile and fish kills in the upper sub-catchment (Loskop Dam) and lower sub-catchment (KNP) between 2008 and 2009 which renewed interest in research on water quality problems in the Olifants River System (de Villiers and Mkwelo 2009; van Vuuren 2009; Ashton 2010; Heath et al. 2010; Ashton and Dabrowski 2011).
The communities around the catchment area consume fish from the impoundments, they are potentially at risk to genotoxic, carcinogenic and non-carcinogenic health risks, including developmental, reproductive and chronic systemic effects, through long-term exposure to contaminants that have bio-accumulated in fish tissue (du Preezet al. 2003).
Several studies (system (Seymore et al. 1994, 1995; du Preez et al. 1997; Robinson and Avenant-Oldewage 1997; Avenant-Oldewage and Marx 2000a, b) have been done in the lower catchment (Kruger National Park) on water quality, bioaccumulation and fish health, however, none of the bioaccumulation studies done on the Olifants River linked bioaccumulation of metals in the fish muscle tissues to human health. This study formed part the Water Research Council (WRC) K5/1929 project (Jooste et al.
2013) and VLIR-UOS project of the Department of Biodiversity, University of Limpopo to determine the impact of water and sediment quality on the fish health and fish parasite diversity in the Olifants River, Limpopo province.
1.3 RESEARCH QUESTIONS
1. What is the quality of the water and sediment of the Olifants River at the Phalaborwa Barrage?
2. What is the impact of water and sediment quality on the abundance and infestation rate of parasites at the Phalaborwa Barrage?
4
3. What is the level of accumulation of metals in the fish muscle tissues at the Phalaborwa Barrage?
4. Are there any health risks to humans upon consumption of fish in that area?
5. What is the fish health of Clarias gariepinus and Labeo rosae when applying the fish Health Assessment Index (HAI) and Parasite Index (PI)?
6. What is the seasonal abundance and variability of ecto- and endo-parasites and their effects on the two fish species?
1.4 AIM OF THE STUDY
The aim of the study was to assess the impact of water and sediment quality and bio- accumulation of metals on the health and parasites of Clarias gariepinus and Labeo rosae and to determine the human risk associated with consumption of the fish in the Phalaborwa Barrage in the lower Olifants River in the Limpopo Province
1.5 OBJECTIVES
The aim was achieved by the following objectives:
To assess the water and sediment quality of the Phalaborwa Barrage by determining the level of physical and chemical substances in the water and sediment at the three sites (inflow, wall and below);
To determine the concentration levels of selected metals in the muscle tissue of the two fish species and;
To determine the potential human health risk upon consumption of metal contaminated fish from the barrage;
To assess the health of Clarias gariepinus and Labeo rosae by applying the fish Health Assessment Index (HAI) and Parasite Index (PI);
To determine the seasonal abundance and variability of ecto- and endo- parasites and their effects on the two fish species.
1.6 LITERATURE REVIEW: OLIFANTS RIVER SYSTEM
The Olifants River is one of the rivers that contain high silt loads, salinity and pollutant levels (Grobler et al. 1994). Sediments have been widely used as environmental
5
indicators due to their ability to store contaminants as well as to act as trace contamination sources (US-EPA 2003). Sediment refers to depositional materials with grain sizes from sand, through silt to clay. Fine sediment often contains highest concentrations of contaminants on a dry weight basis because they have a higher relative surface area and thus increased density of sorption sites (US-EPA 2003). Poor cultivation management in the agricultural sector and bad mining practices in the lower sub-catchment have caused extensive soil erosion, resulting in an increase in sediment loads. This has a detrimental effect not only on benthic organisms, but also on the breeding, feeding and refuge areas of fish (van Vuren et al. 1994).
Numerous of South Africa's aquatic ecosystems have been degraded over the past few decades. The Olifants River in Mpumalanga and Limpopo Province is one of the main river systems in South Africa and it has been described as one of the most polluted rivers in Southern Africa, with the Loskop Dam acting as the origin for pollutants from the upper catchment area (Grobler et al. 1994; Ashton and Dabrowski 2011). People living near the Olifants River catchments make use of the river and impoundments in the system for daily living purposes; for example, drinking the water and consuming the fish daily from the Olifants River catchment. The Phalaborwa Barrage has been providing water to the community for drinking, washing, mining and industrial use, fishing and other several activities.
1.7. DESCRIPTION OF THE STUDY AREA
1.7.1 Olifants River System
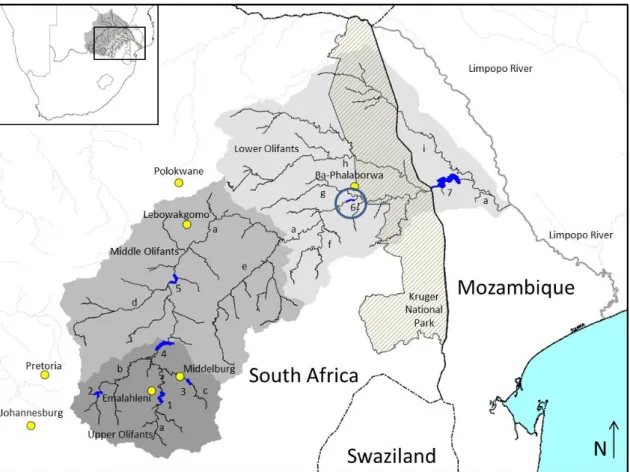
The Olifants River System is situated in the north east of South Africa and is over 54 570 km2 in area (Figure 1.1).
The Olifants River System originates just within and east of Gauteng Province and the main stem flows in a northerly direction. Beyond Flag Boshielo Dam it changes direction eastwards, enters the Kruger National Park near Phalaborwa and flows further east, joining with the Letaba River and then Mozambique. The Massingir Dam is just beyond the border in Mozambique border then flows into the Massingir Dam from where it is known as the Rio dos Elefantes. Further downstream the Olifants River
6
joins the Limpopo River before it drains into the Indian Ocean north of the city of Maputo.
Figure 1.1: Map of the Olifants River system showing the location of major towns, impoundments and tributaries. Major impoundments are depicted by numbers: B) the study site the Phalaborwa Barrage is circled. (Google earth 2013).
The main storage reservoirs in the Olifants River System include; Loskop Dam, Flag Boshielo Dam and the new de Hoop Dam on the Steelpoort River. The high number of mining (coal), and other industrial activities in the upper Olifants, are the main contributors to the poor in-stream and riparian habitat conditions where acid leachate from mines contributing to the poor water quality conditions.
The Olifants River catchment is subdivided into four sub-catchments namely:
The upper sub-catchment form part of the Highveld and is composed of undulating plains and pans, and large open flat area called Springbok Flats. The upper Olifants River is characterised by large scale of mining (coal), coal-fired power generation
7
plants, industries and agriculture (extensive cropping, irrigation and stock farming) activities and several towns and urban centers (Heath et al. 2010; de Villiers and Mkwelo 2009). About 55% of South Africa’s electricity from Coal fire and power generation is produced in the highveld which also contribute to the pollution in the aquatic ecosystem (Heath et al. 2010).
The Middle sub-catchment stretches for about 300 km along the Olifants River from below the Loskop Dam (Figure 1.1). The river then flows through the middle veld area of Mpumalanga where it suppliers water to the large irrigation schemes of Groblersdal and Marble Hall before flowing into the Flag Boshielo Dam in the Limpopo Province (Figure 1.1). The second largest irrigation scheme which produces fruits and vegetables for the export market in South Africa is located between the two impoundments.
The middle sub-catchment is characterised by extensive areas of irrigated agricultural and mining activities (platinum, chrome and vanadium) (Claassen et al. 2005).
Agricultural pesticides such as organophosphates and carbonates are regularly applied (aerial application) to crops in the Groblersdal and Marble Hall areas and no regulation is taking place with regard to pesticide application in the area (Bollmohr et al. 2008).
The Steelpoort sub-catchment: The Steelpoort sub-catchment consists of the area drained by the Steelpoort River with a surface area of 7 139 km2. Just close to the Burgersfort town, the Steelpoort River flows north-eastwards through a gorge in the escarpment before joining the middle reaches of the Olifants River. Land use in this sub-catchment consists of small- and medium-scale livestock (dairy and beef cattle) farming and a few small-scale irrigation schemes. There are intensive irrigation and extensive chrome and platinum mining activities in this catchment (de Lange et al.
2003).
Lower Olifants sub-catchment: it stretches from Drakensberg escarpment through the Kruger National Park to the Massingir Dam in Mozambique. It then joins the Limpopo River in Mozambique before it enters the Indian Ocean. This sub-catchment is characterised mostly by agricultural, mining and industrial activities especially around the Phalaborwa town (Heath et al. 2010). There are various mines (gold, platinum, chrome, vanadium, ferro-chrome, copper and phosphate) and numerous
8
smaller urban centres in the Lower Olifants River sub-catchment; the mines use the river as a source of water (Ashton et al. 2001, de Langeet al. 2003). Major industrial and mining operations have developed in the area and have resulted in changes in water quality (physico chemical). Agriculture in the upstream sub-catchment has also contributed to the pollution of the Olifants River resulting in an increases in phosphate and nitrate concentrations thus releasing biocide residues (van Vuren et al. 1994).
1.7.2 Phalaborwa Barrage: Sampling site Phalaborwa Barrage (24° 4’ 12’’ S, 31° 8’ 43’’ E)
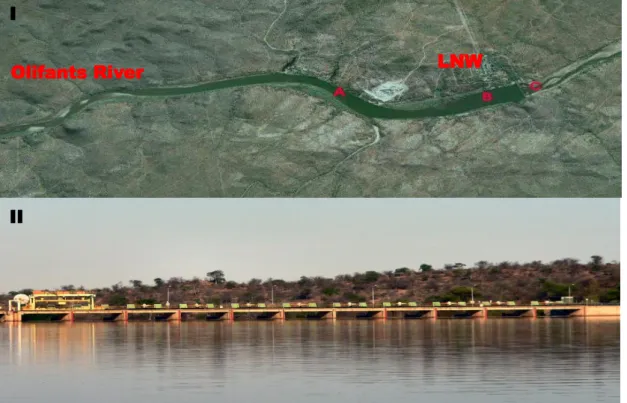
Figure 1.2: I- Satellite image of the Phalaborwa Barrage with the three sampling sites (water and sediment); I - inflow, B - wall and C –below wall. LNW – Lepelle Northern Water board (from Google Earth), II- Sluices at the barrage =wall.
The study was done in the Phalaborwa Barrage near Ba-Phalaborwa (Figure 1.2) which is the last impoundment built in the lower Olifants River System, Limpopo Province. The barrage is located about 10 km, South of the town of Ba-Phalaborwa, in the North-eastern part of the Limpopo Province (Figure 1.1). The barrage was constructed in 1959 and it is constructed of a line of 22 sluices with flanking piers to control the flow of water (Figure 1.2b). The water in the barrage is managed by the
II I
Olifants River LNW
9
Lepelle Northern Water Board (LNW), which supply water to the community and the two mines (phosphate and copper) known as Phalaborwa Industrial Complex (PIC).
The Lepelle Northern Water Board pumps water from the barrage, purify and distribute portable and industrial water to various users in the Phalabowa regions (de Lange et al. 2003). About ± 141 million m3 per annum of water is extracted from the barrage for domestic, industrial and the surrounding areas. The water level is usually kept almost full, approximately 1.5 m3/.s. The mean annual runoff is estimated to be 1 201 million m3 per annum (Lepelle Northern Water 2010). When there is less flow of water into the barrage, supplementary water is released from the Blyderivierspoort Dam (van Vuren et al. 1994).
The barrage is located in the Savannah Biome, Lowveld Bioregion and it is bordered by a dense riparian vegetation of the river including indigenous trees, grasses and reeds (Balance et al. 2001). The barrage also provides a habitat for many animals like hippopotami, Nile crocodiles, Nile monitor lizards, water birds with many antelopes and elephants drinking the water and consuming the vegetation. In the State of the Rivers Report, is it reported that the Ecoregion 5.06, upstream of the Phalaborwa Barrage of the Olifants River was in a fair to poor state in terms of in-stream and riparian habitat in the year 2000. The biological indicator of this eco-region reflects a fair state in general (Ballance et al. 2001).
1.8 FISH SPECIES
Two fish species selected for this study were: C. gariepinus (Figure 1.3A) and L. rosae (Figure 1.3B) (Skelton 2001). The two species were selected because of their abundant availability at the Olifants River, they occupy a variety of habitats, have different feeding habits and feed on diversity of food particles and that they are mostly consumed by humans.
Clarias gariepinus, commonly known as the sharptooth catfish, (Burchell, 1822) belongs to the Order Siluriformes, Suborder Siluroidei and Family Clariidae.
10
Figure 1.3: Fish species used for the study A: Clarias gariepinus (sharptooth catfish) B: Labeo rosae (rednose labeo).
Clarias gariepinus is a widely distributed indigenous fish species in the Olifants River in the Limpopo province and throughout Africa.It inhabits calm waters in lakes, streams, rivers, dams; swamps and floodplains, several of which are subjected to seasonal drying, but the presence of the accessory air breathing organs allow the fish to survive during drought periods (Skelton 2001). Clarias gariepinus is classified as omnivorous, feeding mainly on aquatic insects, fish and higher plants debris (e.g. fruit) through hunting and scavenging- primary to tertiary consumer trophic levels (Skelton 2001). Because of its wide mouth, it is capable of swallowing relatively large prey whole. It grows fast and is hardy and can tolerate adverse water quality conditions (Jooste et al. 2013).
Labeo rosae (Steindachner, 1894), commonly known as the rednose labeo, belongs to the Order Cypriniformes and Family Cyprinidae. Labeo rosae occurs in the northern and north-eastern parts of South Africa (Lowveld reaches of the Limpopo, Incomati and Phongolo River systems). Labeo rosae is large in size with a more spindle shaped body, which aids them in free swimming. This fish species generally spawn on newly
11
flooded ground, usually leaving the main river channel to breed in summer (Skelton 2001). Their mouths have a pronounced rostral cap, which covers the upper lip except when feeding. Labeo rosae prefers sandy stretches of larger perennial and intermittent rivers. They feed on detritus, algae, and small invertebrates -primary and secondary consumer trophic levels (Skelton 2001).
1.9 LAYOUT OF THE DISSERTATION
Different aspects of this study are discussed in separate chapters.
Chapter 1 contains the introduction of the study, research problem, aim of the study with specific objectives, research questions, outlines the purpose of the study and gives brief literature review. The description of study area, sampling sites and description of the fish species used during this study.
Chapter 2 discusses factors affecting the quality of water and sediment.
Chapter 3 focuses on the bioaccumulation of metals in the fish muscle tissue and risks associated when contaminated muscle tissue is consumed by humans. The comparison of the level of selected metal accumulation in fish and sediment are discussed here.
Chapter 4 discusses the health and parasite composition by applying the HAI and associated Inverted PI in determining the health and condition factor of Clarias gariepinus and Labeo rosae.
Chapter 5 provides a short summary of the results, conclusion drawn and recommendations for future studies.
Chapter 6 contains references used in this dissertation. References referred to in separate chapters are included to avoid repetition.
Material and methods of each aspect are included in every relevant chapter.
The African Journal of Aquatic Science referencing method was followed for the dissertation write up. The EndNote™ vX6 Reference Management software (developed by Thomson Reuters) was used for referencing in this dissertation.
12
CHAPTER 2
WATER AND SEDIMENT QUALITY
2.1 INTRODUCTION
Water quality refers to the physical, chemical, biological and aesthetic properties of water which determines its fitness for a variety of uses and for protecting the health and integrity of aquatic ecosystems’ (DWAF 1996a). Water quality is one of the most important factors which influence an aquatic ecosystems integrity, as the distribution of aquatic freshwater organisms is controlled mainly by water quality characteristics, including dissolved oxygen, acidity and nutrient content (Dallas and Day 2004). It is not simple to describe what good water quality or how bad/poor it is without knowing its intended use. The quality of water required for drinking purposes is different from the quality of water irrigation, agricultural or industrial purpose (DWAF 1996a).
Therefore, when referring to water quality, certain criteria are followed for various water usages to sustain a healthy ecosystem (DWAF 1996c).
Water quality is determined by the activities in the catchment, the land use and the geology of the area. The Department of Water Affairs (DWA) published a series of South African Water Quality Guidelines (SAWQG’s) and strives to maintain South Africa’s aquatic ecosystem by maintaining water quality within the Target Water Quality Range (TWQR) (DWAF 1996). There are certain guidelines each for a specific water use; domestic, aquaculture (agriculture) and aquatic ecosystems (DWAF 1996a, DWAF 1996b, DWAF 1996c). The water quality criteria include various water constituents such as Target Water Quality Range (TWQR), the Chronic Effect Value (CEV) and the Acute Effect Value (AEV). The TWQR is the range of concentrations within which no measurable adverse effects are expected on the health of aquatic ecosystems, and should therefore ensure their protection. The CEV is defined as the concentration of a constituent at which there is expected to be a significant probability of measurable chronic effects to up to 5% of the species in the aquatic community.
The AEV is defined as that concentration of a constituent above which there is expected to be a significant probability of acute effects to up to 5% of the species in the aquatic community (DWAF 1996c). DWAF (1996c) described “system variables”
as the climatic fluctuations influence the physico-chemical parameters which then
13
influence the essential ecosystem process. System variables include all the parameters which regulate essential ecosystem processes and aquatic animal behaviour such as emersion of invertebrates and the spawning and migration of fish (DWAF 1996c).
The water column and sediment layer are in direct contact in aquatic systems. This leads to an exchange of constituents, including metals between these media (Adamset al. 2000). Sediment refers to particulate material that usually lies below water which originates from weathering and erosion of rocks or unconsolidated deposits and is transported by water, or suspended in water (US-EPA 2003). The sediment may accumulate excessive quantities of contaminants that directly and indirectly disrupt the ecosystem, causing a significant contamination and loss of desirable species if the loading of contaminants into the waterways is large enough (US-EPA 1997). This poses a threat to the aquatic environment, because sediments usually contain pollutant concentrations that are far higher than those of the overlying water (Förstner and Salomons 1980, Bervoetset al. 1994). Ensuring a good sediment quality is very important to maintain a healthy aquatic ecosystem, which ensures good protection of human health. In this study water and sediment quality were determined in conjunction with fish health, accumulation of metals in fish muscle tissue and human health risk to determine the impact of water constituents have on the health of fish and humans. In addition less research was conducted on sediment quality at the Phalaborwa Barrage.
2.2 METHODOLOGY
2.2.1 Water and sediment sampling and analyses
Water samples were collected in four seasons [autumn (May 2010), winter (July 2010), spring (October 2010) and summer (February 2011)] at three sites (inflow, wall and downstream: below wall). The four seasons were selected to determine seasonal differences. The different study sites were selected to determine the impact of the incoming water from upstream on the quality of the water, sediment and fish health at the barrage. The water samples were collected at a depth of 0.5 m with 1000 ml acid pre-treated propylene bottles (KartellTM) and immediately refrigerated. The physical- chemical water quality variables which include dissolved oxygen (DO), pH, water temperature, salinity, and electrical conductivity (EC) were determined at each site
14
during the four sampling surveys in situ by means of a handheld: YSI model 556 multipara-meter meter. The water samples were analysed for metals and inorganic salts using sequential Inductively Coupled Plasma- Optical Emission Spectrometry (ICP- OES) by an accredited laboratory in (WATERLAB) Pretoria. other water quality parameters: nutrients (total nitrogen and orthophosphate) and ions (chloride; sodium;
potassium; calcium; magnesium; fluoride and sulphate); and metals (Ag, Al, As, B, Ba, Be, Bi Cd, Co, Cr, Cu, Fe, Li, Mo, Mn, Ni, Pd, Sb, Se, Si, Sr, Ti, V and Zn) were all analysed at the accredited laboratory. DWAF (1996) and CCME (2012) water quality guidelines were used in this study to evaluate water quality parameters as there are no sediment guidelines for in South Africa.
Sediment samples were collected using a Friedlinger mudgrab (225 cm3) at the three sites (inflow, wall and below wall) during winter and summer. Three to five water and sediment samples were taken and composited then transferred to the 500 ml acid treated propylene sampling bottles and immediately refrigerated prior to laboratory analysis. The sediment samples were dried and digested in nitric and hydrochloric acids before metal analyses at a SANAS accredited laboratory. Metal concentrations were analysed by ICP-OES and recorded as mg/kg dry weight. Sediment were analysed according to Bervoets and Blust (2003).
2.2.2 Results analysis
Water quality results from the chemical laboratory were interpreted and compared to the South African Water Quality Guidelines (SAWQG) (Table 2.1). These results were compared with the TWQR, AEV and CEV for different water uses, where applicable and available. The US Environmental Protection Agency (USEPA) guidelines were also used for metals that did not appear in the South African water quality criteria for aquatic ecosystems. All collected data were analysed using one-way analysis of variance (ANOVA) in statistical package programme, SPSS version 12.0. The mean and standard deviation (calculated using Microsoft Excel) of the respective water quality data and sediment data were calculated for the seasons. A one way ANOVA was performed to determine whether there is any significant difference between samples seasonally and between sites and the difference was considered significant if the p value was less than 0.05.
15
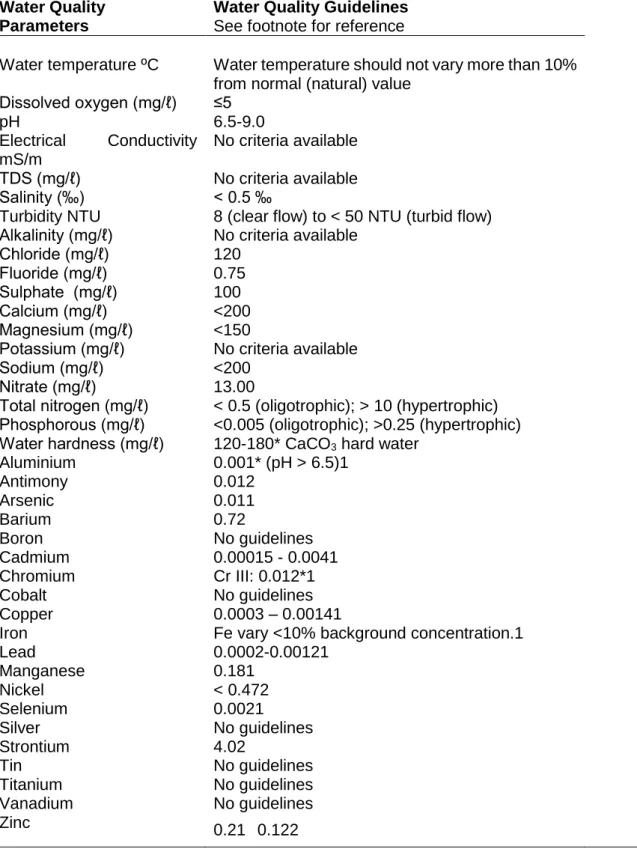
Table 2.1: Water quality guidelines for aquatic and domestic use Water Quality
Parameters
Water Quality Guidelines See footnote for reference
Water temperature ºC Water temperature should not vary more than 10%
from normal (natural) value Dissolved oxygen (mg/ℓ) ≤5
pH 6.5-9.0
Electrical Conductivity mS/m
No criteria available TDS (mg/ℓ) No criteria available Salinity (‰) < 0.5 ‰
Turbidity NTU 8 (clear flow) to < 50 NTU (turbid flow) Alkalinity (mg/ℓ) No criteria available
Chloride (mg/ℓ) 120
Fluoride (mg/ℓ) 0.75
Sulphate (mg/ℓ) 100 Calcium (mg/ℓ) <200 Magnesium (mg/ℓ) <150
Potassium (mg/ℓ) No criteria available Sodium (mg/ℓ) <200
Nitrate (mg/ℓ) 13.00
Total nitrogen (mg/ℓ) < 0.5 (oligotrophic); > 10 (hypertrophic) Phosphorous (mg/ℓ) <0.005 (oligotrophic); >0.25 (hypertrophic) Water hardness (mg/ℓ) 120-180* CaCO3 hard water
Aluminium 0.001* (pH > 6.5)1
Antimony 0.012
Arsenic 0.011
Barium 0.72
Boron No guidelines
Cadmium 0.00015 - 0.0041
Chromium Cr III: 0.012*1
Cobalt No guidelines
Copper 0.0003 – 0.00141
Iron Fe vary <10% background concentration.1
Lead 0.0002-0.00121
Manganese 0.181
Nickel < 0.472
Selenium 0.0021
Silver No guidelines
Strontium 4.02
Tin No guidelines
Titanium No guidelines
Vanadium No guidelines
Zinc 0.21 0.122
*water hardness: calculated using formula CaCo3 in (mg/ℓ) = (Ca mg/ℓ *2.5) + (Mg mg/ℓ*4.1) 1. DWAF (1996 a, b, c) South African Water Quality Guidelines
2. US-EPA (2012a) – United States Environmental Protection Agency: Water Quality Guidelines – Aquatic Life.
16
2.3 RESULTS AND DISCUSSION
The recorded seasonal water quality data for the surface water of the Phalaborwa Barrage water at each sampling site are shown in Appendix A. Tables 2.2 to 2.4 are the results of the analyses of the data and were compared water quality guidelines in Table 2.1.The seasonal mean values variation at each sampling site of all the water quality results are drawn in Figures 2.1 to 2.5. Sediment quality data is also shown in Appendix A and Table 2.5. Only the detectable water constituents were included in the data tables and figures.
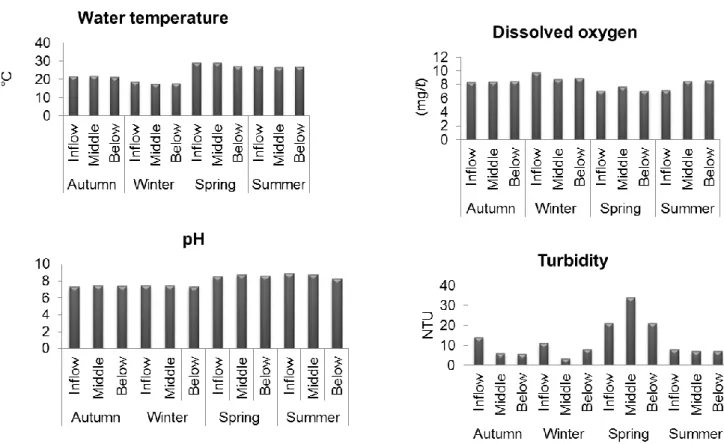
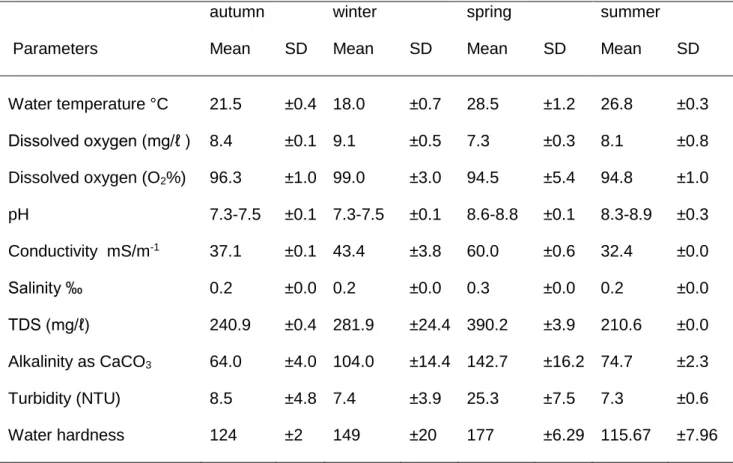
Figure 2.1: Seasonal mean concentrations for water quality data analysis: water temperature, dissolved oxygen, pH and turbidity at three sites at the Phalaborwa Barrage (May 2010- January 2011).
17
Table 2.2: The seasonal mean concentrations of (with standard deviations) physico- chemical in water (n=4) at the Phalaborwa Barrage (May 2010- January 2011)
autumn winter spring summer
Parameters Mean SD Mean SD Mean SD Mean SD
Water temperature °C 21.5 ±0.4 18.0 ±0.7 28.5 ±1.2 26.8 ±0.3 Dissolved oxygen (mg/ℓ ) 8.4 ±0.1 9.1 ±0.5 7.3 ±0.3 8.1 ±0.8 Dissolved oxygen (O2%) 96.3 ±1.0 99.0 ±3.0 94.5 ±5.4 94.8 ±1.0 pH 7.3-7.5 ±0.1 7.3-7.5 ±0.1 8.6-8.8 ±0.1 8.3-8.9 ±0.3 Conductivity mS/m-1 37.1 ±0.1 43.4 ±3.8 60.0 ±0.6 32.4 ±0.0
Salinity ‰ 0.2 ±0.0 0.2 ±0.0 0.3 ±0.0 0.2 ±0.0
TDS (mg/ℓ) 240.9 ±0.4 281.9 ±24.4 390.2 ±3.9 210.6 ±0.0 Alkalinity as CaCO3 64.0 ±4.0 104.0 ±14.4 142.7 ±16.2 74.7 ±2.3
Turbidity (NTU) 8.5 ±4.8 7.4 ±3.9 25.3 ±7.5 7.3 ±0.6
Water hardness 124 ±2 149 ±20 177 ±6.29 115.67 ±7.96
2.3.1 Physico-chemical parameters
Water temperature- the temperature in this study increased seasonally in this order winter, autumn, summer and spring (Table 2.2). The highest mean water temperature was recorded in spring (28.5 ºC ±1.2) and the lowest mean value was recorded in winter (18.0 ºC ±0.7) (Table 2.2). Temperatures measured were all above 25 ºC in spring and summer at all sampling sites (Figure 2.1). The lowest temperature was recorded at the dam wall during winter (17 ºC) and the highest at the inflow and the dam wall during spring (29 ºC) (Appendix A and Figure 2.1). Statistical analysis indicates no significant difference of water temperatures between different seasons (p>0.001) and the three sampling sites (f=0.039; df= 3 p>0.001). There is a direct relationship between temperature and dissolved oxygen, thus, any increase in temperature will result in a decrease in dissolved oxygen concentration. This was observed with the high temperature during spring that correlated with decreased dissolved oxygen. The temperatures recorded during this study fell in the range in good condition for both fish species and had thus no adverse effects on the host.
18
Water temperature could vary resulting from heated industrial effluent discharges, heated return flows, of irrigation water, removal of riparian vegetation cover and inter basin water transfers (DWAF 1996c). Higher temperatures reduce the solubility of dissolved oxygen in water, determines availability of nutrients and toxins, decreasing its concentration and thus its availability to aquatic organisms (DWAF 1996c, Dallas and Day 2004).
Dissolved Oxygen- the highest DO mean value of 9.1±0.5 mg/ℓ was recorded during winter, while the lowest mean value of 7.3 ±0.3 mg/ℓ was recorded during spring (Table 2.2). The highest DO value of 9.74 mg/ℓ was recorded in winter at the inflow and the lowest value of 7.13 mg/ℓ was recorded below the dam wall in spring. The dissolved oxygen concentrations at the inflow were higher during winter season than autumn spring and summer (Figure 2.1; Appendix A). ANOVA statistical analysis indicated that there is no significant difference between sites and seasons (p>0.05).
pH- the pH units recorded in this study were acceptable for aquatic ecosystems and ranged between 7.31 below the dam in winter to 8.91 at the inflow in summer (Table 2.2). Thus the pH of the surface water at the Phalaborwa Barrage was near neutral to slightly alkaline (Appendix A). The one-way ANOVA indicated no significant difference of pH units between the three sampling sites (F=0.10; df=2; p>0.05). The pH units in this study might have been affected by elevated levels of TDS and sulphate. In addition the pH of surface water may vary as a result of discharges of effluent (industrial, municipal), runoff, acidic rainfall and microbial activity (DWAF 1996c). The pH units should vary from 6 to 8 (Table 2.1) as suggested by DWAF (1996c). The pH units in this study were within the above-mentioned range except during spring and summer where slightly higher pH was recorded (Figure 2.1). However, the water quality guidelines for domestic use (DWAF 1996a) suggests that the pH of most natural waters lies between 6.5 and 8.5 (Table2.1) because of the geology and geochemistry of underlying rocks and soils. If this is taken into consideration, then the pH in this study are still within the acceptable range.
Turbidity- the highest mean turbidity value was recorded in spring (25.3 ±7.5 NTU) and lowest in summer (7.3 ±0.6NTU) (Table 2.2). There are no target water quality ranges for turbidity for aquatic ecosystems, however aquaculture guidelines indicate
19
that <25NTU is an acceptable turbidity for clear water species (DWAF 1996b). In this study the turbidity values were within TWQR for clear water fish species (<25 NTU) (Table 2.1) for all seasons except in spring (Figure 2.1). The highest turbidity value of 34 NTU was recorded at the dam wall in spring and the lowest value of 0.7 NTU at the dam wall and below the dam in summer (Appendix A and Figure 2.1). There was no significant difference between alkalinity recorded in each site however, seasonal differences were observed (F= 0.05, df=2 p>0.05). The high turbidity value recorded in spring correlates with a study conducted by Ramollo (2008) during 2005 and 2006 in the Phalaborwa Barrage indicating the highest mean value of 40.8 NTU at the barrage.
The effects of high turbidity values include severe aesthetic effects such as appearance, taste and odour; and significant effects on the microbiological quality of the water (DWAF 1996a). This high turbidity values could lead to poor visibility and reduced feeding rates for fishes living in the system. These also prevent sunlight from reaching plants below the surface thus can reduce the rate of photosynthesis, so less oxygen is produced by plants. (Dallas and Day 2004). Geology, anthropogenic activities (industrial, mine discharges, sewage discharge) can contribute significantly to the high or low turbidity levels at a specific site. Turbidity may harm fish and their larvae (Davies and Day 1998).
Total Dissolved Solids (TDS) - the TDS concentrations ranged from 210.6 mg/ℓ to 393.9 mg/ℓ (Appendix A). The highest values were recorded below the dam (310.1 mg/ℓ) and lowest at the dam wall (267.2 mg/ℓ) with no significant difference much among sites (p>0.05) (Figure 2.2). Seasonally, the highest TDS concentrations were recorded during spring (390.2 ±3.9 mg/ℓ) with the lowest during summer (210.6 ±0.0 mg/ℓ) (Table 2.2). All recorded TDS values in all surveys were within the TWQR for domestic use (DWAF 1996a) but exceeded TWQR for aquaculture according to DWAF (1996b) (Table 2.1).
20
Figure 2.2: Seasonal mean concentrations for water quality data analysis: total dissolved solids, electrical conductivity, salinity, alkalinity and water hardness at three sites at the Phalaborwa Barrage (May 2010- January 2011).
The one-way ANOVA indicated a significant difference in TDS between seasons, F=121.064; df=3; p<0.001. The TDS is directly proportional to EC of water. Naturally, all water contains varying concentrations of TDS as a result of the dissolution of minerals in rocks, geological weathering, atmospheric conditions, soils, and decomposing plant material. However, domestic and industrial discharges and surface runoff from urban and evaporation can also increase the TDS levels. TDS at high or low concentrations may limit growth of organisms and may eventually lead to death. It also reduces penetration of light, smother and clog surfaces (e.g. gills) and absorb nutrients and toxins (Dallas and Day 2004).
21
Electrical conductivity (EC)- electrical conductivity, along with TDS, serves as a general indicator of change in water quality and affects the taste and freshness of the water (DWAF 1996a).
The highest mean value of EC (60.0 ±0.6 mS/cm) was recorded in spring while the lowest mean value (32.4 ±0.0 mS/cm) was recorded in summer (Figure 2.2). The EC at the Phalaborwa Barrage ranged from 32 mS/cm at all sites in summer to 61 mS/cm at the wall in spring with a mean value of 43 mS/cm (Figure 2.1; Appendix A). The one-way ANOVA for this parameter indicate a significant difference of EC between seasons (F=121.064; df=3; p<0.001). During spring survey the anions (chloride, sulphates and fluoride), cations (calcium, magnesium, potassium and sodium) concentrations were higher than the other seasons (Figure 2.2, Table 2.3).
Salinity- salinity is the saltiness of water (Dallas and Day 2004). Salinity levels varied among seasons, the highest mean salinity value was recorded during spring survey (0.3 ±0.0 ‰) and lowest value was recorded during summer (0.2 ±0.0 ‰) (Figure 2.2, Table 2.2). The salinity of the surface water at the barrage was in the water quality range for freshwater (<0.5‰) (Table 2.1). The highest salinity was recorded in spring at all sites and the lowest in summer also at all sites (Appendix A). Changes in salt concentrations can have adverse effects on aquatic biota, ecological and microbial processes like rates of nutrient cycling and metabolism (Davies and Day 1998).
Alkalinity- the highest mean alkalinity value was recorded in spring (142.7±16.2mg/ℓ) and the lowest mean in autumn (64 ±4.0 mg/ℓ) (Table 2.2). During spring, alkalinity values were significantly higher than the TWQR for aquaculture (20-100 mg/ℓ) (Table 2.1). The alkalinity values for autumn, winter and summer were all within the TWQR for aquaculture (DWAF 1996c). The highest alkalinity was recorded at the wall during spring while the lowest was recorded at the inflow in autumn (Appendix A and Figure 2.2). There was no significant difference between alkalinity recorded in each site however, a significant difference was observed seasonally (F= 0.05, p>0.05). A low water alkalinity has a low buffering capacity and can be susceptible to alterations in pH, for example from atmospheric, acidic, deposition (Dallas and Day 2004).
22
Figure 2.3: Seasonal mean concentrations for water quality data analysis: water hardness; chloride; fluoride and sulphate at the three sites at the Phalaborwa Barrage (May 2010- January 2011).
Water hardness- water hardness refers to the sum of the calcium and magnesium concentrations, expressed as mg/ℓ of calcium carbonate. The results indicate that the water at the Phalaborwa Barrage is moderately hard in summer at the wall and below the dam and became hard during autumn and winter at all sites (Figure 2.3). The lowest mean value was recorded in summer and highest value was recorded in spring at the wall (Table 2.2). The highest mean water hardness value was recorded in spring (177±6.29 mg/ℓ) and the lowest mean in summer (115.67 ±7.96 mg/ℓ) (Table 2.2).
Water hardness values between 60 and 120 mg/ℓ calcium carbonate are classified as moderately hard water while the one between 121 and 180 mg/ℓ calcium carbonate are classified as hard water (DWAF 1996a, Dallas and Day 2004) (Table 2.1). The
23
surface water of the barrage during summer at the wall and below the dam wall is considered moderately hard and hard during autumn and winter.
Major ions
Major ions are not toxic at low concentrations; however, they may induce toxic effects on aquatic biota and water users at high concentrations (Dallas and Day 2004).
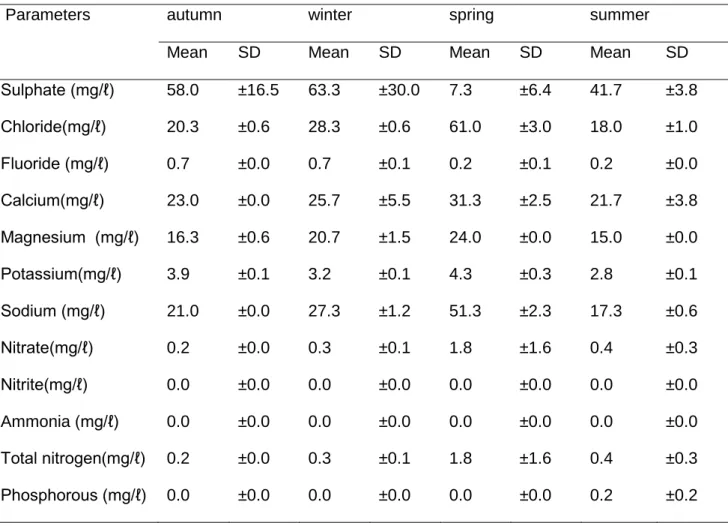
Table 2.3: The seasonal mean concentrations (with standard deviations) of inorganic nitrogen, phosphorous and major ions (n=4) recorded at the Phalaborwa Barrage (May 2010- January 2011)
Parameters autumn winter spring summer
Mean SD Mean SD Mean SD Mean SD
Sulphate (mg/ℓ) 58.0 ±16.5 63.3 ±30.0 7.3 ±6.4 41.7 ±3.8 Chloride(mg/ℓ) 20.3 ±0.6 28.3 ±0.6 61.0 ±3.0 18.0 ±1.0
Fluoride (mg/ℓ) 0.7 ±0.0 0.7 ±0.1 0.2 ±0.1 0.2 ±0.0
Calcium(mg/ℓ) 23.0 ±0.0 25.7 ±5.5 31.3 ±2.5 21.7 ±3.8
Magnesium (mg/ℓ) 16.3 ±0.6 20.7 ±1.5 24.0 ±0.0 15.0 ±0.0
Potassium(mg/ℓ) 3.9 ±0.1 3.2 ±0.1 4.3 ±0.3 2.8 ±0.1
Sodium (mg/ℓ) 21.0 ±0.0 27.3 ±1.2 51.3 ±2.3 17.3 ±0.6
Nitrate(mg/ℓ) 0.2 ±0.0 0.3 ±0.1 1.8 ±1.6 0.4 ±0.3
Nitrite(mg/ℓ) 0.0 ±0.0 0.0 ±0.0 0.0 ±0.0 0.0 ±0.0
Ammonia (mg/ℓ) 0.0 ±0.0 0.0 ±0.0 0.0 ±0.0 0.0 ±0.0
Total nitrogen(mg/ℓ) 0.2 ±0.0 0.3 ±0.1 1.8 ±1.6 0.4 ±0.3 Phosphorous (mg/ℓ) 0.0 ±0.0 0.0 ±0.0 0.0 ±0.0 0.2 ±0.2
24
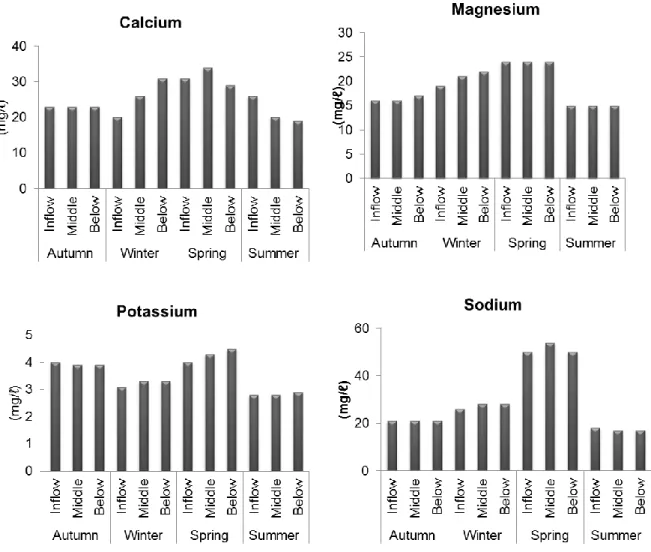
Figure 2.4: Seasonal mean concentrations for water quality data analysis: calcium;
magnesium; potassium and sodium at three sites at the Phalaborwa Barrage (May 2010- January 2011).
Anions: Chloride; fluoride and sulphate
Chloride mean concentrations ranged from in summer to in spring (Table 2.3). The highest mean chloride value was recorded in spring (61 ±3.0 mg/ℓ) and the lowest mean in summer (18 ±1.0 mg/ℓ) (Table 2.2). The highest chloride concentrations were recorded below the dam (64 mg/ℓ) in spring with the lowest concentrations below the wall in (14 mg/ℓ) summer but there was no significance difference among sites (Figure 2.3; Appendix A). Chloride levels recorded in this study were all below the detection concentration (limit) of 10 mg/ℓ which showed no concern (Table 2.1). The detection limit is within the TWQR for domestic use but higher than the TWQR and the CEV for