EFFECT OF PROTEIN QUALITY ON OPTIMAL DAILY
PROTEIN SUPPLY FOR JUVENILE OF PATIN
(Pangasianodon hypophthalmus)
THESIS
DIAN RETNOSARI
GRADUATE SCHOOL
BOGOR AGRICULTURAL UNIVERSITY
BOGOR
DECLARATION
I do hereby declare that the thesis entitled “Effect of Protein Quality on
Optimal Daily Protein Supply for Juvenile of Patin (Pangasianodon
hypophthalmus)” is my original work produced through the guidance of my supervisors and that to the best of my knowledge it has not been presented for the award of any degree in any university. All of the incorporated material originated from other published as well unpublished papers and are stated clearly in the text as well as in the reference.
Bogor, May 2010
Dian Retnosari
ABSTRACT
DIAN RETNOSARI. Effect of Protein Quality on Optimal Daily Protein Supply for Juvenile of Patin (Pangasianodon hyphophthalmus). Under direction of DEDI JUSADI, and YANN MOREAU.
Two types of diet with different protein quality were formulated, namely High Fish Meal (HFM with 46.8 g CP kg-1) and Low Fish Meal (LFM with 46.3 g CP kg-1). Feeding rates were calculated to provide six different protein supplies 8, 14, 20, 23, 26, and 30 g kg-1 day-1 to duplicate groups of fish. Fishes were 3-inch length with an average mass 6.4±0.2 g. The density was 12 fish per aquarium. Daily ration was given in the 3 equal meals at 08.00, 12.00 and 16.00 for 6 weeks. Amino acid profiles show that HFM diet fulfilled requirement according to recommendations for channel catfish, while LFM diet appeared deficient in lysine. The specific growth rate, food conversion ratio, body fat, protein retention, fat retention and protein efficiency ratio were significantly different among treatments. On contrary, dry matter, protein, ash, gross energy did not differ significantly between treatments. Both dry matter and protein digestibility led to similar values for the two diets. Regarding response to protein supply, the results indicated that higher protein supply was required to reach maximum growth with LFM (17.8 g kg-1 day-1 for 2.04% day-1) than with HFM (16.1 g kg-1 day-1 for 2.5% day-1) diet. This suggests that increase in protein supply may partially compensate lower growth with lower dietary protein quality.
iii SUMMARY
DIAN RETNOSARI. Effect of Protein Quality on Optimal Daily Protein Supply for Juvenile of Patin (Pangasianodon hyphophthalmus). Under direction of DEDI JUSADI, and YANN MOREAU.
Objective of this research was to study the effect of protein quality on optimal daily protein supply for juvenile of patin (Pangasianodon hypophthalmus). Previous studies concluded that the level and source of dietary protein significantly influenced the performance of channel catfish with supplemental amino acid such as crystalline lysine. While other studies suggested that amino acid in intact protein are more efficient than those provided in crystalline form because the latter are absorbed and catabolised more rapidly than the former ones. The present study aimed to provide information on dependence of growth to amino acid supply using a mixture of complementary proteins, in which different protein sources were mixed to modify the dietary amino acid profile.
This experiment used 3-inch patin juveniles with an average mass 6.4±0.2 g and density was 12 fish per aquarium. Two types of diet with different protein quality were formulated, namely High Fish Meal (HFM with 46.8 g CP kg-1) and Low Fish Meal (LFM with 46.3 g CP kg-1). Feeding rates were calculated to provide six different protein supplies 8, 14, 20, 23, 26, and 30 g kg-1 day-1 to duplicate groups of fish. The experimental period lasted for 6 weeks with weekly sampling to adjust daily ration. Daily ration was given in the 3 equal meals at 08.00, 12.00 and 16.00. Observed parameters were specific growth rate, survival rate, feed conversion ratio, protein retention, fat retention, and feed digestibility, as well as proximate body composition. Water quality (ammonia-N, pH, O2,
temperature and conductivity) was monitored weekly.
iv ratio. In the present study, higher protein supply is effectively required for maximum growth with LFM diet.
Copyright © 2010, by Bogor Agricultural University
All rights reserved
1. No part or all of this thesis may be excerpted without inclusion or mentioning the sources
a. Excerption only for research and education use, writing for scientific papers, reporting, critical writing or reviewing of a problem
b. Excerption does not inflict a financial loss in the proper interest of Bogor Agricultural University
EFFECT OF PROTEIN QUALITY ON OPTIMAL DAILY
PROTEIN SUPPLY FOR JUVENILE OF PATIN
(Pangasianodon hypophthalmus)
DIAN RETNOSARI
Thesis
submitted in partial fulfillment of Master of Science degree in
Study Program of Aquaculture Science
GRADUATE SCHOOL
BOGOR AGRICULTURAL UNIVERSITY
BOGOR
Title of Thesis : Effect of Protein Quality on Optimal Daily Protein Supply for Juvenile of Patin (Pangasianodon hypophthalmus)
Name : Dian Retnosari Registration Number : C151070261
Approved
Advisors
Dr. Dedi Jusadi Dr. Yann Moreau
1st Advisor 2nd Advisor
Acknowledged
Head of Study Program Dean of Graduate School of Aquaculture Science
Prof. Dr. Enang Harris Prof. Dr. Ir. Khairil Anwar Notodiputro, M.S
ACKNOWLEDGEMENTS
I feel pleasure to express my sincere thanks and gratitude to my supervisor Dr. Dedi Jusadi and Dr. Yann Moreau for his relentless effort, guidance, supervision, encouragement and warm-hearted intelligence throughout my study at the Study Program of Aquaculture Science, Bogor Agricultural University. I do gratefully acknowledge the project and financial from the Institut de Recherche pour le Développement for this study. I wish to express my sincere appreciation and thanks to Rina Hirnawati, S.Pi, Nina Meilisza, M.Si and Ika Ayuningtyas, S.Si for their friendly help and co-operation with all analyses in the Nutrition Laboratories of IRD-BRBIH, Depok. Thanks are also due to Ruby Vidia Kusumah, S.Pi, Sawung Cindelaras, S.Pi, Rachmawati, S.Si and Irmayanti, S.Pi for their helpness along the experiment. My thanks are also extended to the technicians especially Subur. My heartfelt respect and special thanks must go to my beloved parents, brother, sister in law and all relatives back home whose sublime blessings, love and sacrifice inspired me most in my voyage to learning. Most especially I must thank to my friends in Aquaculture Science class of 2007 and lovely neighbour room, they are all my well-wishers. Finally, and by no means least important, I pledge my abiding gratitude to Deny Sapto Chondro Utomo, S.Pi for his helpness, patience, support and constant inspirations that undoubtedly helped me keep my sanity all through these hard times.
AUTOBIOGRAPHY
The author was born in Tanjung Karang, June 19th 1984 from a father named Sarwadi, ST and a mother named Sriyani, A.Md. Author is a youngest child from two children.
xii
LIST OF TABLE
Page
1. Nutrient requirement of catfishes ... 8
2. Amino acid requirement of catfishes ... 9
3. Diets formulation ... 13
4. Experimental design with fixed protein supply ... 14
5. Average initial and final body mass, growth rate, and food conversion ratio according to diet and protein supply ... 19
6. Average of body composition according to diet and protein supply ... 20
7. Average of protein retention, fat retention, and protein efficiency ratio according to diet and protein supply ... 21
xiii
LIST OF FIGURE
Page
1. The fate of dietary protein ... 4 2. Patin (Pangasianodon hypophthalmus) ... 6 3. Dietary with good and bad protein content to satisfy
catfish requirement ... 10 4. Satisfying catfish requirement by increasing amount of
protein bound-lysine ... 11 5. Average mass gain (± SE) of patin fed on HFM diet during
experiment according to protein supply in g kg-1 day-1.
Each value corresponds to two observations ... 17 6. Average mass gain (± SE) of patin fed on LFM diet during
experiment according to protein supply in g kg-1 day-1.
Each value corresponds to two observations ... 18 7. Amino-acid profile in each feed compared with channel
catfish requirement (g kg-1 protein) ... 22 8. Broken line model adjusted to specific growth rate (SGR) of
patin juveniles according to daily protein supply with the two experimental diets over 33 days. Italic values indicated
minimum protein supply for maximal growth with each diet .. 23
xiv
LIST OF APPENDIX
Page
1. Proximate analysis of feed ingredients ... 34
2. Diet preparation procedure ... 35
3. Proximate analysis procedures ... 36
4. Random disposition of aquaria experiment ... 47
5. SGR and FCR calculation ... 48
6. Protein retention calculation ... 49
7. Fat retention calculation ... 50
8. Proximate analysis of patin body ... 51
9. ANOVA and Tukey test of SGR ... 52
10. ANOVA and Tukey test of FCR ... 53
11. ANOVA and Tukey test of PR ... 54
12. ANOVA and Tukey test of FR ... 55
13. ANOVA and Tukey test of PER ... 56
14. ANOVA and Tukey test of dry matter ... 57
15. ANOVA and Tukey test of protein ... 57
16. ANOVA and Tukey test of fat ... 58
17. ANOVA and Tukey test of ash ... 58
18. ANOVA and Tukey test of GE ... 59
19. Amino acid calculation ... 60
I. INTRODUCTION
1.1 Background
Patin (Pangasius sp.) is one of the eight pre-eminent species of aquaculture product that has been developed in Indonesia. This fish became a pre-eminent species when the technology for its culture has been controlled and disseminated to the public (DKP 2005). Expansion of patin production often faces constraint in culture management, feed, pest and disease. Therefore, efforts are needed to overcome these problems among them, a correct feeding either in quality and quantity. For the quality, fish requires feed with good nutritional value, easy to digest and easy to absorb.
Nutritional value of feed depends on its composition such as protein, carbohydrate, fat, vitamin, mineral and energy content. A fish feed must contain enough protein for growth and also for maintenance. Requirement of protein is different according to fish species, fish size, feedstuffs, protein quality and environment (NRC 1983). Its requirement will decrease along with size and age and it will increase along with temperature (Halver 2002). The availability of dietary protein can vary considerably among different feedstuffs. Fish meals are the primary source of protein in fish diet, including in the diet of channel catfish as they can provide all of the dietary essential amino acids required for growth, with a more favorable ratios. However, the high cost of fish meal has led to use alternative protein sources in catfish feeds.
2 Amino acids can be provided in the form of intact protein as feed ingredients or purified, -crystalline form as dietary supplements. The increased use of plant proteins in catfish diets during recent years led to increase use of purified amino acids to avoid deficiencies associated to high levels of plant products. For example, dietary L-lysine can be supplemented in purified form to eliminate the lysine deficiency in soybean meal (El-Saidy & Gaber 2003). Evidence for other fish than catfish (Cowey & Sargent 1979, Thebault et al. 1985) suggests that amino acids in intact protein are more efficient than those provided in crystalline form. This is, possibly due to the fact that crystalline amino acids are absorbed and catabolized more rapidly than amino acids from intact proteins.
Amino acid requirements can be met by feeding mixtures of complementary proteins and by supplementing deficient proteins with crystalline amino acids. The practice of using supplemental amino acids to improve the inferior quality of protein sources in catfish diets raises some questions. Studies have shown that crystalline amino acids may not be absorbed from the intestine in a manner that promotes effective utilization.
The best method to provide adequate amino acid nutrition to the channel catfish may be using a mixture of complementary proteins, in which different protein sources are mixed effectively to meet the dietary amino acid requirements. However, in some diet formulations, amino acids might have to be supplemented in purified form to meet minimum requirements.
1.2 Objective
The objective of this research is to study the effect of protein quality on determination of optimal daily protein supply for juvenile of patin (Pangasianodon hypophthalmus).
1.3 Hypothesis
II.LITERATURE REVIEW
2.1 Protein and Amino Acid
Protein is a very important constituent of diet, both qualitatively and quantitatively, as it is the building material for the growing animal organism and is also important for the production of enzymes, among other things. Amino acids are the building blocks which formed proteins. There are 20 amino acids used as building blocks for the proteins in all living organisms. Amino acids composition in a feedstuff protein is of overriding importance for definition of its quality, and determines its value as a feed constituent (Steffens 1989).
Amino acids may be classified as either essential or non-essential. Ten amino acids are essential for fish, meaning that they cannot be synthesized in sufficient quantity for body needs; thus, they must be supplied in the diet. A
non-essential amino acid is one that can be synthesized by the animal in sufficient
quantity for maximal growth. Both essential and non-essential amino acids are
required by body cells whenever proteins are being synthesized.
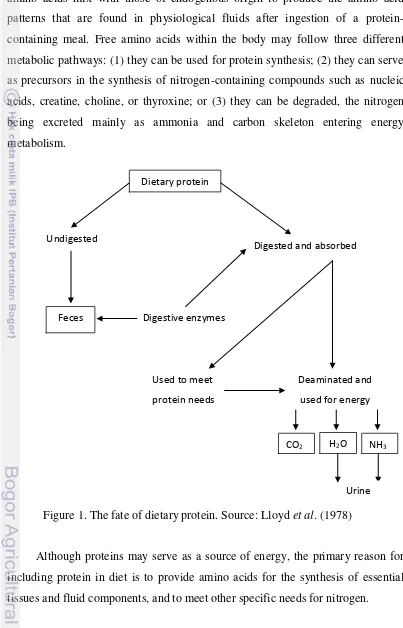
2.1.1 Fate of Protein
Utilization of dietary proteins in metabolism requires that the protein molecules were degraded to their constitutive amino acids. The reaction is catalyzed by a group of enzymes referred collectively as the proteolytic enzymes. The action of these enzymes is rather selective. The different enzymes preferentially split peptide bonds adjacent to particular amino acids. This selectivity depends upon the nature of the side chains of the amino acids.
4 Dietary protein
Undigested
Digested and absorbed
Feces Digestive enzymes
CO2 H2O NH3
Deaminated and used for energy Used to meet
protein needs
Urine
Dietary protein enters the portal bloodstream as free amino acid. These amino acids mix with those of endogenous origin to produce the amino acid patterns that are found in physiological fluids after ingestion of a protein-containing meal. Free amino acids within the body may follow three different metabolic pathways: (1) they can be used for protein synthesis; (2) they can serve as precursors in the synthesis of nitrogen-containing compounds such as nucleic acids, creatine, choline, or thyroxine; or (3) they can be degraded, the nitrogen being excreted mainly as ammonia and carbon skeleton entering energy metabolism.
Figure 1. The fate of dietary protein. Source: Lloyd et al. (1978)
5
2.1.2 Amino Acid Requirement
Cowey and Tacon (1983) suggested that the indispensable amino acid requirements of a fish should be related, or even governed, by the pattern of amino acids present in muscle tissue. Imbalances in the amino acid profile of the diet may depress feed intake and reduce efficiency of utilization of essential amino acid. Harper et al. (1964) suggested that plasma amino acids stimulate the synthesis or inhibit the breakdown of proteins in the liver which implies a decreased supply of the limiting essential amino acid in tissues. Consequently, the free amino acid pattern of plasma and tissue becomes imbalanced which is detected by the appetite regulating system in the brain. As a consequence, feed intake is reduced and this reduction on feed intake is at the origin of the growth depression effect of amino acid imbalances.
The ideal protein concept is based on the idea that there should be a direct correlation between the whole body amino acid pattern of the animal and the dietary amino acid requirements of the animal. This is essentially with the same A/E ratios (indispensable amino acid content/total indispensable amino acid content). The A/E ratios have been used as a means to estimate the requirements of all indispensable amino acids when only one is known by comparing the A/E ratio of indispensable amino acid to the A/E ratio of the known same amino acid (Wilson 2002).
6 the most or second most limiting amino acid; thus more is known about the requirements for lysine than other amino acids (Miles & Chapman 2007).
2.2 Patin (Pangasianodon hypophthalmus)
2.2.1 Classification and Morphology of Patin
Classification of patin according to Gustiano (2003) be as follows: Kingdom : Animalia
Phylum : Chordata Sub phylum : Vertebrata Class : Actinopterygii Sub class : Teleostei Order : Siluriformes Set of relatives : Pangasiidae Gender : Pangasianodon
Species : Pangasianodon hypophthalmus
Figure 2. Patin (Pangasianodon hypophthalmus). Source: www.fisheries.go.th
Pangasianodon hypophthalmus has a terminal mouth, with tooth band of upper jaw entirely covered by lower jaw when mouth is closed. Two pairs of narrow vomerine tooth band disappearing ontogenetically. Single chambered swimbladder with slender posterior part. This species is an air-breathing catfish that uses the swimbladder as an accessory respiratory organ (Brownman & Kramer 1985). The color of juveniles, typically with well defined midlateral and abdominal stripes separated at level of pectoral fin origin. Stripe although fainter posteriorly, sometimes extending to upper above end of anal fin. Larger specimens are less distinctively colored (Gustiano 2003).
7 high as 3 mg L-1. Optimal water temperature for growth ranges from 28°-30°C, and pH 5-9 (Stickney 1993). Concentration of ammonia must remain less than 1.5 mg L-1 (Harimurti et al. 1995).
2.2.2 Protein and Amino Acid Requirement
Fish need feed with nutritional component which is appropriate to the size and the species. The basic diet for fish must contain sufficient levels of high quality protein and energy as well as balance essential fatty acids, vitamins and minerals. Information about nutrient requirement of patin remains scarce, thus information available for channel catfish are often used.
2.2.2.1 Protein Requirement
Young fish require higher protein level compared to larger fish as their metabolic and growth rate are higher (Stickney & Lovell 1977). Generally, catfish species requires protein level ranging 35-45% in its diet (NRC 1993). Gaylord and Gatlin (2001) reported that the growth rate of channel catfish increased when they fed on high protein (37%) and high energy diets (3.6 kcal DE/g). Protein requirements of channel catfish fry are higher than those of fingerling or adult fish. Protein levels of 52% and 40% are required for catfish fry and fingerling weighing 0.02 g and 20 g, respectively (Robinson et al. 1994).
Based on weight gain, FCR (Food Conversion Ratio), PER (Protein Efficiency Ratio) and ANPU (Apparent Net Protein Utilization11), Hung (1999) estimates the dietary protein requirement for Pangasius bocourti and P. hypophthalmus as 16 and 17 g CP kg-1 fish day-1, with an energy supply of 1150 and 900 kJ GE kg-1 fish day-1. For P. bocourti, P. djambal, and P. hypophthalmus, Hung et al. (2004) obtained 90% of the maximal specific growth rate for energy with a energy supply of 1212, 1084, and 952 kJ GE kg-1 day-1, respectively with a nearly 20 MJ per kg diet. In a study comparing utilization of carbohydrates in P. bocourti and P. hypophthalmus, growth rate was not affected by gross energy
supply as high as 833 kJ GE kg-1 day-1 corresponding to a dietary energy content of 20 MJ kg-1 (Hung et al. 2003). For all these studies, feeding rates leading to
1
8 higher growth range from 30 to 50 g diet kg-1 day-1 with a dietary protein to energy (P/E) ratio from 16 to 20 mg CP kJ-1. Protein requirement for other catfishes is given in Table 1.
Table 1. Nutrient requirement of catfishes
Species
Clarias anguillaris 400 Madu and Tsumba (1989)
C. batrachus 395 31* Mollah and Hussain
(1990)
310 24.2-25.8 Rabegnatar and Hidayat (1992)
Ictalurus punctatus 320 25** NRC (1993)
**Satoh et al. (1989)
Mystus nemurus 420 27* Khan et al. (1993)
291 20,76 63.5 Kurnia (2002) 350 29.36 129.1 Suryanti et al. (2003)
Pangasius sutchi 250 Chuapoehuk and
Pothissong (1985)
9 Dispensable amino acids can be synthesized by catfish, but there are certain
advantages if they are provided in the diet. Practical catfish feeds contain liberal
amounts of dispensable amino acids inherent in the proteins of various feedstuffs.
Channel catfish have been shown to require the same 10 indispensable amino acids as other fish. The quantitative requirements for these indispensable amino acids are summarized in Table 2.
Table 2. Amino acid requirement of catfishes Essential
Amino Acid
Requirement (g kg-1 protein)
African Catfish Channel Catfish Clarias hybrid
Arginine 45 43* 17.8-20
Reference Fagbenro et al. (1999)
The dietary non-essential amino acids supplied in a diet, while not required, help to promote growth by reducing the need for amino acid synthesis, which saves energy (Tucker & Robinson 1991). During the digestion process, the rates of release and absorption of amino acids influence the dietary value of a protein source.
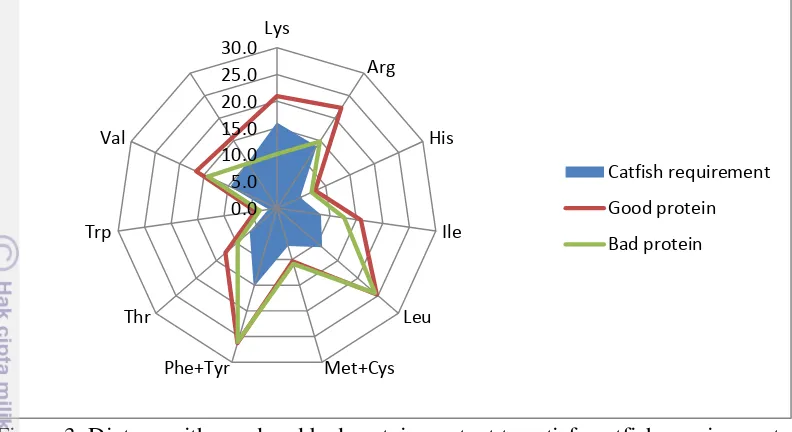
10 Figure 3. Dietary with good and bad protein content to satisfy catfish requirement.
From the radar plot above, supply from dietary with bad protein content can not satisfied catfish requirement; while the good protein can satisfied the catfish requirement, even some amino acids are in excess. Surplus amino acids supply by one protein has no adverse effect on the animal (Lloyd et al. 1978). This appears to be true for most diets composed with natural feedstuffs. If an indispensable amino acid is in excess then it will be catabolised, while if it is deficient the growth will be limited.
Crystalline amino acid supplementation is a way to override amino-acid deficiency resulting from incorporation of low quality protein in the diet. However, if growth improvements are observed the utilization of such crystalline amino acid can lead to various problems (Halver 1957).
Several researchers (Yamada et al. 1981, Murai et al. 1987, Schuhmacher et al. 1993) have demonstrated that amino acid concentrations in blood plasma
increased more rapidly, and reached a peak level more quickly, after feeding crystalline amino acids than after feeding intact proteins. Cowey and Walton (1988), made similar observations when they measured the increase in radioactivity in the blood of rainbow trout after feeding pellets containing either
14
C-labeled amino acids or 14C-labeled protein. The lower growth rates and higher feed conversion ratios of rainbow trout fed crystalline amino acids have been attributed to a rapid uptake of amino acids from the gut into the peripheral blood,
11 leading to the deamination of the amino acids in excess and to higher rate of nitrogen excretion (Yamada et al. 1981, Cowey & Walton 1988).
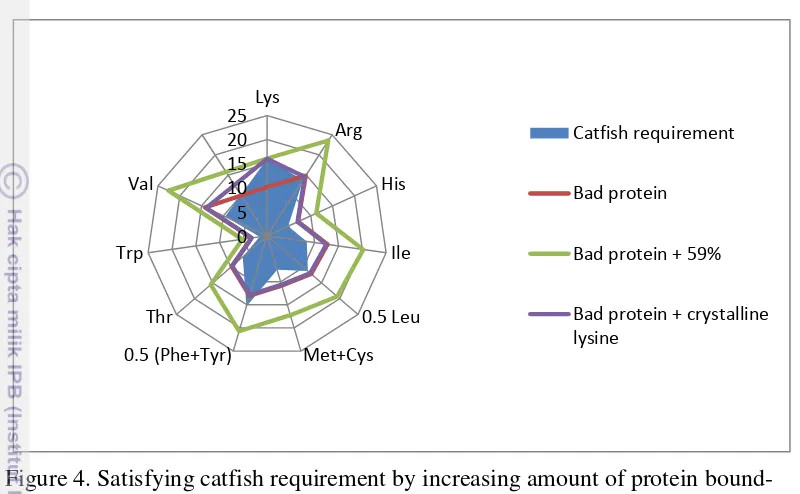
Figure 4. Satisfying catfish requirement by increasing amount of protein bound-lysine.
Faster absorption of free amino acid may lead to transient amino acid imbalances and consequently to decreased protein utilization if crystalline amino acid is used to supplement dietary protein. Then giving dietary protein bound-lysine must be better than supplementation crystalline bound-lysine to meet requirement of amino acid. This can be achieved by mixing protein with complementary amino acid profile, or by increasing protein supply in order to provide adequate amount (on absolute basis) of the target missing amino acid. Considering the low quality protein example previously, a 59% increase in protein supply may meet catfish requirement for lysine (Figure 4).
III. MATERIALS AND METHODS
3.1 Rearing Condition
The experiment was conducted at Balai Riset Budidaya Ikan Hias (BRBIH) Depok, West Java with the support of Institut de Recherche pour le Développement. Fishes were 3-inch patin juvenile (Pangasianodon hypophthalmus) with an average mass 6.4±0.2 g. Density was 12 fishes per 60 L
for each aquarium (50 cm x 40 cm x 40 cm). These fishes were obtained from Balai Besar Pengembangan Budidaya Air Tawar (BBPBAT) Sukabumi, West Java.
Before rearing, patin juvenile were being adapted to low fish meal diet during one week. The experimental period lasted 6 weeks with various daily protein supplies. Daily ration were given in the 3 equal meals at 08.00, 12.00 and 16.00. Aquariums were cleaned by siphoning every morning before first meal (07.00 am). Fish biomass was recorded every week to adjust daily ration in each aquarium. Prior to sampling, fishes were anesthetized with 600 µL L-1 eugenol solution (10% in ethanol).
Water quality (ammonia-N, pH, O2, temperature and conductivity) was
monitored weekly.
3.2 Diets
Feeds were prepared using fish meal (Chile), soybean meal (India), corn meal (local market), wheat gluten meal (Australia), palm oil (local grocery), corn oil, fish oil (Aphytec, France), vitamin, mineral (Agrobase®, France) and binder (Carboxyl Methyl Cellulose). The formulations were given in below (Table 3).
3.3 Chemical Analysis
13 end of experimental period to measure protein and fat retention level. Proximate of faeces were conducted to measure total of feed digestibility.
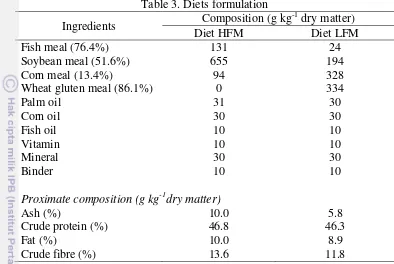
Table 3. Diets formulation
Proximate composition (g kg-1dry matter)
Ash (%) 10.0 5.8
Crude protein (%) 46.8 46.3
Fat (%) 10.0 8.9
Crude fibre (%) 13.6 11.8
3.4 Feed Digestibility Test
Feed digestibility tests were conducted after treatment period. The diet was formulated to contain 5 g chromic oxide (Cr2O3) kg-1 in addition to experimental
formula. Fish were fed to satiation and faeces collected 2 hours after feeding with a siphon. Faeces were collected over one week after 2 days acclimation to the new diet (Moreau 1991). Samples were pooled before analysis and bigger fish were used to maximise the mass of collected faeces.
3.5 Experimental Method
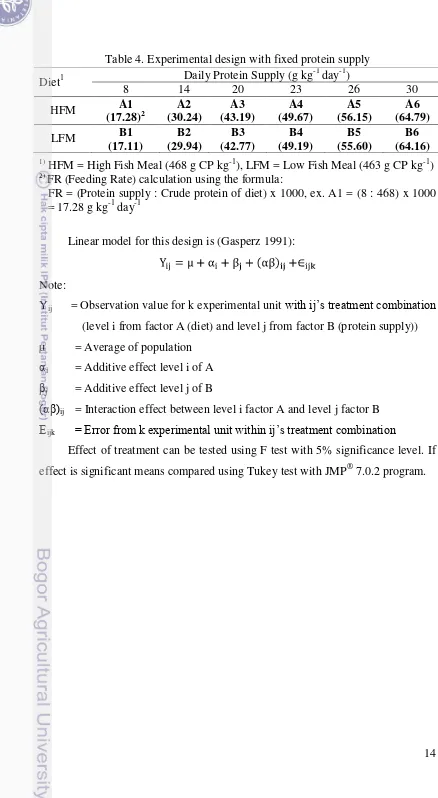
14 Table 4. Experimental design with fixed protein supply
1)
HFM = High Fish Meal (468 g CP kg-1), LFM = Low Fish Meal (463 g CP kg-1)
2)
FR (Feeding Rate) calculation using the formula:
FR = (Protein supply : Crude protein of diet) x 1000, ex. A1 = (8 : 468) x 1000 = 17.28 g kg-1 day-1
Linear model for this design is (Gasperz 1991):
Note:
Yij = Observation value for k experimental unit with ij’s treatment combination
(level i from factor A (diet) and level j from factor B (protein supply)) µ = Average of population
αi = Additive effect level i of A βj = Additive effect level j of B
(αβ)ij = Interaction effect between level i factor A and level j factor B Εijk = Error from k experimental unit within ij’s treatment combination
Effect of treatment can be tested using F test with 5% significance level. If effect is significant means compared using Tukey test with JMP® 7.0.2 program.
Diet1 Daily Protein Supply (g kg
15
3.6 Parameter
3.6.1 Specific Growth Rate
Growth rate was measured using SGR formula as follow (Guillaume et al.
2001):
Note:
SGR = Specific growth rate (% day-1)
Mf = Average fish mass at the end of experiment (g) Mi = Average fish mass at the beginning of experiment (g)
t = Observation period (day)
3.6.2 Survival Rate
Survival rate was measured as follow (Effendie 1997):
Note:
SR = Survival rate (%)
Nt = Number of live fish at the end of experiment (fish)
No = Number of live fish at the beginning of the experiment (fish)
3.6.3 Feed Conversion Ratio
Feed conversion was measured as follow (NRC 1977):
Note:
FCR = Feed conversion ratio (dry matter basis) F = Total feed intake (g)
16
3.6.4 Protein Retention
Protein retention was measured as follow (Takeuchi 1988):
Note:
PR = Protein retention (%)
BPf = Average body protein at the end of experiment (g) BPi = Average body protein at the beginning of experiment (g) IP = Total protein intake per fish (g)
3.6.5 Fat Retention
Fat retention was value measured as follow (Takeuchi 1988):
Note:
FR = Fat retention (%)
BFf = Average body fat at the end of experiment (g) BFi = Average body fat at the beginning of experiment (g) IF = Total fat intake per fish (g)
3.6.6 Feed Digestibility
IV. RESULT AND DISCUSSION
4.1 Result
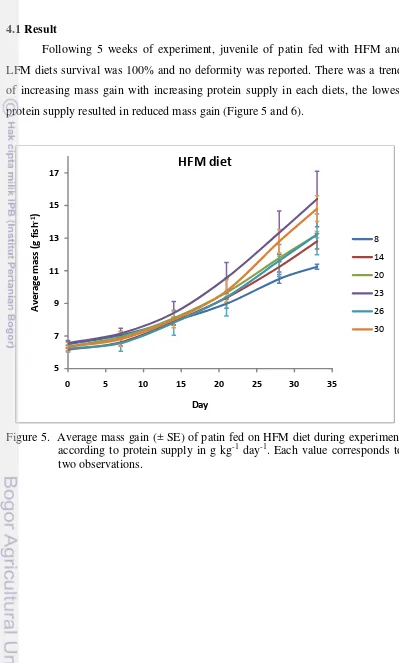
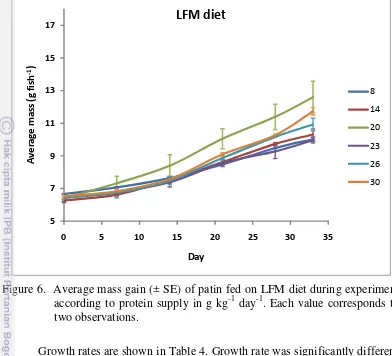
Following 5 weeks of experiment, juvenile of patin fed with HFM and LFM diets survival was 100% and no deformity was reported. There was a trend of increasing mass gain with increasing protein supply in each diets, the lowest protein supply resulted in reduced mass gain (Figure 5 and 6).
18 Figure 6. Average mass gain (± SE) of patin fed on LFM diet during experiment
according to protein supply in g kg-1 day-1. Each value corresponds to two observations.
19 Table 5. Average initial and final body mass, growth rate, and food conversion
ratio according to diet and protein supply
Diet Protein supply (g kg fish-1 day-1)
Initial mass (g fish-1)
Final mass (g fish-1)
SGR
(% day-1) FCR
HFM 8 6.49 11.25abc 1.67bcd 0.90d
14 6.16 12.80abc 2.22ab 1.14cd
20 6.36 13.21abc 2.22ab 1.63bcd
23 6.56 15.40a 2.57a 1.58bcd
26 6.22 13.23abc 2.28ab 2.02b
30 6.33 14.81ab 2.57a 2.00b
LFM 8 6.66 10.02c 1.24d 1.23cd
14 6.26 10.31c 1.51bcd 1.76bc
20 6.41 12.60abc 2.04abc 1.85bc
23 6.44 9.96c 1.32cd 3.31a
26 6.43 10.92bc 1.60bcd 2.99a
30 6.52 11.73abc 1.78bcd 3.02a
SEM 0.15 0.74 0.14 0.13
20 Table 6. Average of body composition according to diet and protein supply
Diet Protein supply (g kg fish-1 day-1)
Dry
matter Protein Fat Ash GE
Initial 205 138 31.4 31.3 4.50
HFM 8 212 137 41.9d 28.0 4.90
14 225 146 46.1d 29.1 5.27
20 225 143 48.7cd 27.5 5.29
23 232 147 51.7cd 27.3 5.52
26 248 158 50.1cd 34.2 5.71
30 222 134 56.7bcd 25.2 5.39
LFM 8 224 128 57.3bcd 31.0 5.28
14 225 127 62.2abcd 29.5 5.45
20 231 122 76.7ab 26.4 5.91
23 236 134 61.7abcd 30.7 5.59
26 245 130 78.0a 30.2 6.14
30 242 134 67.4abc 31.6 5.83
SEM 11 9 3.6 2.6 0.23
Nutrient utilizations are shown in Table 6. Protein retention, fat retention, and protein efficiency ratio (PER) differed significantly between treatments. Highest protein retention value (32.4%) was obtained with HFM diet and 8 g kg-1 day-1 protein supplies. Highest fat retention (100.2%) was obtained with LFM diet and 8 g kg-1 day-1 protein supplies. Highest PER value (2.37) was obtained with HFM diet and 8 g kg-1 day-1 protein supplies.
21 Table 7. Average of protein retention, fat retention, and protein efficiency ratio
according to diet and protein supply
Diet Protein supply
Dry matter and protein apparent digestibility coefficient (ADC) are shown in Table 7. Both dry matter and protein digestibility calculation gave similar values for the two diets, HFM and LFM. Nevertheless, LFM diet led to slightly better value than HFM with dry matter digestibility 89.0% and protein digestibility 94.4%.
Table 8. Average of feed digestibility
22 Figure 7. Amino-acid profile in each feed compared with channel catfish
requirement (g kg-1 protein).
4.2 Discussion
From the present experiment, the result showed that with the same protein supply, feed with higher fish meal content gave higher SGR than the lower fish meal one. SGR increased with protein supply for both diets. HFM diet gave the highest estimate for maximum SGR (2.57% day-1) which is reached when protein supply 23 g kg-1 day-1 and higher, while SGR still increase until 1.68% day-1 when protein supply reach 17.8 g kg-1 day-1 with LFM diet. The observed lower SGR values for both diets might be caused by too low protein supply, which can not cover protein synthesis for body mass allowing supporting optimum growth. Protein ingested by fish may presumably be catabolised to meet its requirement for maintenance rather than deposited for growth, when protein supply were too low.
Protein supplies required for maximum growth in the present study values are much lower than protein supply of 23.8 g kg-1 day-1 previously recommended for patin juveniles of the same size (Moreau et al. 2008). This may be related to the lower growth rate observed in the present study. Effectively, as fish may not display higher growth, protein deposition is lower and thus apparent protein requirement lower. Anyway, stricto senso protein requirement even for the same species may not be discarded from attended (or target) growth.
23 Figure 8. Broken line model adjusted to specific growth rate (SGR) of patin
juveniles according to daily protein supply with the two experimental diets over 33 days. Italic values indicated minimum protein supply for maximal growth with each diet.
FCR were generally improved with increasing protein supply, but HFM diet gave a better result than LFM when protein supplies are equivalent. Best FCR efficient. Furthermore, high FCR with higher protein supplies indicated that these protein supplies largely exceeded the optimal need of patin, and then food will be unavoidably wasted.
Body analysis indicated that dry matter, protein, ash, and GE gave the same results whatever the treatment. Fat increased with increasing protein supply on both diet. Carcass lipid levels were higher in fish fed dietary LFM. Highest fat composition (78) was achieved with LFM diet with 26 g kg-1 day -1, while the lowest (42 and 46) were obtained with HFM diet with 8 and 14 g kg-1 day -1 protein supply, respectively. LFM diet with 26 g kg-1 day -1 protein supply, a higher feed intake, led to highest value on fat composition indicating that lipid deposition was stimulated by high nutrient supply.
24 Nutrient utilization, measured by protein retention, fat retention, and PER, decreased with increasing protein supply with both diets. With the same protein supply, HFM diet gave a better result for protein retention. Highest protein retention (32) obtained with HFM and protein supply of 8 g kg-1 day-1 indicated that rates of protein synthesis are higher than protein degradation and so provided more efficient retention of synthesized proteins. Highest fat retention (100) was achieved with LFM diet and protein supply of 8 g kg-1 day -1 might be caused by the fact that with this protein supply, fat content from LFM is deposited as storage lipid and/or neolipogenesis from COH.Lipid synthesis which occurred here needs energy and this will reduce energy available for growth. Experiments by Du et al. (2005) in carp juvenile and Mokoginta et al. (2004) in gouramy showed that higher fat content on diet, then lower fat which being deposited, on the contrary, lower fat content on diet, then higher fat which being deposited. Lowest fat retention (40, 33, and 38) was obtained with HFM diet at 20, 26, and 30 g kg-1 day-1, respectively corresponding to higher fat supply than 8 g kg-1 day-1.
The results for ADC showed that dietary LFM gave a slightly higher value for both dry matter and protein digestibility. Unfortunately, as experimental conditions did not allow replicates, the slight difference between the two feed was not tested. Overall, protein digestibility values (91.6 and 94.4%) were in a range (75–95%) reported for other freshwater fish fed practical selected diets (Kenan & Yasar 2005). In this experiment, diets that contained a high level of animal protein and those composed principally of plant-based ingredients were all highly digestible. This suggests a good efficiency of the pre-treatment process for these latter feedstuffs. This can be related to high efficiency of the thermal treatment, reducing trypsin and chymotrypsin inhibitory activities (Alonso et al. 2000). Then comparison between the two diets can be based on difference in amino acid supply rather than difference in protein availability.
25 are catabolised for energy without interfering with the metabolism of other amino acids (Kaushik & Seilez 2010). The results showed that the provided dietary protein, regardless of source, was well digested by the fishes. Estimation of EAA content, such as lysine, is less in LFM than in HFM and also less than lysine requirement for channel catfish. Imbalances in the amino acid profile of LFM diet may depress feed intake and reduces efficient utilization of amino acid as excess in non-lysine amino acid may led to higher catabolism level.
V. CONCLUSION AND RECOMMENDATION
5.1 Conclusion
1. Plant ingredients can partially substitute fishmeal in Pangasianodon hypophthalmus diets.
2. According to different protein quality, amino acid must be adjusted in order to reach optimal growth.
3. Increase in protein supply may partially compensate lower growth with lower protein quality.
5.2 Recommendation
REFERENCE
Akand AM, Miah MI, Haque MM. 1989. Effect of dietary protein level on growth, feed conversion and body composition of Shing (Heteropneustes fossilis Bloch). Aquaculture 77:175-180.
Ali MZ, Jauncey K. 2005. Approaches to optimizing dietary protein to energy ratio for African Catfish Clarias gariepinus (Burchell, 1822). Aquaculture Nutrition 11:95-101.
Andrews JW, Page JW. 1974. Growth factors in the fishmeal component of Catfish diets. J. Nutr 107:1153-1156.
DKP, Departemen Kelautan dan Perikanan. 2005. Revitalisasi Perikanan Budidaya 2006-2009. Jakarta. 275 p.
Bai SC, Gatlin DM. 1994. Effect of L-lysine supplementation of diets with different protein levels and sources on Channel Catfish Ictalurus punctatus (Rafinesque). Aquaculture and Fisheries Management 25:465-474.
Brownman MW, Kramer DL. 1985. Pangasius sutchi (Pangasiidae), an air-breathing Catfish that uses the swimbladder as an accessory respiratory organ. Copeia 4:994-998.
Chuapoehuk W, Pothisoong T. 1985. Protein requirements of Catfish fry, Pangasius sutchi, Fowler. In: Finfish Nutrition in Asia: Methodological Approaches to Research Development, C. Y. Cho, C. B. Cowey, T. Watanabe eds. International Development Research Centre, Otawa, Canada, p 103-106.
Cowey CB, Sargent JR. 1979. Nutrition, In: Fish Physiology, Vol. VIII, Bioenergetics and Growth. Academic Press, New York. p 1-69.
Cowey CB, Tacon AGJ. 1983. Fish Nutrition-Relevance to Invertebrates. In: Pruder, G.D., C.J. Langdon and D.E. Conklin (eds) Proceedings of the Second International Conference on Aquaculture Nutrition: Biochemical and Physiological Approaches to Shellfish Nutrition. Louisiana State University, Division of Continuing Education, Baton Rouge, p 13-30.
28 Degani G, Zvi YB, Levanon D. 1989. The effect of different protein levels and
temperatures on feed utilization, growth and body composition of Clarias gariepinus (Burchell, 1822). Aquaculture 76:293-301.
Du ZY, Liu YZ, Tian JT, Wang YW, Liang GY. 2005. Effect of dietary lipid level on growth, feed utilization and body compositionby juvenile grass carp (Ctenopharyngodon idella). Aquaculture Nutrition, 11:139-146.
Effendie MI. 1997. Biologi Perikanan. Yayasan Pustaka Nusantara. Bogor. 159 p.
El-Saidy DMSD, Gaber MMA. 2002. Complete replacement of fish meal by soybean meal with dietary L-lysine supplementation for Nile Tilapia (Oreochromis niloticus) fingerlings. Journal of World Aquaculture Society 33(3):297-306.
Fagbenro OA. 1992. Quantitative dietary protein requirements of Clarias isheriensis (Sydenham, 1980) (Clariidae) fingerlings. J. Appl. Ichthyol 8:164-169.
Fagbenro OA, Balogun AM, Anyanwu CN. 1992. Optimal dietary protein level for Heterobranchus bidorsalis fingerlings fed compound diets. Isr. J. Aquac 44:87-92.
Fagbenro OA, Nwanna LC, Adebago OT. 1999. Dietary arginine requirement of the African Catfish, Clarias gariepinus. Journal of Applied Aquaculture 9:59-64.
Gasperz V. 1991. Teknik Analisis dalam Penelitian Percobaan. Bandung: CV. Armico. 593 p.
Gaylord TG, Gatlin III DM. 2001. Dietary protein and energy modification to maximize compensatory growth of channel catfish (Ictalurus punctatus). Aquaculture 194:337-348.
Guillaume J, Kaushik S, Bergot P, Metailler R. 2001. Nutrition and Feeding of Fish and Crustaceans. UK:Praxis Publishing. 408 p.
Gustiano R. 2003. Taxonomy and Phylogeny of Pangasiidae Catfishes from Asia (Ostariophysi, Siluriformes) [thesis]. Belgium: Departement of Biology, Faculty of Sciences, Katholieke Universiteit Leuven. 296 p.
Halver JE, DeLong DC, Mertz ET. 1957. J. Nutr. 63,95.
Halver JE. 2002. Fish Nutrition. 3rd Ed. USA: Academic Press, California. 822 p.
29 Harimurti A, Risdiyanto CT, Supriyat Y. 1995. Pembesaran Ikan Jambal Siam
(Pangasius sutchi Fowler). Bahan Informasi Teknologi. Departemen Pertanian Direktorat Jenderal Perikanan. Balai Budidaya Air Tawar Sukabumi.
Harper A, Leung E, Yoshida P, Rogers QR. 1964. Some new thoughts on amino acid balance. Fed. Proc. 23:1087-1096.
Henken AM, Machiels MAM, Dekker W, Hoggendoorn H. 1986. The effect of dietary protein and energy content on growth rate and feed utilization of the African Catfish Clarias gariepinus (Burchell, 1822). Aquaculture 58:55-74.
http://www.fisheries.go.th/fisheries/aq/img/upload/web/fish/pangasianodon_hypo phthalmus.jpg. Accessed at May 11, 2009 at 17.30 pm.
Huisman. 1987. Principles of Fish Production. Departement of Fish Culture and Fisheries, Wageningen Agriculture University, Wageningen, The Netherlands.
Hung LT. 1999. Contribution à l'étude de l'élevage larvaire et de la nutrition des juvéniles de deux poissons-chats du Mékong, Pangasius bocourti (Sauvage, 1880) et Pangasius hypophthalmus (Sauvage, 1878). PhD Thesis. Institut National Agronomique Paris-Grignon, Paris, France.
Hung LT, Lazard J, Mariojouls C, Moreau Y. 2003. Comparison of starch utilization in fingerlings of two Asian Catfishes from the Mekong River (Pangasius bocourti Sauvage, 1880, Pangasius hypophthalmus Sauvage, 1878). Aquacult. Nutr. 9:215-222.
Hung LT, Suhenda N, Slembrouck J, Lazard J, Moreau Y. 2004. Comparison of dietary protein and energy utilization in three Asian Catfishes (Pangasius bocourti, P. hypophthalmus and P. djambal). Aquacult. Nutr. 10:317-326.
Kaushik SJ, Seilez I. 2010. Review article: Protein and amino acid nutrition and metabolism in fish: current knowledge and future needs. Aquaculture Research. 41: 322-332.
Kerdchuen K. 1992. L’ alimentation artificielle d’un Silure Africain, Heterobranchus longifilis (Teleostei: Clariidae). Incidence du Mode d’alimentation et Premiere Estimation des Besoins Nutritionnels. These dr., Universite de Paris VI. TDM 88, ORSTOM, Paris.
30 Kurnia A. 2002. Pengaruh pakan dengan kadar protein dan rasio energi yang
berbeda terhadap efisiensi pakan dan pertumbuhan benih Ikan Baung (Mystus nemurus C.V.). [tesis]. Bogor: Program Pascasarjana, Institut Pertanian Bogor, 54 p. Inst. Freshw. Fish. Res. Nigeria 1988:104-109.
Miles RD, Chapman FA. 2007. The concept of ideal protein in formulation of aquaculture feeds. Departement of Fisheries and Aquatic Sciences, University of Florida, USA.
Mokoginta I, Takeuchi T, Hadadi A, Jusadi D. 2004. Different capabilities in utilizing dietary carbohydrate by fingerling and subadult giant gouramy Osphronemus gouramy. Fish Science, 70:996-1002.
Mollah MRA, Hussain MA. 1990. Effect of artificial diets containing different protein levels on growth and feed efficiency of Catfish (Clarias batrachus L.). Indian J. Fish. 37, 251-259.
Moreau Y. 1991. Détermination des coefficients de digestibilité apparents pour Oreochromis niloticus de sous-produits agro-industriels disponibles en Côte d'Ivoire In The third international symposium on tilapia aquaculture (Pullin, R.S.V., et al. eds.), Vol. 41, pp. 226-233. ICLARM, Abidjan, Côte d'Ivoire.
Moreau Y, Subamia IW, Afifah R, Hirnawati R. 2008. Effect of feeding rate and dietary protein-energy ratio on growth and feed utilization by Pangasianodon hypophthalmus juveniles. World aquaculture conference 2008, May 19-23 2008. Busan, South Korea.
Murai T, Ogata H, Hirasawa Y, Akiyama T, Nose T. 1987. Portal absorption and hepatic uptake of amino acids in Rainbow Trout force fed complete diets containing casein or crystalline amino acids. Nippon Suisan Gakkaishi 53:1847-1859.
National Research Council (NRC). 1977. Nutrient Requirement of Warmwater Fishes. Washington DC: National Academy Research Press. 120 p.
31 Rabegnatar INS, Hidayat W. 1992. Estimasi perbandingan optimal energi dan
protein dalam pakan buatan untuk pembesaran benih ikan lele (Clarias batrachus) dalam keramba jaring apung. Prosiding Seminar Hasil Penelitian Perikanan Air Tawar, Balai Penelitian Perikanan Air Tawar, Bogor, p 19-28.
Robinson EH, Wilson RP, Poe WE. 1981. Arginine requirement and apparent absence of a lysine-arginine antagonist in fingerling Channel Catfish. J. Nutr. 111:46-52.
Robinson EH, Weirich CR, Li MH. 1994. Feeding Catfish. Bull. Mississippi Agricultural and Forestry Experimental Station. Mississippi 39762.
Rumsey GL, Ketola HG. 1975. Amino acid supplementation of casein diets of Atlantic Salmon (Salmo salar) fry and of soybean meal for Rainbow Trout (Salmo gairdneri) fingerlings. Journal of the Fisheries Research Board of Canada 32:422-426.
Satoh S, Poe WE, Wilson RP. 1989. Studies on the essential fatty acid requirement of Channel Catfish, Ictalurus punctatus. Aquaculture 79:121-128.
Schuhmacher A, Goldberg M, Schon J, Wax J, Groop JM. 1993. Plasma amino acid levels in Rainbow Trout (O. mykiss). EIFAC Workshop on Methodology for Determination of Nutrient Requirements in Fish. 29 June-1 July, Eichenau, Germany.
Steffens W. 1989. Principles of Fish Nutrition. Ellis Horwood Ltd, England. 384 p.
Stickney RR, Lovell T. 1977. Nutrition and Feeding of Channel Catfsh. Southern Cooperative Series. Bulletin 218.
Stickney RR. 1993. Culture of Non Salmonid Freshwater Fishes. Advances in Fisheries Science. 2nd Ed. CRC Press. Boca Raton, Florida. 331 p.
Subamia IW, Suhenda N, Tahapari E. 2003. Pengaruh pemberian pakan buatan dengan kadar lemak yang berbeda terhadap pertumbuhan dan sintasan benih Ikan Jambal Siam (Pangasius hypophthalmus). Jurnal Penelitian Perikanan Indonesia, 9(1):37-42.
32 Suhenda N, Setijaningsih L, Suryanti Y. 2003. Penentuan rasio antara kadar
karbohidrat dan lemak pada pakan benih Ikan Patin Jambal (Pangasius djambal). Jurnal Penelitian Perikanan Indonesia, 9(1):21-30.
Suryanti Y, Priyadi A, Mundriyanto H. 2003. Pengaruh rasio energi dan protein yang berbeda terhadap efisiensi pemanfaatan protein pada benih Baung (Mystus nemurus C.V.). Jurnal Penelitian Perikanan Indonesia, 9(1): 31-36.
Syamsunarno MB. 2008. Pengaruh rasio energi-protein yang berbeda pada kadar protein pakan 30% terhadap kinerja pertumbuhan benih Ikan Patin (Pangasius hypophthalmus) [skripsi]. Fakultas Perikanan dan Ilmu Kelautan , Institut Pertanian Bogor. 45 p.
Takeuchi T. 1988. Laboratory Work Chemical Evaluation of Dietary Nutrient, In: T. Watanabe (ed.): Fish Nutrition and Mariculture. Kanigawa Fisheries Training Center, Japan International Cooperation Agency, Tokyo. p 179-232.
Thebault H, Alliot E, Pastoureoud A. 1985. Quantitative methionine requirement of juvenile Sea-Bass (Dicentrarchus labrax). Aquaculture 50:75-87.
Tucker CS, Robinson EH. 1991. Channel Catfish Farming Handbook. New York: Van Nostrand Reinhold.
Unprasert NG. 1994. An evaluation of the use of “ideal protein concept to estimate essential amino acid requirement of the Clarias hybrid (Clarias macrocephalus x Clarias gariepinus). Ph.D Dissertation, Mississipi State University, Miss. State, MS.
Wilson RP, Poe WE, Robinson EH. 1980. Leucine, isoleucine, valine and histidine requirements of fingerling Channel Catfish. J. Nutr. 110:627-633.
Wilson RP, Robinson EH, Poe WE. 1981. Apparent and true availability of amino acid from common feed ingredients for Channel Catfish. Journal of Nutrition 111:923-929.
Wilson RP, Moreau Y. 1996. Nutrient requirements of catfishes (Siluroidei). Aquat. Living Resour. 9:103-111.
Wilson RP. 2002. Amino acid requirements of finfish and crustaceans. Departement of Biochemistry and Molecular Biology, Mississipi State University, USA. 52 p.
34 Appendix 1. Proximate analysis of feed ingredients
Feed ingredients Proximate composition (g kg
-1
)
Dry matter Protein Fat Ash Fibre
Fish meal 911.5 763.8 84.5 148.4 -
Soybean meal 900.7 515.7 17.1 75.9 37.5
Corn meal 897.3 134.1 72.4 25.2 21.6
Wheat gluten meal 890.2 860.8 3.2 7.6 3.8
35 Appendix 2. Diet preparation procedure
Weigh each ingredients
Mix microingredient (mineral, vitamin, binder)
Mix macroingredient
(fish meal, soybean meal, corn meal, wheat gluten meal), spread evenly and then add microingredient mixture
while swirl until spread
Add fat (palm oil, corn oil, fish oil) slightly into those mixture
Add water to obtain a paste
Press with 1.5 mm dye
Dry pellet at room temperature
36 Appendix 3. Proximate analysis procedures
1. Dry matter analysis Material
Aluminium foil (shape as small dish)
Analytical balance
Oven 105 °C
Desiccators
Tweezers
Procedure
Weigh aluminium foil (ME, mass empty), add ≈ 0.5 g sample (MF, mass fresh).
Place aluminium foil containing sample at 105 °C for 12 hours (overnight).
Remove aluminium foil containing dried sample from oven and allow cooling in
desiccators.
Weigh aluminium foil containing dried sample (MD, mass dry).
Calculation
37 2. Ash analysis
Material
Aluminium foil (shaped as small dish)
Analytical balance
Oven 105 °C
Furnace 500 °C
Desiccator
Tweezers
Procedure
Weigh aluminium foil (ME, mass empty), add ≈ 0.5 g sample.
Place aluminium foil with sample to 105 °C oven for 12 hours (overnight).
Remove aluminium foil containing dried sample from oven and allow cooling in
desiccator.
Record mass of aluminium foil containing dried sample (MD, mass dry).
Ignite aluminium foil containing dried sample under fume hood. Transfer to furnace
at 500 °C for 4 hours.
Remove aluminium foil containing burned sample from furnace and allow cooling in
desiccator.
Weigh aluminium foil containing burned sample (MC, mass calcinated)
38 3. Crude protein analysis (Kjeldahl method)
Material
Crude protein apparatus with mineralizator, distillator, neutralizator and titrator
Analytical balance 1000 mL volume flask, 2 500 mL volume flask
1000 mL dark reagent flask 100 mL dark reagent flask, 2
1000 mL reagent flask 500 mL reagent flask 250 mL reagent flask
250 mL beaker glass 100 mL erlenmeyer
10 mL micropipette (pipetman)
Aluminium foil Magnetic stirrer Funnel glass, 3
3 mm glass marbles
Reagents
1. Sulfuric acid, H2SO4 96%
2. Sodium hydroxide, NaOH pellets 3. Ammonium sulphate, (NH4)2SO4
4. 96% ethanol, C2H5OH (EtOH)
5. Methylene blue 6. Methyl red 7. Boric acid, H3BO3
8. Kjeltabs (W) (7.5 parts sodium sulfate, Na2SO4; 1.5 parts copper (II)
39 9. NaOH, 40%
Weigh 400 g NaOH pellets (2) in a beaker glass 500 mL. Pour cautiously NaOH to jerrycan containing 1030 mL water . Mix until NaOH is completely dissolved in cold water. Store at room temperature.
10.Titration solution H2SO4 ( 1/28 M)
Weigh 20 g boric acid (7) in a beaker glass. Pour cautiously in a 1000 mL volume flask containing 400 mL of water. Mix until boric acid is completely dissolved. Add 400 mL EtOH (4), 8 mL methylene blue 0.1% (11), 8 mL methyl red 0.2% (12). Mix. Adjust volume to 1000 mL. Transfer in dark reagent flask.
Store at room temperature. 14.Dilution indicator solution 1:1
Mixing 1 part colourant solution (13) for 1 part water . Store at room temperature.
15.Standard solution 1 mgN ml-1 (NH4)2SO4
Weigh 2.63 g (NH4)2SO4 (3) in a beaker glass. Pour cautiously in a 500
40
Procedure
Weigh 0.1 g dry sample in a piece of aluminium foil (MS, sample mass) and transfer in Kjeldahl tube.
Mineralization
Add half of Kjeltabs® (8), 3 glass marbles and 10 mL H2SO4 96% (1).
Transfer to mineralization system with neutralization system, cover and heat on (temperature 375 °C) for 60 minutes.
Open the cover and remove Kjeldahl tube, then allow cooling.
Distillation
Heat up distillation apparatus. Repeat blank distillation until output reaches at least 80 mL.
Transfer Kjeldahl tube to distillation apparatus. Add 30 mL of water and NaOH 40% (9) until sample solution in tube turn to a brown or dark-blue solution.
Place down 100 mL erlenmeyer containing 10 mL indicator solution (14) and a magnetic stirrer in output system.
Start distillation during 5-6 minutes.
Do blank and standard using the same procedure distillation. For blank, use a clean tube and add 30 mL of water plus 20 mL NaOH 40% (9). For standard, add 5 mL (5 mg) standard (NH4)2SO4 (15) in a clean tube, then
add 30 mL of water plus 20 mL NaOH 40% (9).
Titration
Remove the 100 mL erlenmeyer containing ammonia extracted by distillation to titration apparatus.
Stir and titrate with 1/28 mol H2SO4 (10) until colour changes from green
to pinky-violet. Record volume of acid when colour changed (VA, sample volume). Do the same for blank (VB, blank volume) and standard (VS,
41
Calculation
Standard measurement :
42
4. Fat analysis (Soxhlet Method)
Material
Soxhlet glass tube, with pump cooler Analytical balance
Oven @ 105 °C Desiccator
100 mL volumetric cylinder glass, 1
100 mL extraction baloon, 3 Glass funnel
Extraction thimbles, in glass container
Cotton (already washed with petroleum ether) Tweezers
Reagents
Petroleum ether (wasbensin)
Procedure
Weigh extraction ballon (ME, extraction flask mass), add 100 mL petroleum ether.
Weigh ≈ 1.0 gram dry sample in extraction thimbles with glass container (MS, sample mass), cover with cotton.
Transfer extraction thimbles into soxhlet glass tube. Connect extraction balloon to Soxhlet extractor. Turn on heater and allow boiling gently for 3 hours.
Turn off heater. Transfer extraction thimbles from Soxhlet tube to a glass container and pour petroleum ether from Soxhlet tube to a 2nd bottle for petroleum ether.
Turn on again until all solvent is trapped in Soxhlet tube. Pour petroleum ether in glass tube to the 2nd bottle.
Turn off, remove extraction balloon from heater and transfer to 105 °C for 12 hours (overnight).
43 Record the mass of extraction balloon containing fat extract (MF, mass extraction flask containing fat extract).
44
5. Crude fibre analysis
Material
Crude fibre apparatus, with 1000 mL beaker and reflux system Analytical balance
Filtration unit connected to a vacuum pump Oven @ 105 °C
Furnace @ 500 °C
Desiccator
1000 mL beaker glass, 4 250 mL beaker glass, 2
250 mL cylinder, 1 250 mL reagent flask, 2 250 mL volume flask, 2
10 mL micropipette (pipetman)
Sinter glass crucible (volume 30 mL, porosity 1) Aluminium foil
Picker
Reagents
1. H2SO4, 40%
Weigh 104 g H2SO4 in a beaker. Pour cautiously in a 250 mL volume flask
containing around 100 mL of water. Mix. Cool under tap water flow. Adjust volume to 250 mL. Transfer in labelled 250 mL reagent flask.
Store at room temperature. 2. NaOH, 40%
Weigh 100 g NaOH pellets in a beaker. Add 200 mL water. Mix until NaOH is completely dissolved. Cool. Poor the solution cautiously in a 250 mL volume flask, adjust volume to 250 mL with water. Transfer in labelled 250 mL reagent flask.
45
Procedure
Weigh 0.5 to 1.0 g dry sample in a piece of aluminium foil (MS, sample mass).
Acidtreatment
Add 200 mL water in a 1000 mL beaker with 6.8 mL H2SO4 40% (final
concentration 1.25 %) and 1 g of Celite (4). Add 2 drops of antifoaming agent. Adjust reflux system. Heat up crude fibre apparatus (thermostat 3). Transfer sample into the beaker (thermostat 2). Adjust reflux system and allow boiling for 30 minutes.
Neutralization and alkalitreatment
Add 6.8 mL NaOH 40% to neutralize solution. This can be confirmed by the clarification of the solution.
Add further 6.8 mL NaOH 40% to adjusted final NaOH concentration to 1.25 %. Adjust reflux system and allow boiling for further 30 minutes (thermostat 2).
Add 6.8 mL H2SO4 40% to neutralize solution (thermostat 1).
Filtration
Adjust filtration device and pour supernatant on the filter. Repeat until all solution was filtered.
Wash filter twice with 30 mL hot water. For the last one, rinse the bottom of filter to remove any residue.
Drying
46
Ignition
Remove crucible from oven and allow cooling in the desiccator.
Record mass of crucible containing acid-alkali extract (MD, mass of dry crucible containing acid-alkali extract).
Ignite crucible under fume hood. Transfer to furnace preheated @ 500 °C for 4 hours.
Remove crucible from furnace and allow cooling in the desiccator. Record mass of crucible with burned extract (MB, mass of crucible with burned acid-alkali extract).
Calculation
Crude fibre mass is given by the loss upon ignition corrected by the mass of filter:
47 Appendix 4. Random disposition of aquaria experiment
52 Appendix 9. ANOVA and Tukey test of SGR
Source DF Sum of
Squares
Mean Square F Ratio
Model 11 4,6790654 0,425370 10,9114
Error 12 0,4678086 0,038984 Prob > F
C. Total 23 5,1468740 0,0001
Level Least Sq
Mean
[HFM]30 A 2,5729606 [HFM]23 A 2,5700436 [HFM]26 A B 2,2763786 [HFM]20 A B 2,2167776 [HFM]14 A B 2,2160925 [LFM]20 A B C 2,0418454 [LFM]30 B C D 1,7811840 [HFM]8 B C D 1,6669452 [LFM]26 B C D 1,6036718 [LFM]14 B C D 1,5115532 [LFM]23 C D 1,3233618 [LFM]8 D 1,2367104
53 Appendix 10. ANOVA and Tukey test of FCR
Source DF Sum of
Squares
Mean Square F Ratio
Model 11 13,305723 1,20961 34,6575
Error 12 0,418823 0,03490 Prob > F
C. Total 23 13,724545 <,0001
Level Least Sq
Mean
[LFM]23 A 3,3108628 [LFM]30 A 3,0170931 [LFM]26 A 2,9925822 [HFM]26 B 2,0223605 [HFM]30 B 1,9979055 [LFM]20 B C 1,8494432 [LFM]14 B C 1,7618207 [HFM]20 B C D 1,6254162 [HFM]23 B C D 1,5781015 [LFM]8 C D 1,2250850 [HFM]14 C D 1,1395857 [HFM]8 D 0,9029549
54 Appendix 11. ANOVA and Tukey test of PR
Source DF Sum of
Squares
Mean Square F Ratio
Model 11 1335,9622 121,451 12,9252
Error 12 112,7571 9,396 Prob > F
C. Total 23 1448,7193 <,0001
Level Least Sq
Mean
[HFM]8 A 32,396142 [HFM]14 A B 29,218250 [HFM]23 A B C 21,117853 [HFM]20 B C D 19,383194 [LFM]8 B C D 18,976577 [HFM]26 B C D 18,699846 [HFM]30 C D 13,956730 [LFM]14 C D 13,570965 [LFM]20 C D 12,346057 [LFM]30 C D 9,266365 [LFM]26 D 8,450551 [LFM]23 D 8,233131
55 Appendix 12. ANOVA and Tukey test of FR
Source DF Sum of
Squares
Mean Square F Ratio
Model 11 8697,2777 790,662 14,2449
Error 12 666,0574 55,505 Prob > F
C. Total 23 9363,3351 <,0001
Level Least Sq
Mean
[LFM]8 A 100,19297 [LFM]20 A B 76,20752 [LFM]14 A B C 70,89811 [HFM]8 B C D 62,04313 [LFM]26 B C D 54,66255 [HFM]14 B C D 52,79425 [HFM]23 C D 42,92012 [LFM]30 C D 41,94195 [LFM]23 D 39,86543 [HFM]20 D 39,74793 [HFM]30 D 37,73990 [HFM]26 D 33,13098
56 Appendix 13. ANOVA and Tukey test of PER
Source DF Sum of
Squares
Mean Square F Ratio
Model 11 5,8708083 0,533710 30,3142
Error 12 0,2112712 0,017606 Prob > F
C. Total 23 6,0820794 <,0001
Level Least Sq
Mean
[HFM]8 A 2,3732342 [HFM]14 A B 1,8920327 [LFM]8 B C 1,7654649 [HFM]23 B C D 1,3712977 [HFM]20 C D 1,3159979 [LFM]14 D E 1,2382224 [LFM]20 D E F 1,1796235 [HFM]30 D E F 1,0704401 [HFM]26 D E F 1,0618030 [LFM]26 E F 0,7242722 [LFM]30 E F 0,7177257 [LFM]23 F 0,6538841
57 Appendix 14. ANOVA of dry matter
Source DF Sum of
Squares
Mean Square F Ratio
Model 11 2428,7138 220,792 0,9665
Error 12 2741,3665 228,447 Prob > F
C. Total 23 5170,0803 0,5191
Appendix 15. ANOVA of protein
Source DF Sum of
Squares
Mean Square F Ratio
Model 11 2363,9868 214,908 1,3507
Error 12 1909,3260 159,111 Prob > F
58 Appendix 16. ANOVA of fat
Source DF Sum of
Squares
Mean Square F Ratio
Model 11 2920,1560 265,469 10,0412
Error 12 317,2559 26,438 Prob > F
C. Total 23 3237,4119 0,0002
Level Least Sq
Mean
[LFM]26 A 77,963294 [LFM]20 A B 76,705626 [LFM]30 A B C 67,374393 [LFM]14 A B C D 62,200422 [LFM]23 A B C D 61,656346 [LFM]8 B C D 57,313974 [HFM]30 B C D 56,743536 [HFM]23 C D 51,680738 [HFM]26 C D 50,116073 [HFM]20 C D 48,707606 [HFM]14 D 46,072188 [HFM]8 D 41,860891
Levels not connected by same letter are significantly different.
Appendix 17. ANOVA of ash
Source DF Sum of
Squares
Mean Square F Ratio
Model 11 139,03060 12,6391 0,9151
Error 12 165,74012 13,8117 Prob > F
59 Appendix 18. ANOVA of GE
Source DF Sum of
Squares
Mean Square F Ratio
Model 11 2,5032428 0,227568 2,1515
Error 12 1,2692421 0,105770 Prob > F