Just-in-Sequence JIS When components arrive on the production line just moments before they will be used on the production line and in the exact sequence in which they will be used (Internet: Modern Materials Handling, 2007). Lean manufacturing is a well-known phrase and buzzword around the world and in most business environments, especially in manufacturing plants. A step in the right direction will be to evaluate their current business processes and find ways where the implementation of LM principles will be useful to improve their plant and operations.
PROBLEM STATEMENT
PROJECT AIM
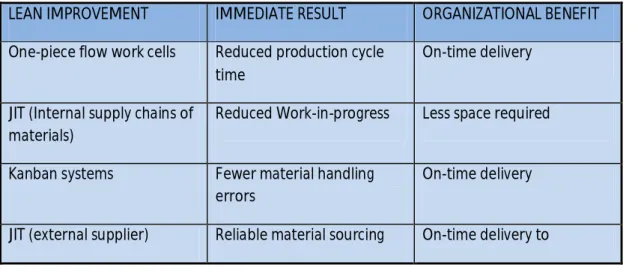
Increase material visibility by tracking the material throughout the production process using barcode and eKanban systems. Reducing the total stock at OMC by using the Kanban principle to manage stock and drive the purchasing process through an electronic Kanban system. Redesign the current facility layout at OMC for better material flow and visibility.
PROJECT SCOPE
Identification and grouping of parts to determine delivery frequencies as well as necessary agreements to be made with suppliers.
DELIVERABLES
LITERATURE STUDY
- JIT
- REDUCING LOT SIZES
- BASIC EOQ MODEL: (Winston, 2004: 108-110)
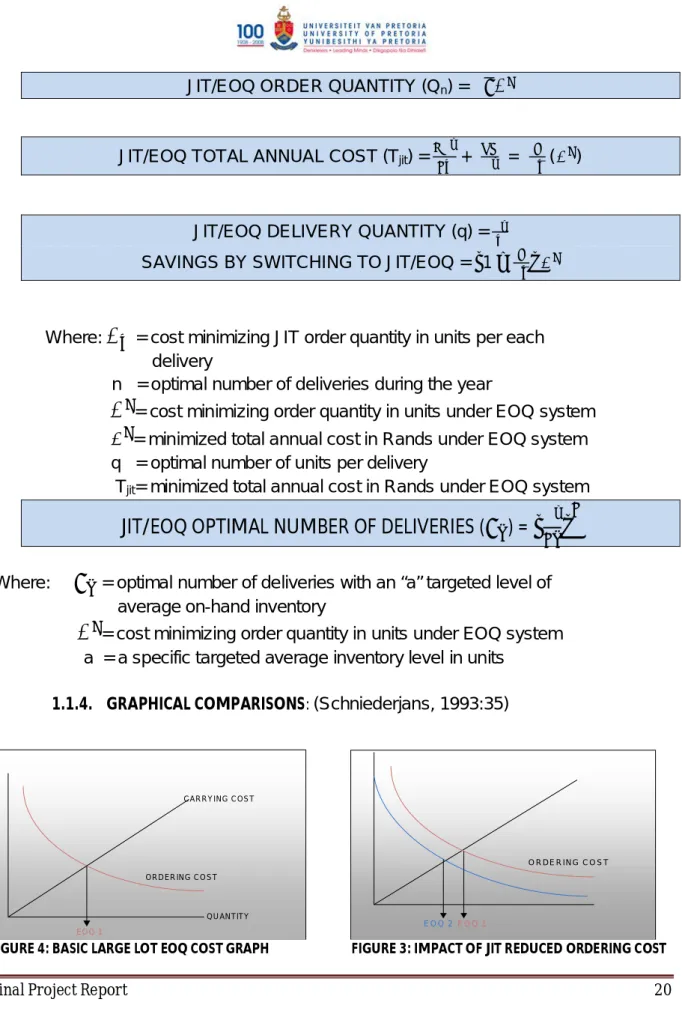
- JIT/EOQ MODEL: (Schniederjans, 1993:41-43)
- GRAPHICAL COMPARISONS: (Schniederjans, 1993:35)
- SEEK RELIABLE SUPPLIERS
- COMMUNICATION
- AUTOMATION
- MEASURING JIT PRODUCTION MANAGEMENT: (Schniederjans, 1993:95)
- QUEUES
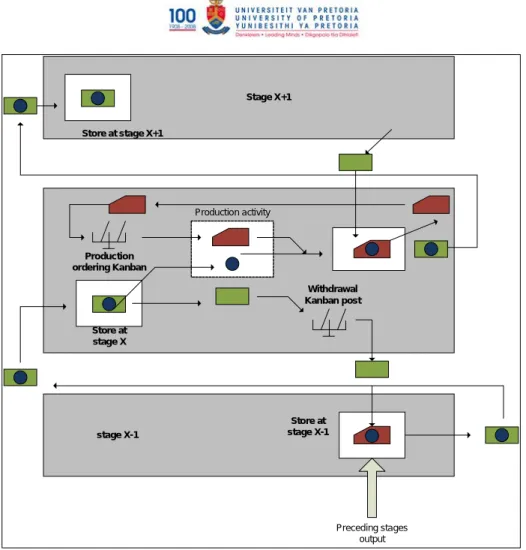
- KANBAN
- INTEGRATION OF JIT/MRP
- CHANGE MANAGEMENT
- CURRENT DATA ANALASYS
- CONCEPTUAL DESIGNS AND POSSIBLE SOLLUTIONS
But it does not keep track of the actual progress of the MPS and production rate. Long-term supplier relationships will have one of the biggest impacts on the success of any JIT implementation project. It may not be a verbal communication in the sense of the actual voice of the workers, but it refers to the actual rate of production and resource usage.
That's why it's just as important that they become part of the solution and the plan. With a new ERP solution in the pipeline, the barcode system can be leveraged more by using it as an input measure of actual inventory in the warehouse, production line, and parts to be painted and then sent to the desired location.
IMPLEMENTATION
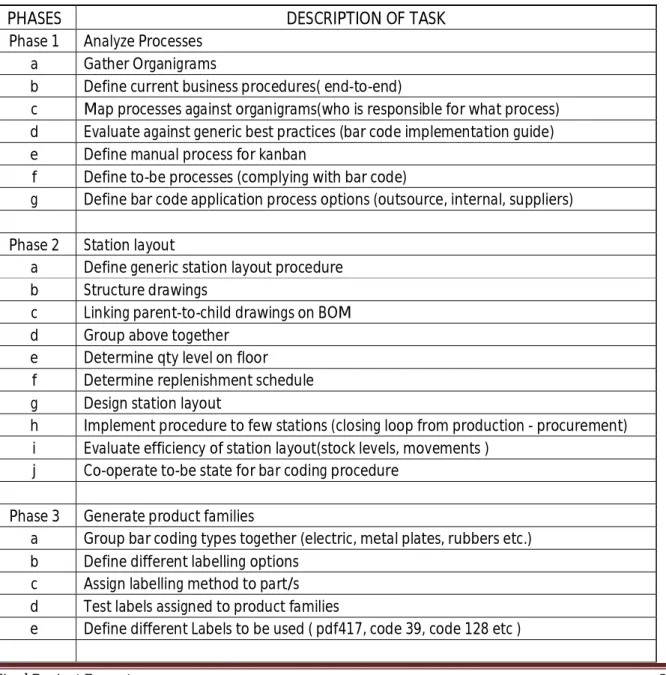
DEFINE AND ANALYZE PROCESSES
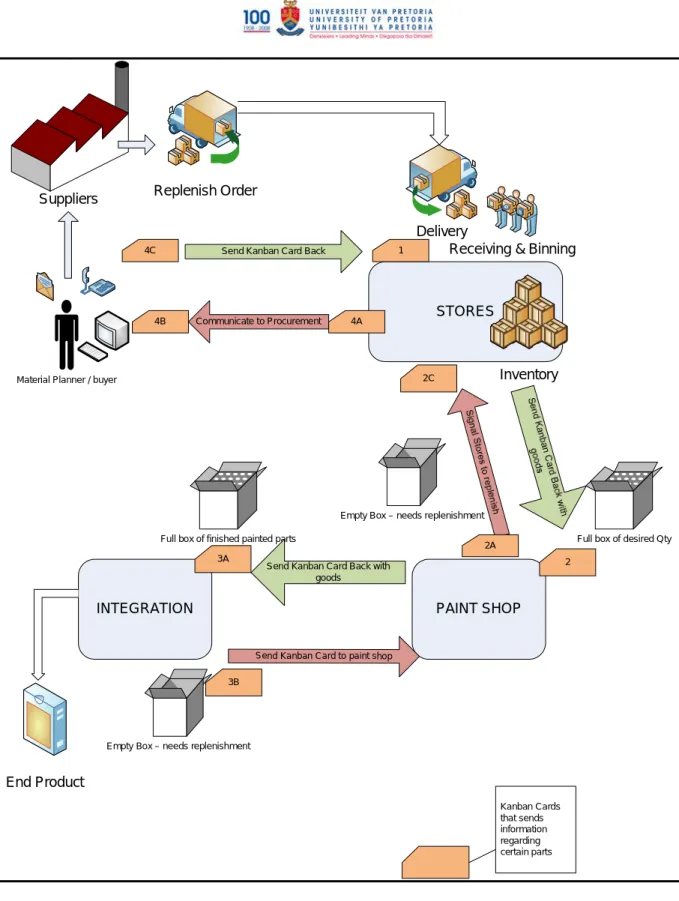
From the start of a project, all component kanban cards are developed with all delivery addresses and replenishment quantities. A part is sent from the warehouse to the desired delivery for example to the paint shop. When the integration line reaches a predetermined stock level, they will trigger the paint shop to release some parts on demand with a kanban card.
The same applies to the paint shop, when it reaches the minimum stock level, the kanban card will be sent to the warehouse to replenish the stock level of the paint shop. The warehouse works on exactly the same principle, except that the kanban card is sent to the purchasing department, where the material planner and the buyer communicate with the supplier by phone or email to fulfill the order. The parts are delivered to the warehouse and the parts are combined with the original kanban card.
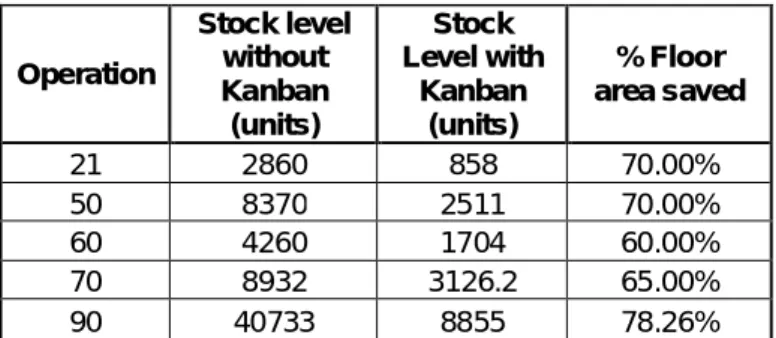
This process is run through all the operations and different sections of the production floor. Since implementing the manual kanban, inventory levels on the integration line have been dramatically reduced and material visibility has increased. A brief summary is given in the table below of how the stock levels have changed where the kanban process has been implemented.
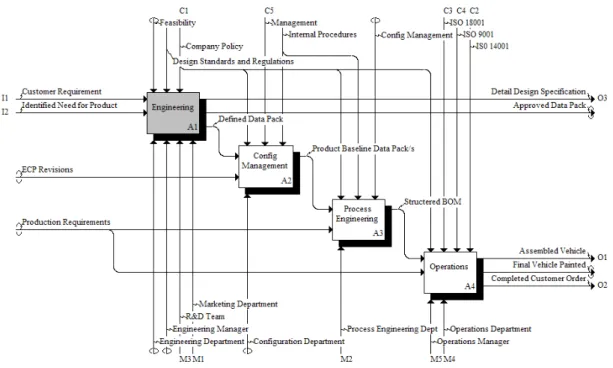
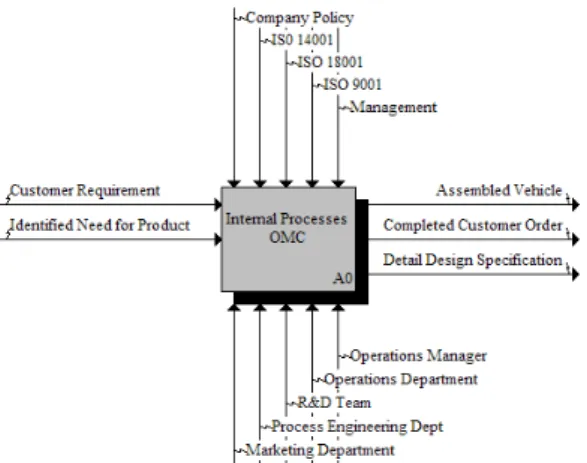
IDEF0 (functional diagrams) and IDEF1X (data models) were formulated and forwarded to the ERP software vendor to analyze and verify.
STATION LAYOUT
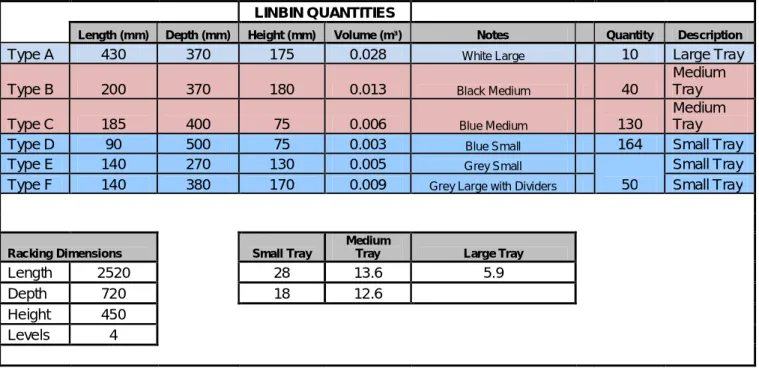
Calculate the number of linbins required, rack space and the type of linbins required. In the future, this will be a barcode when the barcode system is implemented and becomes active. After the sub-assemblies are assembled, they are sent to the integration line as a finished assembled item.
Station layouts need to be duplicated in the shunting/picking area for the kanban system. All parts on the bill of materials are assigned an operation number, which means that all parts that will be used in a particular station on the production line. Since the bill of materials was unstructured prior to this step, a macro will be developed that will automatically merge and structure the bill of materials as explained.
In the bill of materials template above, the unit dimensions are also included, and the space requirements and the amount of bins and racks are also determined. A detailed plan will be prepared for each station to assign locations and dedicated delivery addresses for all parts. Shelving, workbenches and stillages are designed in such a way that they all have a dedicated function in the station in terms of parts and material flow patterns.
The procedures described above are followed until all stations are designed, as are the quantities at each station and duplicated in the marshalling area.
CREATE PRODUCT FAMILIES AND ASSIGN LABELLING METHOD
Final Project Report 47 Matrix codes was the fact that the industry is moving away from 1D and normal 2D codes to 2D Data Matrix codes.
EVALUATE EQUIPMENT
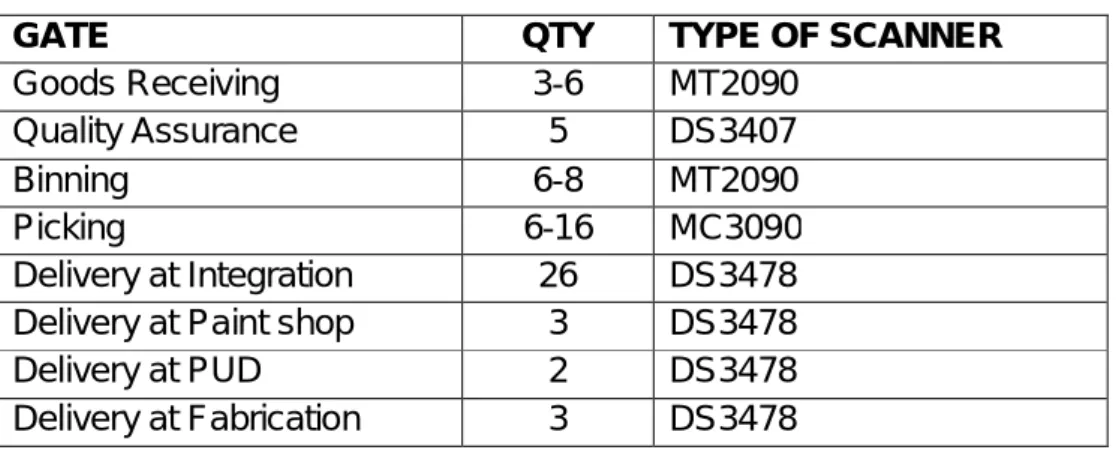
Final Project Report 48 As shown in the table above, the Intermec scanners are not DPM readable and only the Motorola models can be used. After designing the system, scanners were allocated to the areas where they are to be used and the required quantities were also determined for each area. From the process diagrams and the proposed system design, the following ports were identified where the scanning will take place, as well as how many people are needed to perform these tasks.
Currently, OMC has printers and software capable of printing labels for parts and a Telesis laser to mark UID plates for all warranty and serialized items. But OMC will also require a pin stamper for additional Dot Peen Marking on some of the armored sheet metal and parts. The model that meets this requirement is the Telesis Benchmark 460 Fully Portable model and is also included in the table below.
The prices for all the selected scanners and part marking equipment are shown in the following table as well as the quantities of each scanner that will be required.
COST ANALYSIS
This means that on average each project should receive 21000 different kanban cards at an estimated cost of R1.79/card. A bar coding solution will be the first stage of moving to an LM environment and will typically reduce queue lengths, improve productivity, material visibility and. The second phase of the project is to use all the data available from the system to start implementing the pull principles, fine-tuning the eKanban system.
Some of the key data will be capturing supplier delivery time, waiting time, queue time as well as production time. From this data the OMC will be able to calculate the exact holding costs, waiting cost as well as the impact of JIT against their current methods. Finally, the third phase of the project will be to move to a JIT environment and continuously improve all processes using data from phase 2.
Currently, OMC is working at 65% productivity and on average 2% of all materials purchased become obsolete due to material misplacement and engineering changes. Many materials are ordered in large batch sizes when an engineering change occurs, leaving all the ordered materials that were ordered on the previous order obsolete. Final Project Report 51 A summary of the projected improvement percentages and savings is summarized in the table below.
EVALUATION AND FEASIBILITY STUDY OF PROJECT
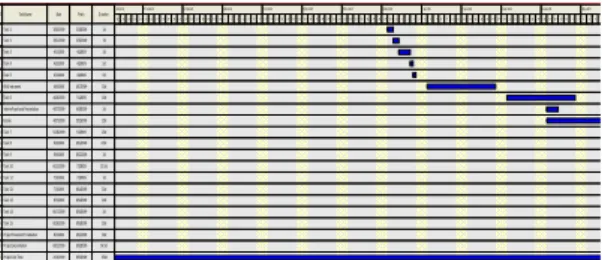
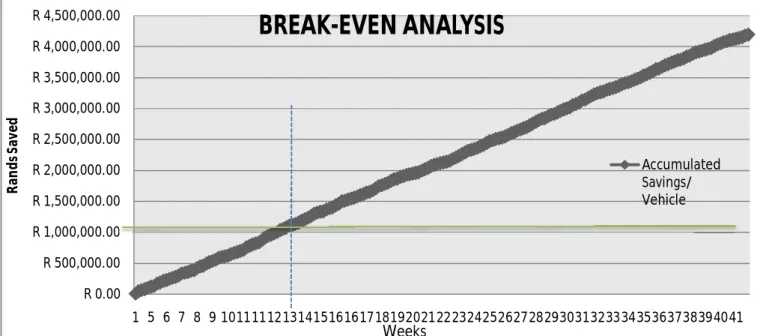
Of all current tenders that OMC is busy with, it is expected that OMC will order about 200 vehicles per year over the next 3 years. An anticipated schedule for 2010 was prepared as well as the accumulated projected savings for each vehicle built in a Monte Carlo simulation to simulate the event of uncertainties. Equipment maintenance costs are eliminated as all products come with a full 3-year warranty and maintenance plan.
A graph was drawn from the Monte Carlo Simulation data in Appendix F to show when OMC can expect to break even on all equipment purchased. From the graph and the Monte Carlo simulation, it is observed that OMC will pay for all the equipment around the 14th week. Monte Carlo Simulation models are used to determine the average savings that OMC can expect over the next 3 years.
The expected ROI percentage of 21.41% makes the project to implement a barcode solution very promising. This means that if OMC only achieves 10% of what they aimed for, they will still benefit from the project.
CONCLUSION
FUTURE IMPROVEMENTS AND IMPLEMENTATION PLANS
SCAN NEW PART – IF NO NON-SUFFICIENT PRODUCT IDENTIFIED = PROCESS COMPLETE STOCK LEVEL= STOCK RECEIVED – WIP – QUANTITY USED. NON-OCCURRENT / SCRAP PARTS SCAN AND SELECT SCRAP/REWORK SEND TO CORRECT LOCATION UPDATE STOCK LEVEL OF SUPPLEMENT. STOCK LEVEL= STOCK RECEIVED – NUMBER OF USED NON-OCCURRENT / SCRAP PARTS SCAN AND SELECT SCRAP/REWORK SEND TO CORRECT LOCATION.
NON-CONFORMING PART / SCRAP SCAN AND SORT SCRAP / REWORK SEND TO CORRECT LOCATION UPDATE STOCK RECEIVED UPDATE JOB COST BOOK STOCK WIP NONE RECEIVED. Stock Description GOODS RECEIVED STORE PAINT INTEGRATION PUD FABRICATION Start/Start Stock/inventory LEFT IN STOCK LEFT IN STOCK LEFT IN STOCK. WIP STOCK QUANTITY RESERVED QUANTITY RESERVED QUANTITY RESERVED QUANTITY RESERVED.
NON-CONFORMING # OF PARTS WITH DEFECTIVE # OF PARTS WITH DEFECTIVE # OF PARTS WITH DEFECTIVE # OF PARTS WITH DEFECTION # OF PARTS WITH DEFECTIVE # OF PARTS WITH DEFECTIVE. STRAIGHT PRODUCTS IN LINE= REM INTEGRATION IN STORE PRODUCTS= STORE PRODUCTS REMAINING TO BE PAINT IN INTEGRATION= PAINT + INTEGRATION IN STORE PRODUCTS IN INTEGRATION= STORES + INTEGRATION. ROUTE THROUGH PART # Station or destination routing project number PI300238-PO1S3 Paint on Integration Project 1 Station 3 Integration I2390092-PO2S1 directly Project 2 Station 1 SI3009543-PO1S5a Save then Integration Project 5-20Si 5-20Si (Project of Integration 1-St20) stores for integration Project 1 Station 3.
When parts are reordered due to a pick list error or shortages, a new issue requirement is posted. Couldn't have already made a list to identify issues from the pick list, if production has a problem and it's not on that list, then check the list again, still not found, they made a mistake and need another submit request / order Avg. lost hours / vehicle 122 hours Avg. Rands lost in obsolete inventory R 63,754.58 Total project cost Min. expected lost hours/vehicle 45 hours Min expected lost Rands in obsolete inventory R 15,000.00.