Internal Migration and Poverty in KwaZulu-Natal: Findings from Censuses, Labor Force Surveys and Panel Data. We then present our findings and present an analysis of migration and poverty in KwaZulu-Natal.
Spatial nature of migration
Overall, most analyzes of migration support the finding that a significant proportion of internal migration in South Africa takes place within provinces (Wentzel et al., 2006). In support of this finding, the 1996 census identifies Gauteng as both the largest source and destination of internal migration in South Africa.
Financially motivated
The authors note that migrant networks, although not exactly pull factors, are important facilitators of migration, which is fragile and currently threatened by politics (Gelderblom and Adams, 2006). While some analysts have argued that receipt of a social pension in South Africa is associated with a negative effect on the labor supply for eligible households, the authors (2004) use data from 1993 to demonstrate that a social pension for women in a household has a positive effect on labor supply for non-resident household members (labour migrants).
Migration on the rise: increasingly female driven?
Data limitations have to some extent contributed to the lack of analyzes of migration and poverty in South Africa. However, defining migration remains an important step in the analysis of migration data (Kok and Collinson, 2006).
Census data
First, the rapid demarcation of district municipalities and magisterial districts in the immediate post-apartheid era prevents accurate comparisons between spatial areas. To examine migration trends in the province, we turn to the 1996 and 2001 censuses as the most representative and comparable datasets at the district level. With these three categories in mind, the authors define migration as "the crossing of the boundary of a predefined spatial unit by persons involved in a change of residence" (Kok et al.
Then to work with the census data, Kok et al. 2003:10) suggests simplifying the definition to, 'a change in the magisterial district of habitual residence'. The main limitation of the census data is that no more specific questions about migrants or labor migrants were included in the 2001 census. Changes in the socioeconomic status (SES) of households is one of the key measures of interest and, for the census data, efforts could be made to estimate a more robust SES index that would best capture the relationship between migration and household well-being investigation.
PCA is useful for its ability to assign weights to variables so that the components created explain most of the variation in the original variable and can then be used as a proxy for them.
Labour Force Surveys: migrant labour supplements
These facilities include a water source, toilet facilities and whether the household has access to electricity. The assumption made here is that these factors are accessible at the household level and are therefore part of household consumption, the availability of which is determined by household affordability. In this case, migrant workers are defined as those household members who have been separated from the household more than five days per week on average over the past four weeks.
From both sets of questions, migrant workers from KwaZulu-Natal and living in other provinces or countries can be identified. A major drawback is that migration issues are not necessarily included in all waves of labor force surveys. Another limitation of the LFS, and more specifically of migrant data, is that it cannot determine the labor market characteristics of those perceived as migrant workers.
Answers to questions in the migrant file are also likely to have problems related to outdated, incomplete and insufficient data (ie answers about migrant workers may not be current as they are based on approximation).
KwaZulu-Natal Income Dynamics Survey (KIDS)
What is the value of both goods and money that...has given this household in the last month. This is a consumption-based figure calculated using the 'cost-of-basic-needs' approach and is agreed to be a '...reasonably lower poverty line for South Africa' (Hoogeveen and Ozler, 2004: 9 ). Equivalence scales are not used in this analysis as intra-household consumption patterns are assumed to be complex – and particularly so in migrant households where remittances may be unevenly distributed within households (Posel, 2001).
Furthermore, some researchers have suggested that economies of scale are not necessarily present among households whose consumption consists solely of food, clothing, and shelter (Lipton and Ravallion). Perhaps the most important limitation of the KIDS data as a source of information on migration is that the data are not representative and there is no doubt about the reasons for migration. The gender of the non-resident household members sending remittances also cannot be inferred from the questionnaire.
Moreover, although the data allow us to compare income levels and incidence of poverty over time between migrant and non-migratory households, causality remains difficult to determine regarding the link between migration and poverty.
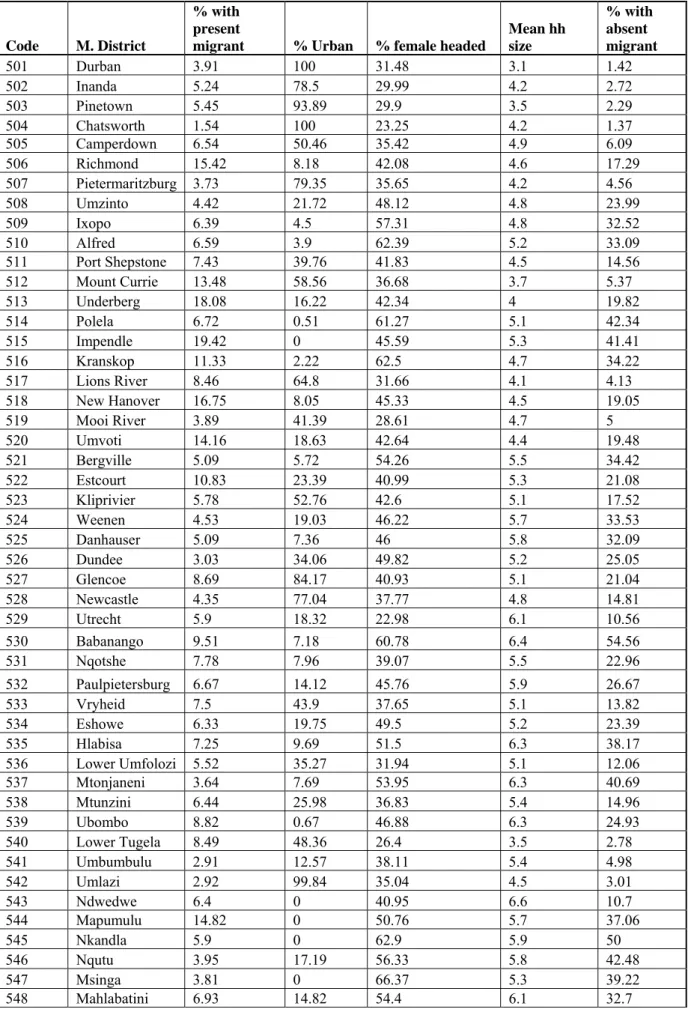
Migration trends in KwaZulu-Natal
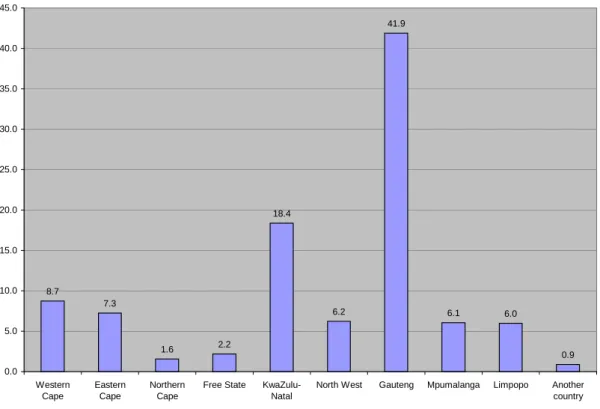
The same trend applies when looking at those members of the working-age population who have been identified as migrant workers. In terms of sending areas as indicated by place of origin, a number of places send people of working age to the province of KwaZulu-Natal. A notable trend is that the sending areas are largely located within KwaZulu-Natal province and the Eastern Cape (not shown in the figure).
Characteristics of magisterial districts
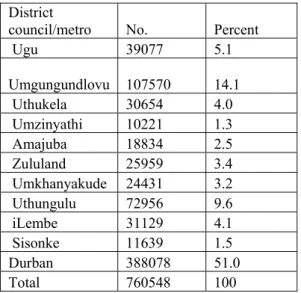
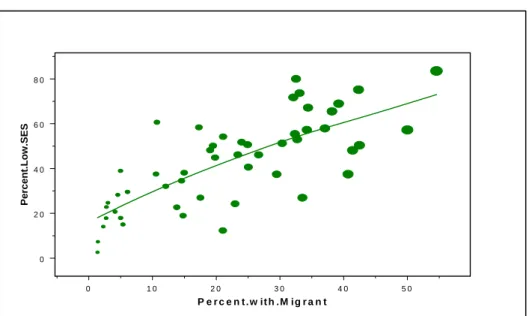
Mtonjaneni district had the highest proportion of families with missing members in 1996 and 2001, while Impendle, Mapumulo and Umvoti show a drastic decline in these proportions by 2001 (as shown in the bottom right of Figure 2). As expected, metropolitan districts that are predominantly rural have higher average household sizes and a higher proportion of households that have members away due to migration. A closer examination of the above table also suggests a relationship between female headship, rural/urban residence and lack of members due to migration.
All magisterial districts with more than a quarter of households with members absent are mostly rural and female-headed. Migrant receiving areas such as Durban and surrounding areas, and Pietermaritzburg have less than 10% of households with a migrant member gone. Babanango is a special case with the highest percentage of households with an absent member and the second highest household size and two thirds of households headed by women.
MA districts with a high percentage of poor households also have a high percentage of absentee households.
Characteristics of migrants and migrant workers
However, there is a need for research into the livelihood strategies of young and unmarried migrant workers in KwaZulu-Natal. Although the LFS does not allow us to identify the occupations and economic sectors of migrant workers in KwaZulu-Natal, it is logical to conclude that the majority of migrant workers in this province are likely to be in low-wage jobs. According to the LFS, there appears to be a link between the level of education and place of residence of migrant workers in KwaZulu-Natal (Table 4).
However, private housing is also occupied by a significant number of migrant workers without any form of education. The inverse relationship between educational attainment and residence in a workers' hostel is probably the result of the employment opportunities available to migrants who have passed matric or obtained higher education. Finally, Table 5 shows a broad degree of agreement across all three datasets used in this analysis.
The results confirm that internal migrants in KwaZulu-Natal are increasingly female, often well-educated, engaged in some form of employment, never married, and are usually heads of households or the children of heads of households in the sending household.
Characteristics of migrant households
Remittances
Migrant households and poverty
With a description of migrant households (households reporting at least one non-resident member), a number of distinctive features can be seen. Between 1993 and 1998, immigrant households reported a small increase in the number of nonresident household members (not shown in the table). In terms of employment, migrant households report a higher number of unemployed household members (both resident and non-resident).
The difference becomes pronounced in the first two years of the survey, as the prevalence of household poverty was 51.8% of migrant households in 1993 and 68.9% in 1998. Of those households that received remittances (either in cash or in kind) in 1993, 63.3% of those re-surveyed in the 1998 wave were classified as migrant households. A smaller number of these households (58.4%) reported receiving remittances again in 1998, although poverty appears to have increased from 51.8% to 67.6% of this group between these two years.
These results suggest that a significant proportion of migrant households receive remittances and that poverty levels are similar for migrant households and households receiving remittances.
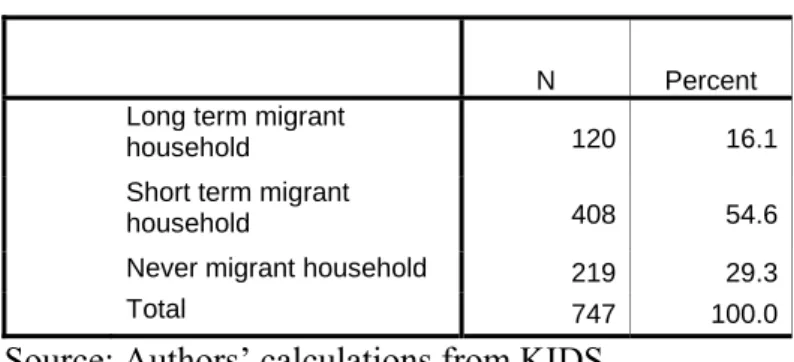
The well-being of migrant households over time
Long-term migrant households again report the highest level of downward mobility (24%), but a marked improvement in upward mobility (36.7%). This finding supports the general conclusion of the migration literature that rural-rural, intra-district and intra-provincial migration flows are still an important part of migration patterns in post-apartheid South Africa. Statistics Analyzes of South African census data as well as our calculations from labor force surveys show that migration patterns vary significantly by province.
We conclude with a call for census questionnaires to include more information about migration—particularly about the intentions and outcomes of migration (both in sending and receiving households) in order to determine the kinds of migration trends that are occurring. occur in South Africa. In particular, reintroducing a distinction between migrants and labor migrants in the census questionnaire would provide a more detailed picture of migration within South Africa and allow a greater level of comparability between data sets. Bureau of Labor Statistics: Washington D.C. Health Consequences of Migration: Evidence from Rural North East South Africa.
Migration, Sexuality and the Spread of HIV/AIDS in Rural South Africa.” Migration Policy Series no. Remittances and Development: The Impact of Migration to South Africa on Rural Livelihoods in Southern Zimbabwe.” Development South Africa. Labor Migration and Households: A Reexamination of the Labor Supply Effects of the Social Pension in South Africa.'