I would like to appreciate the efforts of the General Secretariat of the National Energy Council in publishing the book Indonesia Energy Outlook 2021. The wording of Indonesia Energy Outlook 2021 is an annual publication of the General Secretariat of the National Energy Council and has been published since 2014.
NATIONAL ENERGY RESILIENCE AND PROGRAMS
LIST OF TABLES
BACKGROUND
METHODOLOGY
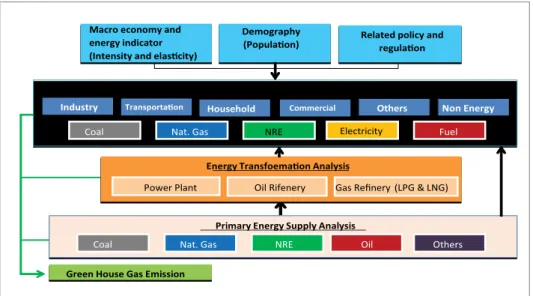
- Modeling Analysis Framework
1 INTRODUCTION
ENERGY PROJECTION SCENARIO .1 Realistic Scenario (BaU)
- Optimistic Scenario
Meanwhile, the development of the thermal power plant also refers to RUPTL 2021-2030 with the status of the plan until construction. The realistic scenario RUPTL 2021 refers to the current state and the future projection is assumed based on the historical data of the past few years such as additional city gas, electric stove, electric vehicle and others.
Energy-related Policy Assumption
RUPTL 2021-2030
- CURRENT ENERGY CONDITION
- Coal
- Renewable Energy
- New Energy
- FINAL ENERGY CONSUMPTION BY SECTOR
- ELECTRICITY CONSUMPTION BY SECTOR
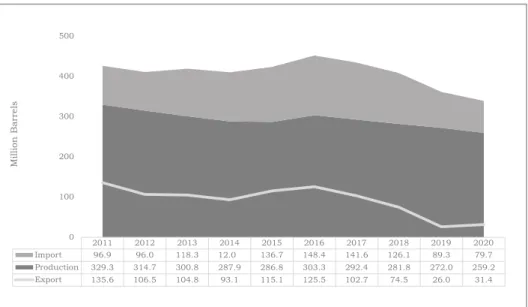
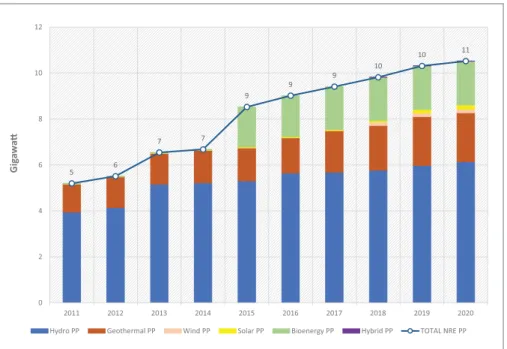
On the demand side, the demand for fuel including domestic biodiesel in 2020 amounts to 413 million barrels/year which is met by domestic refinery production and import. The utilization of new renewable energy for the power plant in 2020 is 10.5 GW or 14.4% of the total capacity of the power plant.
2 NATIONAL ENERGY
CONSUMPTION UNTIL 2020
PRIMARY ENERGY CONSUMPTION
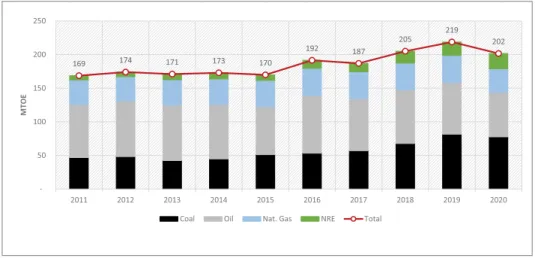
A number of energy-related policies such as energy diversification, energy efficiency and Indonesia's commitment to the international world would give an impact on a more rational primary energy consumption pattern. The primary energy types dominating the energy supply mix in 2020 are coal at approx. 38.5% of the national total, followed by oil at approx. 32.8%, gas of approx. 17.4% and NRE of approx. 11.3%.
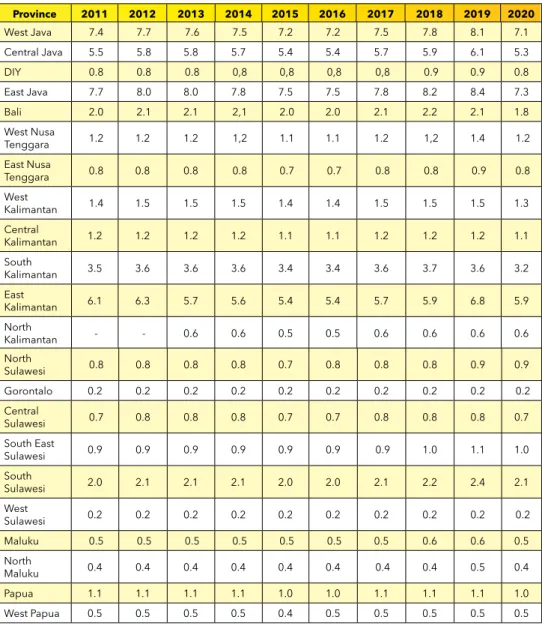
FUEL AND LPG CONSUMPTION PER PROVINCE
Based on region, the largest LPG consumption share is Java Bali at 66%, followed by Sumatera at 19% and Sulawesi at 7% (Table 2.2). The largest LPG consumer with 96% consumption is household, with the remainder being the commercial and industrial sector.
ENERGY ELASTICITY AND INTENSITY
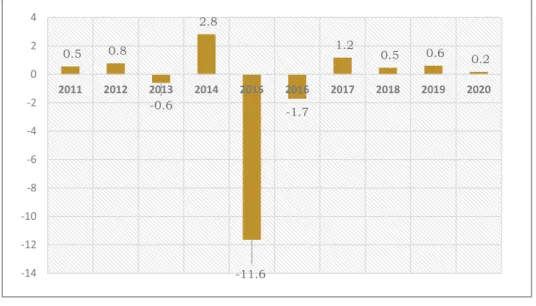
Meanwhile, the primary energy intensity is a comparison between primary energy supply and gross domestic product (TOE/Billion Rupiah). Based on the RUEN, the primary energy intensity projection was supposed to decrease by 1% every year, but the real Indonesia's primary energy intensity from 2012-2020 has been fluctuating as shown in Figure 2.10.
ENERGY PRICE
- Electricity Price
- Fuel Price
- Natural Gas Price
- LPG Price
- Coal Price
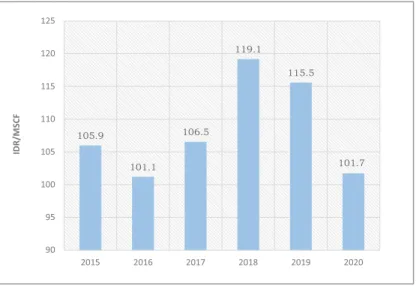
Meanwhile, since 2014, the fuel subsidy has been removed and the price follows the economic price. The trend of diesel fuel price in the last five years is presented in Figure 2.11. The price of gas is determined based on the agreement between the seller or supplier and the buyer (consumer).
Since 2015, however, the government has issued regulations on gas price for industries due to the high gas price in industry. In 2016, the government issued policy related to gas price at 6 US dollars per MMBTU as stipulated in Presidential Regulation No. In this ministerial decision, seven industries will receive gas at the price of 6 US dollars per MMBTU, namely.
LNG is one of the types of energy that receives the biggest subsidy that burdens the state budget.
EMISSION
ENERGY INFRASTRUCTURE .1 Oil Refinery
- LPG Refinery
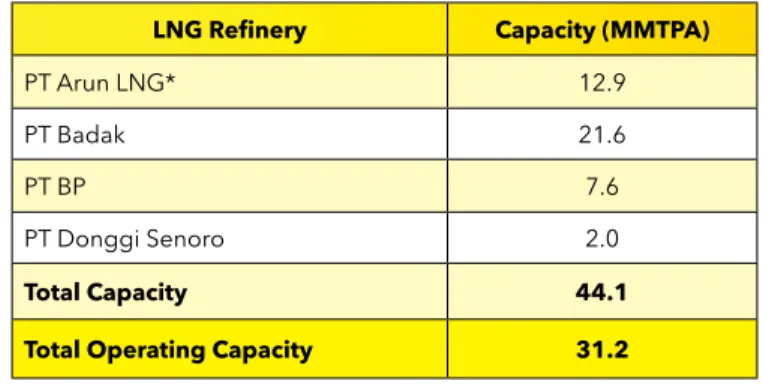
- LNG Refinery
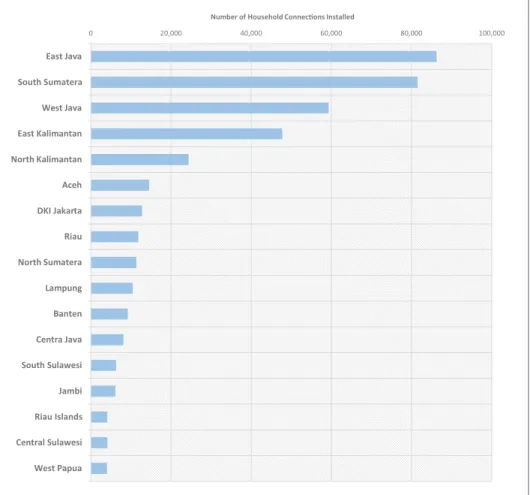
- City Gas Network
- Power Plant
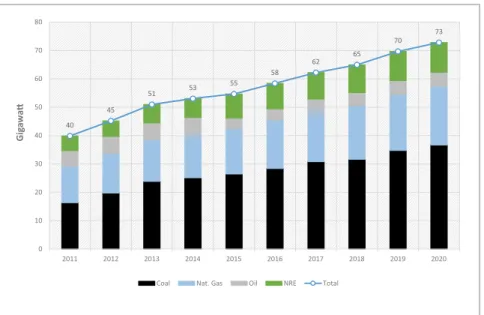
By the end of 2020, Indonesia's total power plant capacity is 73 GW, consisting of 70 GW on-grid power plant and 3 GW off-grid power plant. This capacity shows that the additional power plant capacity has almost doubled in the last ten years as shown in Figure 2.17. The power plant is still dominated by coal which contributes almost half of the total national capacity.
Of the total national capacity, the majority of power plants are operated by PLN with a capacity of 43 GW (59.5%) followed by IPPs with a capacity of 20 GW (28%). Meanwhile, power plant produced by Private Power Enterprises (PPU) and Fuel Free Operating License contribute 4 GW (4.9%) and 6 GW (7.9%) each. Power plant infrastructure extends to all areas in Indonesia, but only 64% of power plant capacity is built in Java-Bali (Figure 2.19).
Meanwhile, the power plant capacity is only 19% in Sumatera, 6% in Kalimantan, 7% in Sulawesi and no more than 4% in the eastern region of Indonesia (Papua-Maluku-Nusa Tenggara) of the total national capacity.
3 2022 OUTLOOK
FINAL ENERGY CONSUMPTION
- Household Sector
- Transportation Sector
- Industrial Sector
- Commercial Sector
- Other Sectors
The trend of the increase in final energy consumption based on energy types is shown in figure 3.3. In general, household energy consumption is used for cooking, lighting (lamp), cooling (AC) and others (water pump, iron, refrigerator). In the modeling, household energy consumption is divided into Stove and Non-stove (refrigerator, lighting, AC and others).
Energy consumption in the commercial sector includes activities in offices, shopping malls, hotels, restaurants, hospitals, schools and other services. In 2022, energy consumption in the commercial sector will be dominated by electricity at 87% and LPG at 4%. Final energy consumption in other sectors such as the industrial sector is also experiencing a decline of about 2% to 1.4 MTOE during the pandemic.
In 2022, final energy consumption in other sectors will increase by 7% to 1.5 MTOE when the economy grows.
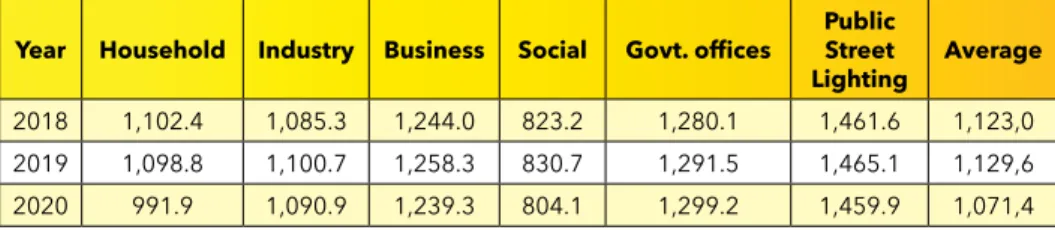
ELECTRICITY CONSUMPTION PER SECTOR
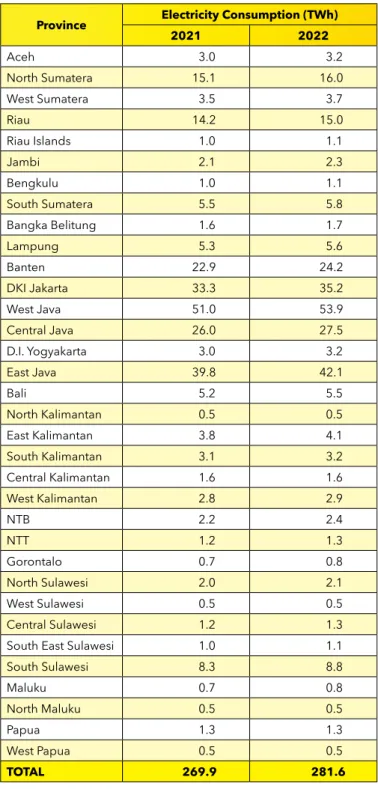
ELECTRICITY CONSUMPTION PER PROVINCE
- Power Plant Capacity by Type 2020-2022
- Additional Power Plant Capacity in 2021 and 2022
- Electricity Production by Type in 2020-2022
The additional plant is used to provide electricity supply along with a projection of 6% increase in electricity consumption until 2022. Meanwhile, the share of NRE-based plant will only be around 14% of Indonesia's total capacity in GW). Therefore, the additional regional capacity in JMB (Java, Madura, Bali) will be equal to 89% of the total additional power in 2021.
55 Indonesia Energy Outlook 2021 Gas will play quite a large role in additional power plant capacity of approx. In 2022, the goal is for the coal-steam power plant to contribute 60% of the total additional capacity in 2022. The use of gas is expected to contribute 31% of the planned additional power plant capacity in 2022.
Together with the development of the power plant project, the production of electricity from coal-fired steam PP will reach 54% of the total electricity production in 2022.
PRIMARY ENERGY SUPPLY IN 2020-2022
- Primary Energy Mix
ELECTRICITY CONSUMPTION PER CAPITA
- Primary Energy Per Capita
EMISSION
ENERGY BALANCE 2022
ENERGY POLICY
- Oil and Gas
- Coal
- Renewable Energy
Also, the Ministry of Energy and Mineral Resources has issued Ministerial Regulation No. 08 of 2017 for the PSC Gross Split scheme. The calculation of the gross allocation varies for each work area, but the basic calculation rests on the percentage of the basic allocation. This makes the gross division more attractive for investors to operate the oil and gas working area, including the unconventional working area that has the most challenges.
As of June 2019, 42 contracts use gross apportionment consisting of 21 destruction, 16 tender work areas and five modification work areas from cost recovery to gross apportionment. Offshore Northwest Java (ONWJ) operated by Pertamina Hulu Energi (PHE) is the first work area with a gross distribution scheme. Gross distribution is focused on work areas with extended contract and new work area contract to respect the ongoing contracts until they expire.
In 2018, the Government of Indonesia through the Ministry of Energy and Mineral Resources issued Ministerial Regulation No.
COMPARISON OF FINAL ENERGY CONSUMPTION PER SECTOR
4 ENERGY OUTLOOK
PROJECTION 2021-2030
- Industrial Sector
- Transportation Sector
- Household Sector
- Commercial Sector
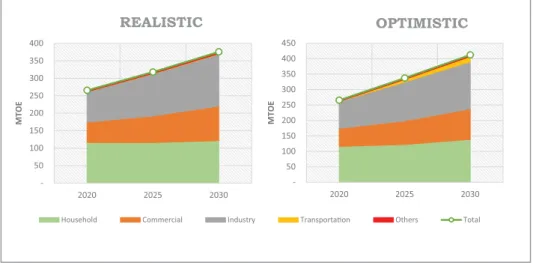
The complete overview of the final energy demand share per type of energy in 2030 is presented in Figure 4.3. The high energy consumption in these industries is affected by the use of old machines. As a result, the energy demand for private vehicles is increasing and is still dominated by fuel.
In 2030, the consumption of electricity by cars is estimated to be approximately 287 thousand TOE (2.3%) in the optimistic scenario and 175 TOE in the realistic scenario. Household energy demand is not only affected by the growing number of households, but also by the pandemic. Total gasoline consumption drops to 86% in the optimistic scenario and remains at 98% in the realistic scenario of the motorcycle's total energy consumption.
The final energy demand in the household sector based on the realistic and optimistic scenario is shown in figure 4.9.
MTOE
- Other Sectors
- ELECTRICITY CONSUMPTION PROJECTION PER SECTOR
- ELECTRICITY CONSUMPTION PER CAPITA
- ELECTRICITY PROJECTION .1 Electricity Production
- Power Plant Capacity
- PRIMARY ENERGY SUPPLY PROJECTION PER TYPE
The projection of electricity demand for the sector in 2030 for each scenario is presented in Figure 4.12. The electricity production by energy type for all three scenarios can be seen in Figure 4.14. Meanwhile, in the same year, the share of electricity production from the Solar Power Plant compared to other NRE power plants in the Optimist scenario will increase by about 10%.
79 Indonesia Energy Outlook 2021 The capacity of the NRE power station in 2030 will increase to 13 GW in a realistic scenario and 27 GW in an optimistic scenario. The trend of the power station capacity in the realistic and optimistic scenario can be seen in Figure 4.17. In the realistic scenario, the use of coal in power plants is expected to increase compared to the use of NRE.
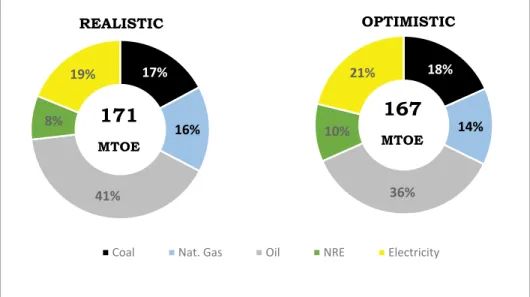
Primary energy supply in Optimistic scenario is used to optimize NRE to increase the NRE share in the NRE energy mix in 2025, as shown in Figure 4.18.
Realistic 2030
In 2030, the primary energy mix in the realistic scenario shows a higher share of coal, while the share of NRE remains the same (Figure 4.19). The use of fossil fuels especially coal and NRE for power plants will greatly affect the primary energy mix in the future.
Optimistic 2030
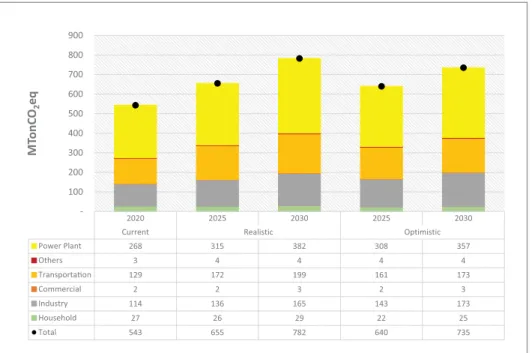
PROJECTION OF CARBON EMISSION PER CONSUMER SECTOR
The total emission in 2030 is expected to increase to 782 million tonnes CO2eq (realistic) and 735 million tonnes CO2eq (optimistic). The emission in 2030 in the optimistic scenario specifically in the transport, household and power plant sectors is lower compared to the emission in the realistic scenario. This condition is affected by massive substitution of LPG for electricity and gas in households.
In the transport sector, emission reduction is affected by the substitution of gas and biofuel as well as electricity with a larger scale compared to in realistic scenario. Meanwhile, the low emission in power plant in Optimistic scenario is influenced by the high NRE power plant capacity compared to in Realistic scenario. The trend of GHG emission in both scenarios by sector is shown in Figure 4.22 below.
The summary of some energy indicators based on the Government Regulation on the National Energy Policy is presented in Table 4.1.
NATIONAL ENERGY RESILIENCE CONDITION
5 NATIONAL ENERGY RESILIENCE AND PROGRAMS FOR SUSTAINABLE
ENERGY DEVELOPMENT
- ELECTRICITY FOR RURAL AREAS AND ENERGY SUPPLY FOR OUTERMOST, REMOTE AND DISADVANTAGED AREAS
- CITY GAS
- PROMOTING INDUCTION STOVE AS FOSSIL FUEL SUBSTITUTION Since 2015 to 2020, the cumulative of LPG subsidy from the government is 219 trillion
- THE DEVELOPMENT OF ELECTRIC VEHICLE
- CARBON TAX AND EMISSION INTENSITY REDUCTION
- PREPARING ENERGY TRANSITION
The government will also build a mini-grid and NRE-based power plant for people living in remote areas. The government of Indonesia needs significant funds to limit greenhouse gas emission reductions and to meet the Nationally Determined Contribution (NDC) target. The Indonesian government is preparing a Presidential Regulation on the Economic Value of Carbon and a Presidential Regulation on the National Inventory of Greenhouse Gases and Low Carbon.
Cap is defined as the upper margin of greenhouse gas emissions set by the government or state administrator. Tax collection will take place if the power plant produces CO2 above the ceiling (emission upper margin) set by the government. The Indonesian government has developed Ultra Super Critical (USC) technology in steam PP from the Jawa-7 steam PP located in Serang (Banten) in 2017.
In 2020, the Government of Indonesia conducted a feasibility study of the CCUS pilot project in Gundih field, Central Java.
INDONESIA
ENERGY OUTLOOK