183 Gadjah Mada International Journal of Business - May-August, Vol. 14, No. 2, 2012
A Comparative Analysis of the Productivity of Islamic and
Conventional Mutual Funds in Indonesia:
Data Envelopment Analysis (DEA) and
General Least Square (GLS) Approaches
M. Shabri Abd. Majid
Syiah Kuala University, Banda Aceh, Indonesia
Hartomi Maulana
Islamic Economic Forum for Indonesian Development (ISEFID), Malaysia
Gadjah Mada International Journal of Business
Vol. 14, No. 2 (May - August 2012): 183 - 208
Corresponding authors. E-mail: [email protected]
ISSN: 1141-1128
http://www.gamaijb.mmugm.ac.id/
Abstract: This paper is an extended version of our earlier study (Abd. Majid and Maulana 2010) to further re-examine the relative efficiencies of selected Islamic and conventional mutual funds companies in Indonesia during the period 2004 to 2007 and their determinants. To measure their efficiencies, the output-input data consisting of a panel of conventional and Islamic mutual funds companies are empiri-cally examined based on the most commonly used non-parametric approach, namely, Data Envelop-ment Analysis (DEA). It also attempts to investigate the influence of the mutual funds companies’ char-acteristics on efficiency measures using the Generalized Least Square (GLS) estimation.
The study finds that, on average, the Indonesian mutual funds companies experienced a decrease in Total Factor Productivity (TFP) growth. It is mainly caused by a decline in both efficiency and technical efficien-cies, where the efficiency change is largely contributed by the changes in pure efficiency rather than scale efficiency. Additionally, the study also documents that the funds size negatively affects efficiency. This indicates that due to its diseconomies of scale, a larger mutual funds company is less efficient than a smaller funds company. Finally, in comparing the efficiency of the mutual funds companies, the study finds that, on average, the Islamic unit trust companies perform more poorly than their conventional counterparts.
Abstrak: Tulisan ini adalah versi ringkas dari penelitian kami sebelumnya (Abd. Majid dan Maulana 2010) untuk lebih meneliti kembali efisiensi relatif yang dipilih perusahaan Islam dan konvensional reksadana di Indonesia (2004-2007) dan penentunya. Untuk mengukur efisiensinya, output-input data yang terdiri dari sebuah panel konvensional maupun syariah perusahaan reksadana secara empiris diteliti berdasarkan pada pendekatan non-parametrik yang paling umum digunakan, yaitu, Data Envelopment Analysis (DEA). Hal ini juga mencoba untuk meneliti pengaruh karakteristik reksa dana perusahaan pada efisiensi langkah-langkah dengan menggunakan estimasi Generalized Least Square (GLS).
Keywords: Data Envelopment Analysis (DEA); efficiency; Generalized Least Square (GLS); Indonesia; Islamic capital market; Mutual funds
185 Gadjah Mada International Journal of Business - May-August, Vol. 14, No. 2, 2012
Introduction
Measuring and comparing the perfor-mances of mutual funds’ companies have become a main concern for investors and managers in the finance industry.1
Informa-tion about the performances of mutual funds is one of the major considerations taken into account by investors in the fund-selection decision. Meanwhile, by referring to mutual funds’ performances, it enables fund manag-ers to move towards better pricing, attract-ing greater inflow of funds and improvattract-ing their profitability. Thus, knowing their per-formances, fund managers can design a proper strategy and policy to improve their competi-tive ability against their competitors.
Unlike many empirical studies that have been conducted to investigate the perfor-mances of conventional mutual funds, stud-ies on the performance of Islamic mutual funds have been meagre. Among them are those that were conducted by Annuar et al. (1997); Hayat (2006); Md. Taib and Isa (2007); Abdullah et al. (2007); and Ferdian and Dewi (2007). By using the model de-veloped by Treynor and Mazuy (1966), Annuar et al. (1997) examined the perfor-mances of 31 conventional and Islamic mu-tual funds in Malaysia for the period 1990-1995. They found evidence that these Ma-laysian funds outperformed their benchmark but were poor at timing the market. Further-more, they also found a positive correlation between the market timing ability and secu-rity selection ability. Meanwhile, Hayat (2006) utilized the Sharpe Ratio (SR), the Treynor Ratio (TR), the Information Ratio (IR), the Modigliani and Modigliani measure (MM), and the TT measure (TT) to empirically assess
the performances of 44 Islamic equity fund returns in Malaysia during the period from 17th August 2001 to 25th August 2006. He
found that the Islamic equity funds were rela-tively safe investment vehicles. During the normal market condition, there were no sig-nificant differences between the perfor-mances of Islamic and conventional funds. During the bear market of 2002, the Islamic equity funds however significantly outper-formed the conventional markets. Further-more, Islamic equity funds seemed to be most attractive as part of a larger fully diversified portfolio as they have good systematic risk-to-return ratios.
Unlike the above studies that only in-vestigated the performances of mutual funds in Malaysia, Ferdian and Dewi (2007) em-ployed the Sharpe, Treynor and Jensen In-dexes to comparatively explore the perfor-mances of 5 Islamic funds in Indonesia with 20 Islamic funds in Malaysia over the period October 1, 2005 to April 30, 2007. They found that the Malaysian Islamic funds seem to outperform the Indonesian Islamic mutual funds. This could be partly due to the fact that the Malaysian mutual funds have been relatively more established as compared to the mutual funds in Indonesia. All the above reviewed studies have used traditional meth-ods to investigate the performances of the Islamic mutual funds both in Indonesia and Malaysia.
One recent approach to the evaluation of mutual funds performance is by measur-ing its efficiency. Two approaches have been used to measure efficiency, namely paramet-ric and nonparametparamet-ric. The Stochastic Fron-tier Approach (SFA) –parametric and Data Envelopment Analysis (DEA)–
non-para-1 Mutual Funds are also generally called ‘Reksadana’ in the Indonesian acronym. As the term mutual funds are
metric, have been widely used in the litera-ture to measure the efficiency of mutual funds. The SFA is an econometric frontier approach which specifies a functional form for the cost, profit, or production relation-ship among inputs, outputs, and environmen-tal factors, and allows for random error. How-ever, SFA suffers from strong assumptions, particularly when econometrics has to deal with the hypothesis required on the distribu-tion of the inefficiency component and its independence from other factors determin-ing producer behavior.
Meanwhile, the DEA is a non-para-metric method that has been widely employed in operations research to compute relative measures of efficiency of mutual fund com-panies due to its advantages. DEA takes into account many factors that are associated with the funds’ performance and considers mutual funds’ performance indexes with different risk measures and investment costs. In addition, the DEA enables the identification of the relative importance among the inputs (trans-action costs); for example, we can observe the marginal contribution of each input in affecting returns (Jemric and Vujcic 2002). Since the DEA does not take into account random errors, we can assume that the error term is normally distributed (Pallegrina 2005). Therefore, the mathematical program-ming procedures used by the DEA for effi-cient frontier estimation is comparatively ro-bust (Seiford and Thrall 1990). Finally, the DEA also provides robust findings when the sample size of a firm is small (Maghyereh 2004; and Neal 2004).
In measuring performances of mutual funds, both in the developed and emerging economies, the DEA have been adopted by few studies. Murthi et al. (1997) and Choi and Murthi (2001) measured performances of mutual funds in the US, while Basso and
Funari (2001) and Galagedera and Silvapulle (2002) investigated performances of mutual funds in Italy and Australia, respectively. On the other hand, Chen and Lin (2006) assessed the performance of mutual funds in the emerging economy of China.
Abd. Majid and Maulana (2010) have assessed the performances of the conven-tional mutual funds in Indonesia, but no fur-ther empirical investigation was made to ex-plore the likely factor affecting their perfor-mances. As an extended version of our ear-lier study (Abd. Majid and Maulana 2010), this study does not only measure the perfor-mance of the conventional mutual funds, but it also explores the performance of the Is-lamic mutual funds in Indonesia. In addition, this study also attempts to determine the fac-tors affecting the performances of both con-ventional and Islamic mutual funds.
187 Gadjah Mada International Journal of Business - May-August, Vol. 14, No. 2, 2012
institutions involved in money lending and the charging of interest, such as banks and insurance companies. Other screening crite-ria prohibit investments involving the produc-tion, distribution and/or earning profits from alcohol, pornography, tobacco, gambling, weapons, music, entertainment, processing pork meat or non-halal meat, hotels and air-lines which serve alcohol.
Comparing and contrasting the produc-tivity of the two types of mutual funds in-dustry is important and relevant for Indone-sia, because of its dual financial system, in which Islamic mutual funds companies oper-ate parallel with their conventional counter-parts. The comparison thus sheds light on the performance of the Islamic mutual funds companies, whose operations are limited to selected shari’ah-compliant companies, as opposed to the conventional mutual funds companies which can invest in any suitable companies that can potentially give the high-est return. Ultimately, the findings of the study are expected to contribute towards improv-ing the productivity of the mutual fund in-dustry in Indonesia as a whole.
While the study of mutual funds’ per-formance is gaining attention in the devel-oped countries and some other emerging economies, research on an open-big devel-oping country of Indonesia has been in exist-ence. Despite the mutual funds’ industry (both conventional and Islamic funds) hav-ing experienced phenomenal growth in Indo-nesia, the study on performance and effi-ciency of the Indonesian mutual funds is highly important and timely. Thus, this study
attempts to re-examine the productivity of selected conventional and Islamic mutual fund companies in Indonesia using the DEA and GLS for the period of 2004 -2007 with the following specific objectives:
(i) To empirically re-examine the relative ef-ficiency of the mutual funds companies in Indonesia;
(ii) To compare the productivity of conven-tional and Islamic mutual funds in Indo-nesia; and
(iii)To empirically explore the effect of funds characteristics such as fund’s size and profitability on the efficiency of the mu-tual funds companies in Indonesia.
The rest of this study is structured as follows. Section 2 provides a brief overview of the Indonesian mutual funds industry in-cluding Islamic mutual funds. Section 3 de-scribes the data and discusses the methodol-ogy of the DEA. Section 4 presents the re-sults and analysis, and Section 5 concludes.
An Overview of Mutual
Funds’ Industry in Indonesia
According to the Capital Market Act No. 8 (1995), mutual fund refers to when an investment company, that has been approved by the Supervisory Capital Market of Indo-nesian Agency (BAPEPAM),2 pools money
from shareholders and invests in a diversi-fied portfolio of securities.3 Mutual fund
in-vestment is simple, accessible, and affordable. There are many advantages of investing through mutual funds such as professional
2BAPEPAM (Badan Pengawas Pasar Modal) is a capital market supervisory agency which reports and is responsible
to the Minister of Finance. BAPEPAM shall provide guidance, regulation, and day to day supervision of the capital market.
3 UU Pasar Modal RI, No.8 (1995), Bab IV [Capital Market Law Republic of Indonesia No.8 (1995) Chapter IV].
management, diversification, variety, liquid-ity, affordabilliquid-ity, convenience, and ease of record keeping as well as strict government regulations and full disclosure (Investment Company Institute 2004). Mutual funds were first introduced in Indonesia within the frame-work of the Capital Market Act No. 8 (1995). After the first mutual fund, BDNI Reksadana, was instituted in 1996, in the same year there were 25 mutual funds were established with the total amount of funds managed of Rp2.78 trillion (see Table 1). In 1997, the number of mutual funds has sig-nificantly increased to 77 (208 percent) from 1996 with the total funds managed of Rp4.91 trillion.
The development of the mutual funds’ industry in Indonesia has been very much in-fluenced by macroeconomic conditions. When the 1997 financial turmoil hit the coun-try, the growth of mutual funds slowed down. In 1998, the number of issuers only grew by 5.19 percent and the value of issuers de-creased dramatically by 39.22 percent from the year 1997. A worse condition occurred in the bond market where there was virtually no new issues during this period (BAPEPAM Master Plan 2005-2009).
However, the industry grew more rap-idly after 2002, due to the dramatic increase in fixed-income funds, which were invested mainly in the Rupiah-denominated govern-ment securities. Declining interest rates (and rising bond prices) provided a favourable en-vironment for launching recap bond funds. At the end of 2004, mutual funds were amounting to Rp104 trillion or US$10.4 bil-lion (see Table 1). In 2005, BAPEPAM re-ported that the number of managed funds dramatically fell by 72 percent from Rp104.04 trillion in 2004.
Moreover, when the world fuel price increased, which lead to cost-push inflation, the interest rate which called the Central Bank Certificate Rate (SBI – Sertifikat Bank Indonesia) rose to 12.75 percent. As a result, the banking industry has to increase its de-posit interest in order to attract more custom-ers. This condition might cause the investors to withdraw their funds from the mutual funds to the bank depository. Finally, in line with the Indonesian economic recovery agenda to lower interest rates, inflation, and to increase the stock market composite in-dex, the mutual funds become again more attractive for investors. The number of man-aged funds has significantly increased from Rp29.40 trillion in 2005 to Rp51.62 trillion at the end of 2006.
18
9
Gad
jah M
ada
Inte
rnati
ona
l Jou
rnal
of B
usin
ess
- M
ay-A
ugust,
Vol.
14, N
o. 2, 2
012
Table 1. Net Asset Value of Mutual Funds, 1995-2006 (in billion Rupiahs)
Indicator 1996 1997 1998 1999 2000 2001 2002 2003 2004 2005 2006
Money Market Fund 16 25 38 575 1,244 2,217 7,181 7,856 9,439 2,080 3,799 Fixed-Income Fund 1,898 3,439 1,894 2,744 3,062 4,661 37,336 57,485 88,059 13,924 19,542 Balanced Fund 350 862 522 729 650 635 1795 3734 4648 5,468 8,483 Equity Fund 519 590 539 927 560 491 302 402 1892 4,934 8,249
Protected Fund - - - - - - 3,008 11,327
Index Fund - - - - - - - 29
Tot. No of Products 2,782 4,917 2,992 4,974 5,516 8,004 46,614 69,478 104,038 29,415 51,991
Money Market Fund 6 21 22 23 26 29 31 20 31 33
-Fixed-Income Fund 12 31 32 31 35 46 61 116 146 170 160
Balanced Fund 1 3 4 5 8 10 17 30 46 78
-Equity Fund 6 22 23 22 25 23 22 20 23 30 34
Protected Fund - - - 18 76
Index Fund - - - - - - - 1
Total 25 77 81 81 94 108 131 186 246 329 403
4 BAPEPAM-LK is a merger of Capital Market Supervisory Agency with the General Director of Financial Institution (DJLK–Direktorat Jenderal Lembaga
Keuangan) that approved by the Government of Indonesia with the enactment of the President’s Rule No. 62 (2005). The merger of these two units of Ministry of Finance of the Republic of Indonesia would subsequently produce a single new unit simply called BAPEPAM-LK.
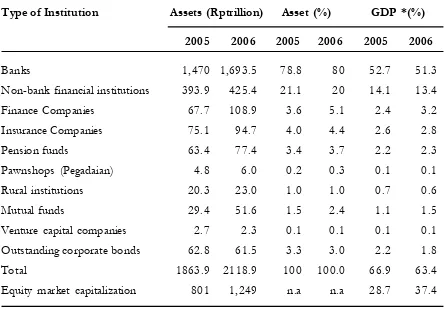
Hitherto, the mutual funds industry in Indonesia has been playing an important role in promoting economic growth of the coun-try. As reported by BAPEPAM, in 2006, the mutual fund industry experienced a positive increase after suffered a massive redemption in 2005. It can be seen from the increasing of the Net Asset Value from Rp29.40 Tril-lion in 2005 to Rp51.43 TrilTril-lion in 2006 which contributed 2.4 percent of total finan-cial assets and 1.5 percent of GDP or in-creased 0.4 percent of GDP from 2005 (see Table 2).
In Indonesia, the Islamic funds appear in almost all Unit Trust Management Com-panies (UTMCs). These funds are invested in Shari’ah-compliant financial assets such as
Shari’ah-approved stocks, Islamic bonds (Sukuks), Islamic deposits and money mar-ket instruments. An Islamic UTMC is one that offers only Shari’ah-approved funds. These can be equity, bond, or balance funds. Like conventional mutual funds, Islamic funds also impose the charge fees to investors. Basically, there are three types of fees, namely entry load (front load), redemption fees and man-agement expense ratio. Since the investors pay the management company fees and com-mission, the contract cannot resemble equity such as mudharabah and musharakah. It looks like the UTMC is appointed by investors as an agent (wakil) to manage the funds. Thus, the contract of agency (wakalah) seems to be more accurate. However, a UTMC does not
Table 2. Structure of Financial Sector
Type of Institution Assets (Rptrillion) Asset (%) GDP *(%)
2005 2006 2005 2006 2005 2006
Banks 1,470 1,693.5 78.8 80 52.7 51.3
Non-bank financial institutions 393.9 425.4 21.1 20 14.1 13.4
Finance Companies 67.7 108.9 3.6 5.1 2.4 3.2
Insurance Companies 75.1 94.7 4.0 4.4 2.6 2.8
Pension funds 63.4 77.4 3.4 3.7 2.2 2.3
Pawnshops (Pegadaian) 4.8 6.0 0.2 0.3 0.1 0.1
Rural institutions 20.3 23.0 1.0 1.0 0.7 0.6
Mutual funds 29.4 51.6 1.5 2.4 1.1 1.5
Venture capital companies 2.7 2.3 0.1 0.1 0.1 0.1
Outstanding corporate bonds 62.8 61.5 3.3 3.0 2.2 1.8
Total 1863.9 2118.9 100 100.0 66.9 63.4
Equity market capitalization 801 1,249 n.a n.a 28.7 37.4
Source: Bapepam-LK, Bank Indonesia, Indonesia Stock Exchanges (IDX), 2006.
191 Gadjah Mada International Journal of Business - May-August, Vol. 14, No. 2, 2012
serve as an agent (wakil) who is allowed to manage the funds without control and super-vision. To prevent moral hazards, a trustee is appointed to safeguard the interest of inves-tors. The trustee will act as a custodian to the funds and will ensure that investments are properly run according to the true label. Thus, it is correct to say that the trustee busi-ness runs on the contract of wadiah amanah.
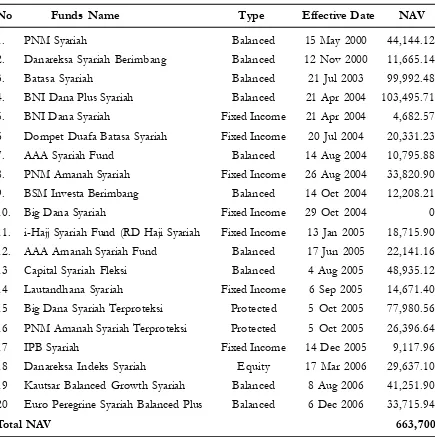
The first Islamic mutual funds (or Reksadana Syariah in Indonesian acronym) introduced in Indonesia was Reksadana PNM (Permodalan Nasional Madani) Syariah on 15 May, 2000 by PT. PNM Investment Manage-ment after the formation of the legal frame-work for Islamic mutual funds. During that year, Danareksa Syariah Berimbang was also established on 12 Nov, 2000 with the net as-Table 3. The Indonesian Islamic Mutual Funds in 2006 (in Million Rupiahs)
No Funds Name Type Effective Date NAV
1. PNM Syariah Balanced 15 May 2000 44,144.12
2. Danareksa Syariah Berimbang Balanced 12 Nov 2000 11,665.14 3. Batasa Syariah Balanced 21 Jul 2003 99,992.48 4. BNI Dana Plus Syariah Balanced 21 Apr 2004 103,495.71 5. BNI Dana Syariah Fixed Income 21 Apr 2004 4,682.57 6 Dompet Duafa Batasa Syariah Fixed Income 20 Jul 2004 20,331.23 7. AAA Syariah Fund Balanced 14 Aug 2004 10,795.88 8. PNM Amanah Syariah Fixed Income 26 Aug 2004 33,820.90 9. BSM Investa Berimbang Balanced 14 Oct 2004 12,208.21
10. Big Dana Syariah Fixed Income 29 Oct 2004 0
11. i-Hajj Syariah Fund (RD Haji Syariah Fixed Income 13 Jan 2005 18,715.90 12. AAA Amanah Syariah Fund Balanced 17 Jun 2005 22,141.16 13 Capital Syariah Fleksi Balanced 4 Aug 2005 48,935.12 14 Lautandhana Syariah Fixed Income 6 Sep 2005 14,671.40 15 Big Dana Syariah Terproteksi Protected 5 Oct 2005 77,980.56 16 PNM Amanah Syariah Terproteksi Protected 5 Oct 2005 26,396.64
17 IPB Syariah Fixed Income 14 Dec 2005 9,117.96
18 Danareksa Indeks Syariah Equity 17 Mar 2006 29,637.10 19 Kautsar Balanced Growth Syariah Balanced 8 Aug 2006 41,251.90 20 Euro Peregrine Syariah Balanced Plus Balanced 6 Dec 2006 33,715.94
Total NAV 663,700
set value (NAV) amounting to Rp11.66 bil-lion. Generally, the growth of Islamic mutual funds in the country has been very promis-ing.
Three years later in 2003, there were three Islamic funds established with the total NAV at Rp155.8 billion. Seven Islamic funds were declared effective in 2004 with the NAV amounting to Rp185.33 billion. Thus, at the end of year 2004 there was a total of ten Is-lamic funds that were on offer to the public with the total NAV at Rp341.13 billion. In 2005, the Islamic mutual funds still grew with the issuance of 7 new Islamic mutual funds, which included two protected funds (see Table 3). It means that in total, there were 17 Islamic Mutual funds (5.2% from the total number of mutual funds). However, the NAV posted a decrease as a consequence of the declining trend of the bonds market during 2005. The NAV of Islamic mutual funds reached its peak at 1.19 trillion in August before it declined to Rp559.01 billion at the end of the year in 2005 (Bapepam Annual Report 2005).
During 2006, three new Islamic mutual funds were licensed. This means that in terms of the total number of funds, there was a 17.6 percent annual growth. In terms of to-tal NAV there was an annual growth of 18.7 percent. Thus, there was a total of 20 Islamic mutual funds (or 5% of total mutual funds combined) with total NAV as of 22 Decem-ber 2006 of Rp663.7 billion (or 1.3% of to-tal NAV of all mutual funds).
Methodology and Data
The methodology used in the study is divided into two stages. In the first stage, the efficiency measures are examined by
apply-ing the Data Envelopment Analysis (DEA) approach and in the second stage, the effi-ciency measures are regressed against the mutual funds’ specific characteristics based on Generalized Least Square (GLS) estima-tion.
Data Envelopment Analysis
(DEA)
The methodology used the Data Envel-opment Analysis (DEA) approach to measure the relative performance of selected mutual funds in Indonesia. It is a suitable method to be used in this study as our sample size is small (Maghyereh 2004; and Neal 2004). Additionally, DEA is not vulnerable to the disproportion of small sample error as in the econometric model (Dogan and Fausten 2003). We specifically uses the generalized output-oriented Malmquist index, developed by Fare et al. (1989) to measure the contri-bution from the progress in technology (tech-nical change) and improvement in efficiency (efficiency change) to growth of productiv-ity of the Indonesian mutual funds’ indus-tries. The Malmquist indexes are constructed using the DEA and estimated using a pro-gram developed by Coelli (1996).
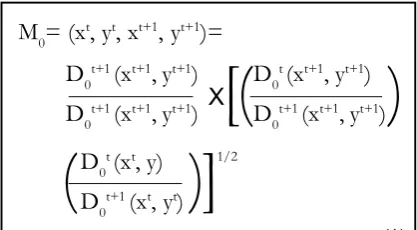
Following Fare et al. (1989), the Malmquist productivity index is written as Equation 1.
M0= (xt, yt, xt+1, yt+1)=
D0t+1 (xt+1, yt+1)
D0t+1 (xt+1, yt+1) X
D0t (xt+1, yt+1)
D0t+1 (xt+1, yt+1)
[(
)
D0t (xt, y) 1/2
D0t+1 (xt, yt)
(
)]
193 Gadjah Mada International Journal of Business - May-August, Vol. 14, No. 2, 2012
where the notations D0 (xt+1, yt+1), represents
the distance from the period t+1 observation to the period t technology. The first ratio on the right hand side of the Equation 1 mea-sures the change in relative efficiency (i.e., the change in how far observed production is from the maximum potential production) between year t and t+1. The second term in-side the brackets (geometric mean of the two ratios) captures the shift in technology (i.e., movements of the frontier function itself) be-tween the two periods evaluated at xt and xt+1.
That is,
Essentially, the former investigates how well the production process converts inputs into outputs (catching up to the frontier) and the later reflects the improvement in tech-nology. According to Fare et al. (1994), im-provements in productivity yield Malmquist index values greater than unity. Deterioration in performance over time is associated with a Malmquist index less than unity. The same interpretation applies to the values taken by the components of the overall Total Factor Production Index (TFPI). An improvement in the efficiency component yield index val-ues greater than one and is considered to be evidence of catching up (to the frontier). Values of the technical change component
greater than one are considered to be evi-dence of technological progress.
In empirical applications, the distance measures that appear in Equation 1 are cal-culated for each operator in each pair of ad-jacent time periods using the mathematical programming technique. We assume that there are k = 1,…, K firms that produce m = 1,…, M outputs yt
k, m using n = 1,…, N inputs xt
k, n at each time period t = 1, …, T. Under
DEA, the reference technology with constant returns to scale (CRS) at each time period t from the data can be defined as
where zt
k refers to the weight on each
spe-cific cross-sectional observation. Following Afriat (1972), the assumption of constant returns to scale may be relaxed to allow vari-able returns to scales by adding the following restriction:
and CRS technology. The subset of pure ef-ficiency change measures the relative ability of operators to convert inputs into outputs while scale efficiency measures to what ex-tent the operators can take advantage of re-turns to scale by altering its size toward the optimal scale.
To construct the Malmquist productiv-ity index of firm k’ between t and t+1, the following four distance functions are calcu-lated using the DEA approach: Dt
0(xt,yt),
D0t+1(xt,yt),Dt
0(xt+1, yt+1), Dt0(xt+1, yt+1),
D0t+1(xt+1, yt+1). These distance functions are
the reciprocals of the output-based Farrell’s (1957) measure of technical efficiency. The non-parametric programming models used to calculate the output-based Farrell (1957) measure of technical efficiency for each firm k’ = 1,…, K, is expressed as:
Subject to:
The computation of D0t+1(xt+1, yt+1) is
similar to Equation 7, where t+1 is substi-tuted for t.
Construction of the Malmquist index also requires calculation of two mixed-dis-tance functions, which is computed by com-paring observations in one time period with the best practice frontier of another time
pe-riod. The inverse of the mixed-distance func-tion for observafunc-tion k’can be obtained from
Subject to:
To measure changes in scale efficiency, the inverse output distance functions under the VRS technology are also calculated by adding Equation 5 into the constraints in Equation 7 and 9. Technical change is calcu-lated relative to the CRS technology. Scale efficiency change in each time period is con-structed as the ratio of the distance function satisfying CRS to the distance function un-der VRS, while the pure efficiency change is defined as the ratio of the own-period dis-tance functions in each period under VRS. With these two distance functions with re-spect to the VRS technology, the decompo-sition of Equation 1 becomes:
195 Gadjah Mada International Journal of Business - May-August, Vol. 14, No. 2, 2012
Where
Note that when the technology in fact exhibits CRS, the scale change factor equals to one and it is the same decomposition as Equation 1.
Generalized Least Squares (GLS)
In this study we used Generalized Least Squares (GLS) method (with fixed and ran-dom effects) to examine the influence of in-dependent variables on the efficiency mea-sure. This methodology has been proposed by Drom and Walker (1996). They used the pooled regression (panel data) model to analyse the influence of funds characteristic (i.e., asset size, expense ratios, portfolio turn-over, load/no load status, and primary goal for a fund) on annualized unadjusted and risk adjusted returns. Panel regression models are based on panel data. Panel data consists of observations on the same cross-sectional, or individual, units over several time periods (Gujarati 2003). Pooling or combining, we can write the function as:Yit=+lnX1it +2lnX2it +uit...(11)
where Y represents efficiency, is the inter-cept, u is the error term and X1 and X2 are the respective fund size and profitability, while
i stands for the i th cross sectional unit and t for the th time period.
Panel data are better suited to study the dynamics of change and panel data enable us to study more complicated behavioural models. Despite their substantial advantages, panel data suffers from several estimation and inference problem. Since such data involve both cross-section and time dimensions, problems that plague cross-sectional data (e.g., heteroscedasticity) and time series data (e.g., autocorrelation) need to be addressed. There are several estimation techniques to address one or more of these problems (Gujarati 2003). The two most prominent including: (i) the Fixed Effects Model (FEM); and (ii) the Random Effects Model (REM) or Error Components Model (ECM).
In the FEM, the intercept in the regres-sion model is allowed to differ among indi-viduals in recognition of the fact that each individual, or cross sectional, unit may have some special characteristics of its own. To see this, model (11) is rewritten as follows:
Yit=i +lnX1it +2lnX2it +uit...(12)
where we put the subscript i on the intercept term to suggest that the intercepts of the twenty-six funds may be different. Differences may be due to special features of each com-pany, such as managerial style or management philosophy.
To take into account the differing in-tercepts, one can use dummy variables. The FEM using dummy variables is known as the least-squares dummy variable (LSDV) model. The FEM is appropriate in situations where the individual specific intercept may be cor-related with one or more regressors. A disad-vantage of LSDV is that it consumes a lot of
degrees of freedom when the number of cross-sectional units, n, is very large, in which case we will have to introduce n dummies (but suppress the common intercept term).
An alternative to FEM is REM. In the ECM, it is assumed that the intercept of an individual unit is a random drawing from a much larger population with a constant mean value. The individual intercept is then ex-pressed as a deviation from this constant mean value. One advantage of the ECM over FEM is that it is economical in the degrees of freedom, as we do not have to estimate n cross-sectional intercepts. We need only to estimate the mean value of the intercept and its variance. The ECM is appropriate in situ-ations where the (random) intercept of each cross sectional unit is uncorrelated with the regressors.
The formula of the ECM is as Equa-tion 13.
Yit=+lnX1it +2lnX2it +it+uit
=+lnX1it +2lnX2it +wit...(13)
where wit = it+uit
The composite error term wit consists of two components, it , which is the cross sec-tion, or individual-specific, error component, and uit, which is the combined time series and cross-section error component.
The Hausman test is used to identify which model is better to adopt whether it is the FEM or ECM. The Hausman test tests the null hypothesis that the coefficients mated by the efficient random effects esti-mator are the same as the ones estimated by the consistent fixed effects estimator. If we have insignificant P-value, Probability Chi-squared larger than confidence levels then, it
is safe to use the random effects. If we get a significant P-value, however, we should use fixed effects.
Data
As in 2005, there were 329 licensed mutual funds established in Indonesia. They consist of 33 money market funds, 170 fixed income funds, 78 balanced funds and 30 eq-uity funds (Bapepam-Lk 2006). However, in this study, we choose 14 fixed income, 9 bal-anced funds and 3 equity funds as the sample. Thus, the total of sample in this study is only 26 Indonesian mutual funds including 3 Is-lamic funds. The main reason for considering only 26 funds in this study is due to the avail-ability of complete information on these funds. Since the DEA is suitable to be used for a small sample size, it is not vulnerable to the disproportion of small sample error as in the econometric model (Dogan and Fausten 2003). This provides more motivation for the study to adopt this model in assessing the performance of 26 mutual funds in Indone-sia, i.e., AAA Bond Fund, Batasa Syariah, Bhakti Big Nusantara, Bhakti Big Palapa, Big Dana Likuid, BNI Berkembang ,BNI Dana Berbunga Dua, BNI Dana Plus, Dana Tetap Optima, Danareksa Anggrek, Danareksa Mawar, Danareksa Syariah Berimbang, Mahanusa Dana Kapital, Mahanusa Obligasi Pemerintah, Mahanusa PDPTAN Tetap Negara, Mandiri Dana Pendapatan Tetap, Manulife Dana Campuran, Manulife Pendapatan Bulanan, Manulife Phinisi Dana Saham, Mega Dana Kombinasi, Mega Dana Obligasi Medali, Nikko Bond Nusantara, Nikko Bunga Nusantara, Nikko Gebyar In-donesia, PNM Syariah, and Si Dana Fleksi.
197 Gadjah Mada International Journal of Business - May-August, Vol. 14, No. 2, 2012
inputs and output are mainly gathered from the Bloomberg Database between 2004 and 2007 period, while the funds characteristics, i.e., fund size and profitability are taken from Bapepam’s website between 2005 and 2006 period.
There is no consensus among research-ers and investors as to which input and out-put variables should be included in a DEA
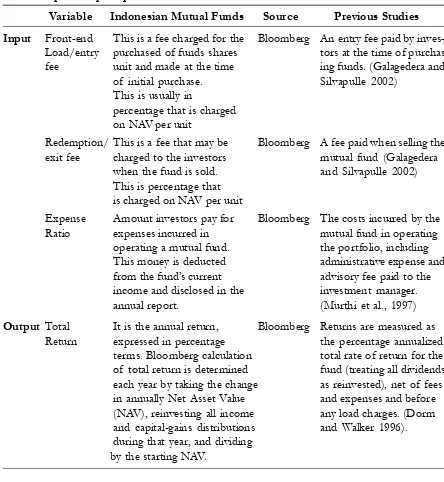
model unambiguously. We define our variable selection based on historical evidence, sub-jective judgment and data availability. Based on theories and empirical studies, we can identify many variables that are used as in-puts such as expense ratio, front-end loads, redemption fee and turnover, and most re-searchers used total return as output (Ippolito 1989).
Table 4. Input-Output Specifications
Variable Indonesian Mutual Funds Source Previous Studies Input Front-end This is a fee charged for the Bloomberg An entry fee paid by
inves-Load/entry purchased of funds shares tors at the time of purchas fee unit and made at the time ing funds. (Galagedera and
of initial purchase. Silvapulle 2002) This is usually in
percentage that is charged on NAV per unit
Redemption/ This is a fee that may be Bloomberg A fee paid when selling the exit fee charged to the investors mutual fund (Galagedera
when the fund is sold. and Silvapulle 2002) This is percentage that
is charged on NAV per unit
Expense Amount investors pay for Bloomberg The costs incurred by the Ratio expenses incurred in mutual fund in operating
operating a mutual fund. the portfolio, including This money is deducted administrative expense and from the fund’s current advisory fee paid to the income and disclosed in the investment manager. annual report. (Murthi et al., 1997) Output Total It is the annual return, Bloomberg Returns are measured as
Return expressed in percentage the percentage annualized terms. Bloomberg calculation total rate of return for the of total return is determined fund (treating all dividends each year by taking the change as reinvested), net of fees in annually Net Asset Value and expenses and before (NAV), reinvesting all income any load charges. (Dorm and capital-gains distributions and Walker 1996). during that year, and dividing
Thus, the initial model of this study will employ some variables such as charge fees namely front-end loads and redemption fees, and management expense ratio as the input, while total return as the output. However, the turnover ratio is excluded due to its un-availability. Table 4 summarises the input-output used to examine the efficiency of mutual funds using DEA.
In the GLS estimation, this study em-ploys fund size and profitability as the inde-pendent variables and Total Factor Produc-tivity (TFP) as the dependent variable. With the exception of the dependent variable, all independent variables are taken in the natu-ral logarithm functions.
Empirical Results, Discussion,
and Implications
Descriptive Statistics
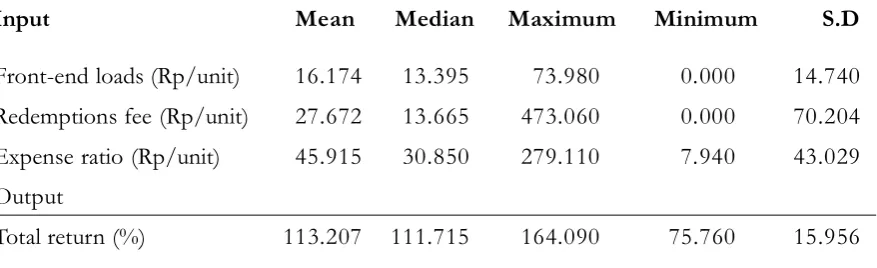
Table 5 shows the descriptive statistics of inputs and outputs of the 26 mutual funds industry across categories in Indonesia dur-ing the period of study. Si Dana Fleksi was found to have the highest amount of front-end loads within the period of study, while
Manulife Phnisi Dana Saham (equity), Manulife Dana Campuran (balanced funds) and Manulife Pendapatan Bulanan (debt) were recorded to have the lowest front-end loads to the investors. As for redemption fees, Mahanusa Phnisi Dana Saham seems to have the highest, while BNI Dana Berbunga Dua, BNI Dana Plus, BNI Berkembang and PNM Syariah have the lowest redemption fees, re-spectively.
In terms of expense ratio, AAA Bond Fund seems to have the lowest expense ratio to the investors, while Manulife Phnisi Dana Saham recorded the highest expense ratio. As for the output, Mahanusa Dana Kapital (bal-anced funds) has the highest output; return within the period of analysis, while Mandiri Pendapatan Tetap (debt) has the lowest re-turn compared to the others.5 On average, the
amount of front-end loads, redemptions fee and expense ratio were Rp16.17, Rp27.67 and Rp45.92, respectively. Meanwhile, the aver-age return was 113.21 percent.
The DEA’s Findings
In this section we will report the find-ings of production frontier and efficiency level of mutual funds, the productivity
per-Table 5. Descriptive Statistics of Inputs and Outputs, 2004-2007
Input Mean Median Maximum Minimum S.D
Front-end loads (Rp/unit) 16.174 13.395 73.980 0.000 14.740 Redemptions fee (Rp/unit) 27.672 13.665 473.060 0.000 70.204 Expense ratio (Rp/unit) 45.915 30.850 279.110 7.940 43.029 Output
Total return (%) 113.207 111.715 164.090 75.760 15.956
199 Gadjah Mada International Journal of Business - May-August, Vol. 14, No. 2, 2012
formance of individual mutual funds, and the productivity performance for the entire in-dustry.
Production Frontier and Efficiency As the Malmquist productivity index is directly related to measures of efficiency, the study reports first the efficiency changes for 26 mutual funds industry from 2004-2007. Table 4.2 shows the efficiency of the mutual funds industry across various categories un-der constant returns to scale (CRS) and vari-able returns to scale (VRS). The value of unity implies that the firm is on the industry frontier in the associated year. The value less than unity implies that the firm is below the frontier or technically inefficient. Hence, the lower the values from unity, the more ineffi-cient it is compared to the values closer to one.
Table 6 reports that the AAA Bond Fund, BNI Dana Berbunga, BNI Dana Plus and BNI Berkembang were consistently effi-cient, both under the CRS and VRS during the period of study. However, Manulife Phnisi Dana Saham, Manulife Dana Campuran, Manulife Pendapatan Bulanan and Nikko Gebyar Indonesia were only found to be con-sistently efficient under VRS. Manulife Phnisi Dana Saham was the least efficient fund for CRS, while Mega Dana Kombinasi was the least efficient under VRS. The estimates also showed that the AAA Bond Fund, BNI Dana Berbunga Dua, BNI Dana Plus, BNI
Berkembang, Manulife Pendapatan Bulanan and Nikko Gebyar Indonesia have success-fully kept pace with technically viable pro-duction possibilities and increased their dis-tance to the industrial production frontier for both CRS and VRS.
For Islamic mutual funds, PNM Syariah was the most efficient compared to other Is-lamic mutual funds under both CRS and VRS. Batasa Syariah was the least efficient under VRS, while Danareksa Syariah Berimbang was only slightly efficient for CRS. However, all selected Islamic mutual funds were more ef-ficient compared to their conventional coun-terparts such as Bhakti Big Nusantara, Big Dana Liquid, Dana Tetap Optima, Mandiri Dana Pendapatan Tetap, Mega Dana Kombinasi, Mega Dana Obligasi and Si Dana Fleksi under VRS, while for CRS, only PNM Syariah was found to be more efficient as compared to the average efficiency of the mutual funds industry in Indonesia.
Abd
. M
ajid
and
M
No Funds Name 2004 2005 2006 2007 Mean
CRS VRS CRS VRS CRS VRS CRS VRS CRS VRS
1 AAA Bond Fund 1.000 1.000 1.000 1.000 1.000 1.000 1.000 1.000 1.000 1.000
2 Batasa Syariah 0.721 0.886 0.730 1.000 0.572 0.809 0.628 0.932 0.663 0.907
3 Bhakti Big Nusantara 0.566 0.766 0.641 0.838 0.657 0.671 0.945 1.000 0.702 0.819
4 Bhakti Big Palapa 0.665 0.893 0.648 0.894 0.595 0.925 0.572 0.961 0.620 0.918
5 Big Dana Liquid 0.468 0.873 0.462 0.805 0.442 0.852 0.486 0.952 0.465 0.871
6 BNI Berkembang 1.000 1.000 1.000 1.000 1.000 1.000 1.000 1.000 1.000 1.000
7 BNI Dana Berbunga Dua 1.000 1.000 1.000 1.000 1.000 1.000 1.000 1.000 1.000 1.000
8 BNI Dana Plus 1.000 1.000 1.000 1.000 1.000 1.000 1.000 1.000 1.000 1.000
9 Dana Tetap Optima 0.526 0.886 0.523 0.889 0.463 0.843 0.511 0.943 0.506 0.890
10 Danareksa Anggrek 0.648 0.956 0.554 0.987 0.422 1.000 0.357 0.863 0.495 0.952
11 Danareksa Mawar 0.636 1.000 0.497 1.000 0.365 1.000 0.301 0.864 0.450 0.966
12 Danareksa Syariah Berimbang 0.502 0.866 0.463 0.962 0.356 0.969 0.317 0.872 0.410 0.917
13 Mahanusa Danakapital 0.398 1.000 0.272 1.000 0.196 0.863 0.188 0.828 0.264 0.923
14 Mahanusa Obligasi Pemerintah 0.805 0.982 0.799 0.979 0.729 0.901 0.802 1.000 0.784 0.966
15 Mahanusa PDPTAN Tetap Neg. 0.666 0.950 0.651 0.972 0.548 0.930 0.563 0.972 0.607 0.956
16 Mandiri Dana Pendapatan Tetap 0.457 0.848 0.450 0.700 0.504 0.897 0.532 0.948 0.486 0.848
17 Manulife Dana Campuran 0.706 1.000 0.565 1.000 0.434 1.000 0.381 1.000 0.522 1.000
18 Manulife Pendapatan Bulanan 0.958 1.000 0.977 1.000 1.000 1.000 1.000 1.000 0.984 1.000
20
1
Gad
jah M
ada
Inte
rnati
ona
l Jou
rnal
of B
usin
ess
- M
ay-A
ugust,
Vol.
14, N
o. 2, 2
012
No Funds Name 2004 2005 2006 2007 Mean
CRS VRS CRS VRS CRS VRS CRS VRS CRS VRS
21 Mega Dana Obligasi Medali 0.443 0.883 0.427 0.810 0.406 0.839 0.455 0.934 0.433 0.867
22 Nikko Bond Nusantara 0.862 0.997 0.840 1.000 0.685 0.867 0.752 0.984 0.785 0.962
23 Nikko Bunga Nusantara 0.607 0.938 0.587 0.974 0.506 0.849 0.545 0.951 0.561 0.928
24 Nikko Gebyar Indonesia 1.000 1.000 1.000 1.000 0.982 1.000 1.000 1.000 0.996 1.000
25 PNM Syariah 0.851 0.996 0.809 1.000 0.665 0.941 0.650 0.970 0.744 0.977
26 Si Dana Fleksi 0.252 0.806 0.213 0.963 0.159 0.829 0.159 0.843 0.196 0.860
Mean – Shari’ah Funds 0.675 0.914 0.649 0.987 0.514 0.904 0.506 0.924 0.587 0.933
Mean – Conventional Funds 0.598 0.933 0.559 0.933 0.501 0.906 0.510 0.957 0.547 0.934
Total Mean 0.662 0.934 0.635 0.944 0.579 0.911 0.598 0.954 0.619 0.936
Note: The firms which are written in bold are the Islamic mutual funds.
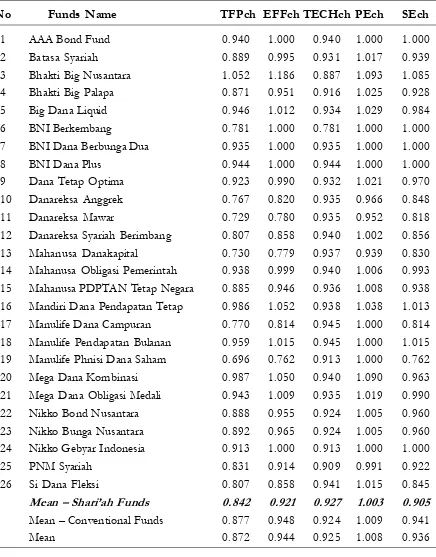
Table 7. Summary of Means’ Malmquist Productivity Index, 2004-2007
No Funds Name TFPch EFFch TECHch PEch SEch
1 AAA Bond Fund 0.940 1.000 0.940 1.000 1.000
2 Batasa Syariah 0.889 0.995 0.931 1.017 0.939
3 Bhakti Big Nusantara 1.052 1.186 0.887 1.093 1.085 4 Bhakti Big Palapa 0.871 0.951 0.916 1.025 0.928
5 Big Dana Liquid 0.946 1.012 0.934 1.029 0.984
6 BNI Berkembang 0.781 1.000 0.781 1.000 1.000
7 BNI Dana Berbunga Dua 0.935 1.000 0.935 1.000 1.000
8 BNI Dana Plus 0.944 1.000 0.944 1.000 1.000
9 Dana Tetap Optima 0.923 0.990 0.932 1.021 0.970
10 Danareksa Anggrek 0.767 0.820 0.935 0.966 0.848
11 Danareksa Mawar 0.729 0.780 0.935 0.952 0.818
12 Danareksa Syariah Berimbang 0.807 0.858 0.940 1.002 0.856 13 Mahanusa Danakapital 0.730 0.779 0.937 0.939 0.830 14 Mahanusa Obligasi Pemerintah 0.938 0.999 0.940 1.006 0.993 15 Mahanusa PDPTAN Tetap Negara 0.885 0.946 0.936 1.008 0.938 16 Mandiri Dana Pendapatan Tetap 0.986 1.052 0.938 1.038 1.013 17 Manulife Dana Campuran 0.770 0.814 0.945 1.000 0.814 18 Manulife Pendapatan Bulanan 0.959 1.015 0.945 1.000 1.015 19 Manulife Phnisi Dana Saham 0.696 0.762 0.913 1.000 0.762 20 Mega Dana Kombinasi 0.987 1.050 0.940 1.090 0.963 21 Mega Dana Obligasi Medali 0.943 1.009 0.935 1.019 0.990 22 Nikko Bond Nusantara 0.888 0.955 0.924 1.005 0.960 23 Nikko Bunga Nusantara 0.892 0.965 0.924 1.005 0.960 24 Nikko Gebyar Indonesia 0.913 1.000 0.913 1.000 1.000
25 PNM Syariah 0.831 0.914 0.909 0.991 0.922
26 Si Dana Fleksi 0.807 0.858 0.941 1.015 0.845
Mean – Shari’ah Funds 0.842 0.921 0.927 1.003 0.905
Mean – Conventional Funds 0.877 0.948 0.924 1.009 0.941
Mean 0.872 0.944 0.925 1.008 0.936
Note: See Table 6
203 Gadjah Mada International Journal of Business - May-August, Vol. 14, No. 2, 2012
As presented by the weighted geomet-ric in Table 6, the average efficiency for the entire industry decreased from 2004 to 2006 before it slightly increased in 2007 under the CRS version. Meanwhile, under VRS, the geo-metric mean showed a slight increase from 93.4 percent in 2004 to 94.4 percent in 2005. However, it declined in 2006 before increased again to 95.4 percent in 2007. Increasing ef-ficiency in 2005 may be driven by increasing mutual funds’ Net Asset Value (NAV) up to February 2005 and reached a high of Rp113.6 trillion. However, in March 2005, the indus-try was thrown into turmoil since the Central Bank Rate (or in Indonesian acronym known as SBI – Sertifikat Bank Indonesia), which is widely used as the benchmark in the market, rose to a higher-than-expected inflation, which weakened of the rupiah, and rising fuel prices.
Higher interest rates depressed the price of bonds, which translated into a lowered NAV. In other words, many investors would be worried so that may cause massive redemp-tions from rupiah fixed income funds that causes a significant reduction in total NAV. Redemptions finally peaked in September 2005 when the net asset value dropped from Rp113.6 trillion in February to Rp32.9 tril-lion and in December, it reached a low of Rp29.4 trillion. Moreover, in January 2006 it slightly declined to Rp28.5 trillion before it increased at the end of 2006 to Rp. 51.62 trillion. This is due partly to the government policy to decrease the interest rate of SBI in order to motivate the investors to move their funds to mutual funds. Besides that, the sub-stantial growth in the mutual fund industry was mainly caused by the good climate on the Indonesian macro-economy conditions during 2006 and it continued in 2007.
Productivity for the Entire Industry Table 7 shows the performance of the Malmquist TFPI of Indonesia’s mutual fund industry between 2004 and 2007. On the average, Bakti Big Nusantara recorded the highest growth in TFPI with 5.2 percent. Next, the efficiency and technical changes for this fund were 18.6 and -11.3 percent, respec-tively. However, Manulife Phnisi Dana Saham had the lowest TFPI with -30.4 per-cent, which was mostly contributed to by ef-ficiency regress (-23.8 percent). On the aver-age, deterioration of the TFPI of mutual funds industry in Indonesia was mostly due to technical change (-7.5 percent) whereas efficiency also contributed to a negative change (-5.6 percent). Meanwhile, the effi-ciency change was mostly contributed to by pure efficiency (0.8 percent) rather than scale efficiency which experienced a deterioration of -6.4 percent. This shows that the larger the size of the funds, the lower their efficiency changes.
as compared to their conventional counter-parts.
The GLS Findings
In order to examine the influence of the funds’ characteristics on the TFPI and its components, the GLS regression analysis was conducted on the panel data based on the Fixed Effects Model (FEM) and Random Effects Model (REM). As discussed in the previous chapter, the estimation technique with fixed effects assumes that there are two residuals or error terms. First are time effects, which are assumed to be constant for each fund in each period. The second are
indi-vidual effects which are assumed to be con-stant for each fund company in each period. The fixed effects take into account the indi-viduality for each fund industry (cross sec-tional) and produce the various intercepts but still assume that the slope coefficients are constant across the funds industry. In other words, the intercept value in the regression model is allowed to differ within the funds industry. Meanwhile, the estimation tech-nique with random effect assumes that the intercept of an individual unit is a random drawing from a much larger population with a constant average value. Error component,
it. represents the gap of intercept of an
indi-vidual unit from the average value.
In empirically exploring the effects of funds characteristics on the performance of mutual funds industry in Indonesia, the study examines the effects of funds characteristics on mutual funds’ Total Factor Productivity Index (TFPI).
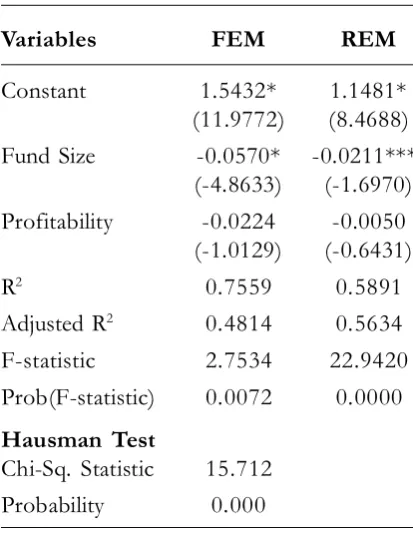
Table 8 exhibits the result of GLS when the TFP is regressed against the firm’s spe-cific characteristic based on both FEM and REM. Under the FEM, the adjusted-R2 value
shows that 48.1 percent of the variation in the TFP is explained by a set of independent variables. It is found that the fund size nega-tively and significantly affects TFP, while profitability is found to be insignificant in affecting the TFP. In terms of REM, the ad-justed R2 values shows 56.3 percent. It was
found that the coefficient sign for the fund size is negative and significant, while profit-ability is insignificant in affecting TFP.
Meanwhile, the Hausman statistics are used to know the best estimation model be-tween the fixed and random effects. The ran-dom effects model assumes that the ranran-dom effects are uncorrelated with the explanatory variables; otherwise there would be an Table 8.GLS Estimation Results with
FEMand REM (Dependent Vari-able: TFPI)
Variables FEM REM
Constant 1.5432* 1.1481* (11.9772) (8.4688) Fund Size -0.0570* -0.0211***
(-4.8633) (-1.6970) Profitability -0.0224 -0.0050
(-1.0129) (-0.6431)
R2 0.7559 0.5891
Adjusted R2 0.4814 0.5634
F-statistic 2.7534 22.9420 Prob(F-statistic) 0.0072 0.0000 Hausman Test
Chi-Sq. Statistic 15.712 Probability 0.000
Note: Figures in parentheses denote t-statistic
val-ues of the regressions coefficients;
205 Gadjah Mada International Journal of Business - May-August, Vol. 14, No. 2, 2012
endogeneity problem, which in turn would make the estimators inconsistent. The Hausman Test for Correlated Random Ef-fects tests this hypothesis. As described in the previous chapter, if we get an insignificant P-value or Probability Chi-Sq. larger than confidence levels, then it is safe to use ran-dom effects. If we get a significant P-value, however, we should use fixed effects. Based on the test output given in table above, the test suggests to reject the null hypothesis since the Probability Chi-Sq. is less than 0.01. This provides evidence that the assumption that the random effects should be uncorrelated to the explanatory variables is not true for this dataset. Therefore, the estimation results with fixed effects are better than random effects.
Conclusion
The first study objective is to assess the relative efficiency of the mutual fund com-panies in Indonesia. On average, the Total Factor Productivity (TFP) had decreased 12.8 percent within the period of 2004-2007 with 2006-2007 recording the lowest growth (-19.7 percent). However, the highest technical ef-ficiency was recorded in the period of 2005-2006 at the rate of 11.4 percent, while 1.4 percent was recorded in the period of 2006-2007. It is necessary to note that the exist-ence of a negative growth in TFP of the mutual funds industry in Indonesia has been mainly caused by a negative change in ciency (-5.6 percent), while technical effi-ciency also contributed to a greater negative change (-7.5 percent) to the overall decrease in the TFP growth.
The results indicate that the mutual funds industry experienced diminished pro-ductivity and became more technically inef-ficient from 2004 to 2007. The study con-cluded that much of the inefficiency increased
overtime which was due to the failure of the mutual funds to adopt technological advances made by a few efficient mutual funds. Al-though the efficiency change experienced a negative growth, the subcomponent of this change, namely pure efficiency, showed a slight improvement (0.8 percent). Thus, the finding indicates that the smaller the size of the companies, the larger the probability for the companies to be more efficient in using their inputs to generate more outputs.
Compared to the conventional mutual funds, the average TFP, efficiency and scale efficiency growth of the three Islamic mu-tual funds, Batasa Syariah, Danareksa Syariah Berimbang and PNM Syariah, were found to be lower than the conventional funds, with the exception of Batasa Syariah. However, in technical efficiency, the average growth of Batasa Syariah and Danareksa Syariah Berimbang was found to be higher than their conventional counterparts. Meanwhile, PNM Syariah recorded the lowest growth in tech-nical efficiency (-9.1 percent). Finally, in the case of pure efficiency, Danareksa Syariah Berimbang and PNM Syariah were below average, while Batasa Syariah was above av-erage in mutual fund industry in Indonesia. Therefore, improving mutual funds TFP, tech-nical efficiency, efficiency and scale efficiency changes are the best ways for Islamic mutual funds in order to be in a better position and to gain a competitive edge over the conven-tional mutual funds. Addiconven-tionally, the effi-ciency change was mainly contributed to by the pure efficiency (0.8 percent) rather than the scale efficiency (-6.4 percent). This indi-cates that the smaller the size of the fund, the higher their efficiency change.
that small funds may have higher perfor-mance and become more efficient. Profit-ability was insignificantly associated to TFPI. In general, the TFPI experienced a nega-tive growth (-12.8 percent) during the period of study 2004-2007. This indicates that the averages of selected mutual fund companies in Indonesia are efficient in using their inputs to generate more outputs. This is not surpris-ing since some mutual fund companies have experienced a crisis of massive redemption particularly at the end of 2005 which the In-donesian macro-economy condition was rela-tively unstable and had caused an increase in the interest rate (about 12.75%) as a conse-quence of a rise in world fuel price and higher inflation. Therefore, the instability during the financial crisis is still fresh in the minds of many investors. An important program for the near term should be to develop a base of in-dividual investors. Moreover, the inefficiency of funds was also mainly caused by the fail-ure of mutual funds to adopt technological advances. This study suggests that the mu-tual funds industry in Indonesia has a great opportunity to promote its TFP through an improvement in the technical element such as optimizing the use of information tech-nology in providing good services to custom-ers (investors).
Generally, the average productivity of the Islamic mutual funds (i.e., Danareksa Syariah Berimbang and PNM Syariah) is rela-tively below average of their conventional funds. However, in order to sustain in the
long-term, the Islamic mutual funds has to be internally efficient and technologically advanced in order to compete with its con-ventional counterparts. Therefore, training and technical expertise should be constantly upgraded along with technological evolution. This can be done through education and train-ing programs intended to improve manage-rial ability, or extension programs designed to speed up the adoption of new technolo-gies.
Meanwhile, small funds appeared to be more efficient than larger funds. The study suggests that market competition motivates more disciplinary effects on small funds. Fi-nally, profitability insignificantly affects TFPI, suggesting that profitability has no effect on the funds’ performance.
207 Gadjah Mada International Journal of Business - May-August, Vol. 14, No. 2, 2012
References
Abd. Majid, M. S., and H. Maulana. 2010. Assessing performance of mutual funds in Indonesia. Journal of Economic Cooperation and Development 31 (4): 49-76.
Abdullah, F., T. Hasan, and S. Mohamad. 2007. Investigation of performance of Malaysian Islamic unit trust funds: Comparison with conventional unit trust funds. Managerial Finance 33: 142-153. Alam, I., and R. Sickles. 1995. Long run properties of technical efficiency in the U.S. airline industry. Mimeo.
Rice University.
Annuar, M. N., M. Shamsher, and M. H. Ngu. 1997. Selectivity and timing: Evidence from the perfor-mance of Malaysian unit trusts. Pertanika Journal of Social Science and Humanities 5: 45-57.
Asai, S., and J. Nemoto. 199. Measurement of efficiency and productivity in regional telecommunications business. Institute for Post and Telecommunication Policy Discussion Paper 3 (June 25).
Banker, R. D., A. Charnes and W. W. Cooper. 1984. Some models for estimating technical and scale efficiencies in data envelopment analysis. Management Science 30: 1078-1092.
Basso, A., and S. Funari. 2001. Theory and methodology: A data envelopment analysis approach to measure the mutual fund performance. European Journal of Operational Research 135: 477-492. Berger, A. N., and D. B. Humprey. 1997. Efficiency of financial institution: international survey and
direction for future research. European Journal of Operation Research 98: 175-212.
Charnes, A., W. W. Charnes, and E. Rhodes. 1978. Measuring the efficiency of decision making units.
European Journal of Operational Research 3: 429-444.
Chen, Z., and R. Lin. 2006. Mutual fund performance evaluation using data envelopment analysis with new risk measures. OR Spectrum 28: 375-398.
Coelli, T. J. 1996. A guide to DEAP version 2.1: A data envelopment analysis (Computer) Program.
Working Paper 8 (96). Centre for Efficiency and Productivity Analysis (CEPA). University of New England.
Dogan, E., and D. K. Fausten. 2003. Productivity and technical change in Malaysian banking (1989-1998).
Asia-Pacific Financial Markets 10: 205-237.
Fare, R., and C. A. K. Lovell. 1978. Measuring the technical efficiency of production. Journal of Economic Theory 19: 150-162.
Fare, R., G. Shawna, L. Bjorn, and L. Ross. 1989. Productivity development in swedish hospitals: A Malmquist output index approach. Mimeo.
Fare, R., G. Shawna, N. Mary, and Z. Zhongyang. 1994. Productivity growth, technical progress and efficiency change in industrialized countries. American Economic Review 84: 66-83.
Farrell, M. 1957. The measurement of productive efficiency. Journal of the Royal Statistical Society 120: 253-281.
Ferdian, I. R., and M. K. Dewi. 2007. Performance analysis of Islamic mutual funds: A comparative study between Indonesia and Malaysia. Paperpresented atthe International Conference on Islamic Capital Markets
(August 27-29). Jakarta, Indonesia.
Ghoul, W., N. Azoury, and P. Karam. 2007. Islamic mutual funds: how do they compare with other religiously-based and ethically-based mutual funds?. Paper presented atthe IIUM International Conference on Islamic Banking and Finance (IICiBF) (23-25 April). IIUM Institute of Islamic Banking and Finance (IIiBF), Kuala Lumpur.
Gujarati, D. N. 2003. Basic Econometrics (4th ed.). New York: McGraw-Hill.
Hayat, R. 2006. An empirical assessment of Islamic equity fund returns. Master Thesis. Amsterdam: Free University.
Ippolito, R. A. 1989. Efficiency with costly information: A study of mutual fund performance (1965-1984). 1989. QuarterlyJournal of Economics 104: 1-23.
Jemric, I., and B. Vujcic. 2002. Efficiency of bank in Croatia: A DEA approach. Comparative Economic Studies 44: 169-193.
Jensen, M. C. 1968. The performance of the mutual funds in the period 1945-1964. Journal of Finance 23: 389-416.
Jensen, M. 1972. Optimal utilization of market forecasts and the evaluation of investment portfolio performance. In Szego and Shell (Ed), Mathematical Methods in Investmeritand Finance. North Hol-land, Amsterdam.
Maghyereh, A.2004. The effect of financial liberalization of the efficiency of financial institutions: The case of Jordanian commercial banks. Savings and Development 28: 235-270.
Murthi, B.P.S., Y. K. Choi, and P. Desai. 1997. Efficiency of mutual funds and portfolio performance measurement: A non-parametric approach. European Journal of Operational Research 98: 408-418. Md. Taib, F., and M. Isa. 2007. Malaysian unit trust aggregate performance. Managerial Finance 33:
102-121.
Neal, P. 2004. X-efficiency and productivity change in Australian banking. Australian Economic Papers 13: 174-191.
Sharpe, W. F. 1965. Mutual fund performance: Measurement and prediction. The RAND Corporation
(March). Santa Monica.
Sharpe, W. F. 1966. Mutual fund performance. Journal of Business 34: 119-138.
Seiford, L. M., and R. M. Thrall. 1990. Recent developments in DEA: the mathematical programming approach to frontier analysis. Journal of Econometrics 46: 7-38.
Sengupta, J. K. 2003. Efficiency test for mutual fund portfolios. Applied Financial Economics 13: 869-876. Supervisory Capital Market of Indonesia Agency (Bapepam: Badan Pengawas Pasar Modal). Annual
Report (Various Issues).
Supervisory Capital Market of Indonesia Agency. 2006-2009. Indonesian Capital MarketMaster Plan.