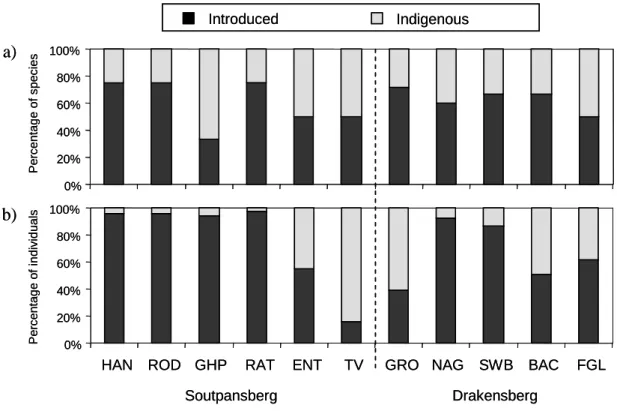
Page Figure 3.8: Percentage of earthworms introduced into forests for a) total number of earthworm species and b) total number of earthworm individuals. 106 Figure 4.2: Contribution of each sampled forest in Limpopo province to .. invertebrate diversity where a) is species composition and b) family composition.
BIODIVERSITY
- What is biodiversity?
- The three levels of biodiversity
- Estimating global species diversity
- Invertebrate abundance and diversity
- Benefits of biodiversity to humans
- Global species extinction
- Threats to global biodiversity
Invertebrates dominate all faunal groups in the world, both in terms of numbers of individuals and biomass (Black et al. 2001). The ultimate cause of all these threats to biodiversity is the continued exponential growth of the human population, which began in the last century.
FOREST BIODIVERSITY
Global forests & biodiversity
For example, the composition of life in the tropical forest canopy is quite different from that of the forest floor. According to Erwin (1988), most of the undescribed species of arthropods in the world will be found in tropical forest canopies.
Forest invertebrate abundance and diversity
Tropical forests contain more diversity than any other environment and most species are invertebrates. Not surprisingly, many forest invertebrate species are unknown to science, as few species of insects and other arthropods sampled in tropical forests can be found in existing collections or in the world literature (Raven 1988; Stork 1997).
Why study forest invertebrates?
According to Primack (2000), ecologists have recognized 14 specific categories of species that are particularly susceptible to extinction and must be carefully monitored and conserved. Because at least six of the 14 recognized categories concern many forest invertebrate groups, such species must be considered at high risk of extinction.
SOUTH AFRICAN FORESTS
Description of South African forests
Water availability limits the area of South African forests (von Maltitz et al. 2003) and forests are generally restricted to locations with mean annual rainfall greater than 525 millimeters in winter regions and greater than 725 millimeters in regions with. Disturbing factors, especially fire initiation, also have a major influence on forest distribution (Geldenhuys 1994; von Maltitz et al. 2003).
South African forest classification
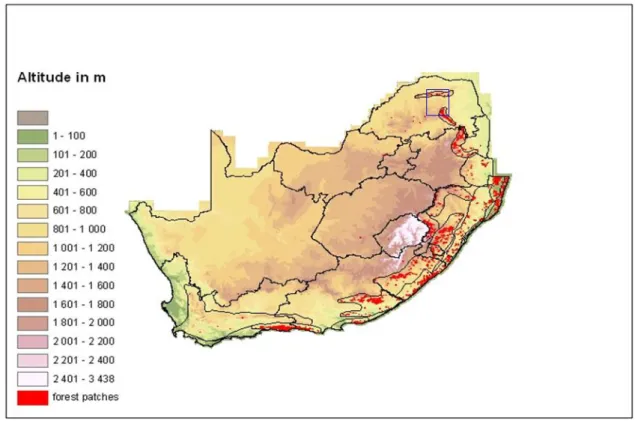
Elevation and temperature are not important influences on South African forest distribution, since forests occur from sea level to over 2100 metres in altitude (Rutherford & Westfall 1994; Low & Rebelo 1996) and from the snow and frost prone Drakensberg to the hot KwaZulu-Natal coastal plain (von Maltitz et al. 2003). Four of von Maltitz et al.’s (2003) major forest groups (comprising 12 forest types) can be broadly classified as South African Afromontane forests: (1) the Southern Afrotemperate Group, (2) the Northern Afrotemperate Group, (3) the Northern Mistbelt Group and (4) the Southern Mistbelt Group.
South African Afromontane forests
The lack of consensus between classification systems relates to finer subdivisions within Afromontane and coastal forest types (von Maltitz et al. 2003). Because of altitude, latitude and proximity to the coast, temperatures within Afromontane forests are generally low and consistent (von Maltitz et al. 2003).
PURPOSE AND OBJECTIVES
Recruitment, growth and mortality, native and invasive species dynamics, and nutrient cycling have been investigated in South African forests (C. J. Geldenhuys 2003, pers. comm.), but these studies all focused on forest flora. Factors influencing the richness of target invertebrates in the forests of Limpopo province are assessed and introduced invertebrate species are also discussed.
INTRODUCTION
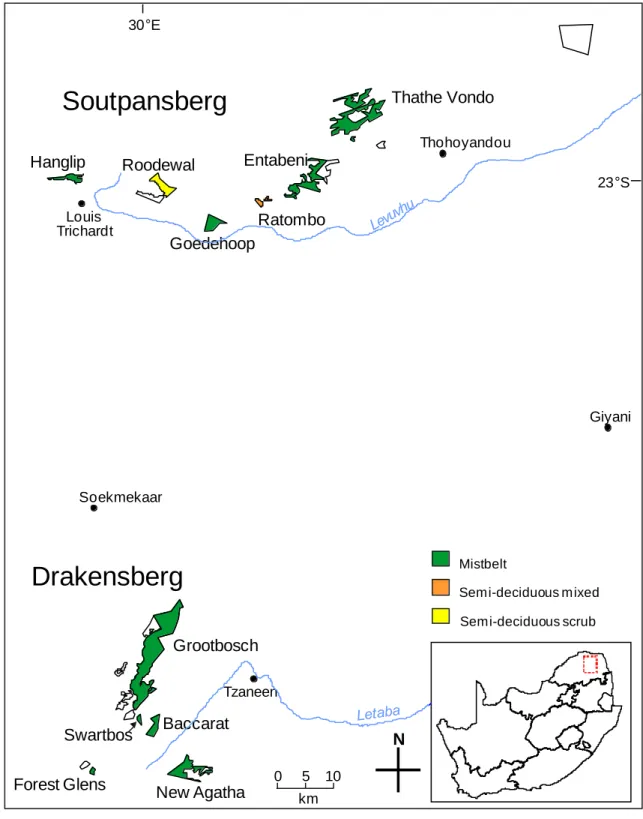
- Northern Mistbelt Forests of Limpopo Province
- Species vs. morphospecies in biodiversity studies
- Focal groups vs. target groups
- Invertebrate collection techniques
As a result, studies of invertebrate biodiversity often focus on a single "core group," a subdivision of a larger group of interest. Success is largely dependent on the vigilance of the forager and yields can be low, especially for widely distributed species (New 1998).
STUDY SITES
No single method samples all habitats equally and most capture only a limited component of the target species present (Hammond 1995). Because commercial farms, managed plantations or communal lands surround most of the forests sampled, they were mainly conserved to protect natural ecosystems and water catchments.
STUDY TAXA
- Millipedes (Class: Diplopoda)
- Centipedes (Class: Chilopoda)
- Scorpions (Order: Scorpionida)
- Web building and ground wandering spiders (Order: Araneae)
- Terrestrial molluscs (Class: Gastropoda)
- Earthworms (Class: Oligochaeta)
- Terrestrial amphipods (Family: Talitridae)
- Additional taxa
They are nocturnal, secretive invertebrates that spend most of the daylight hours under logs and stones (Miller & Harley 1992). They are the most famous and well-known of all chelicerates, being one of the most common groups of terrestrial animals (Cloudsley-Thompson 1968; Brusca & Brusca 1990) and frequently coming into contact with humans (Leroy & Leroy 2000).
METHODS
- Quadrat sampling
- Line transect sampling
- Pitfall trap sampling
- Other sampling techniques
- Specimen identification
Five quadrats were completed in each of the 11 forests, for a total of 55 quadrats for the study. Five line transects were completed in each of the 11 forests, for a total of 55 line transects for the study.
INTRODUCTION
Biodiversity surrogates
However, knowing the species diversity of a single area, group or time is essentially useless unless it can be compared with other areas, groups or times (Purvis & Hector 2000). In this chapter, I use measures of species richness, diversity, and target evenness as surrogates for total invertebrate diversity in Limpopo Province forests, recognizing that higher mobility invertebrate taxa were not sampled and that they may exhibit different diversity patterns (see section 5.4). .1).
Measuring alpha diversity
In contrast, the modified Hill ratio (E5) is not affected by sample size or species richness (Ludwig & Reynolds 1988). For these reasons, richness and evenness are often presented as separate values alongside diversity indices.
Introduced species
Because of the uncertainties and limitations associated with all measures of species diversity (Ludwig & Reynolds 1988), richness, evenness and diversity indices were all calculated and expressed separately in this study. In this chapter I describe the composition and abundance of invertebrate species in Limpopo Province forests.
METHODS
- Calculations of richness, diversity and evenness
- Comparisons of richness, diversity and evenness
- Absolute species richness, diversity and evenness
- Descriptive models - multiple regression analysis
- Introduced species
One way ANOVAs were used to test for significant differences between regional, forest and target group richness, diversity and evenness. The LSD post hoc test was used to identify significant differences between individual forests and target groups within each forest.
RESULTS
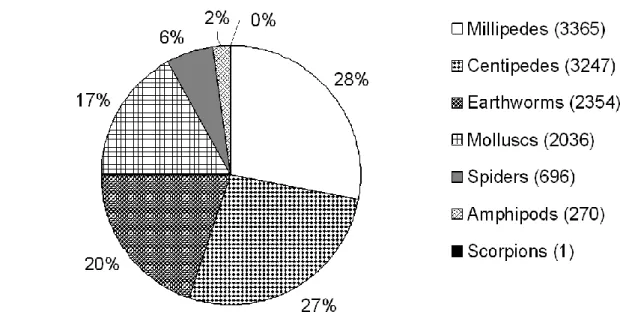
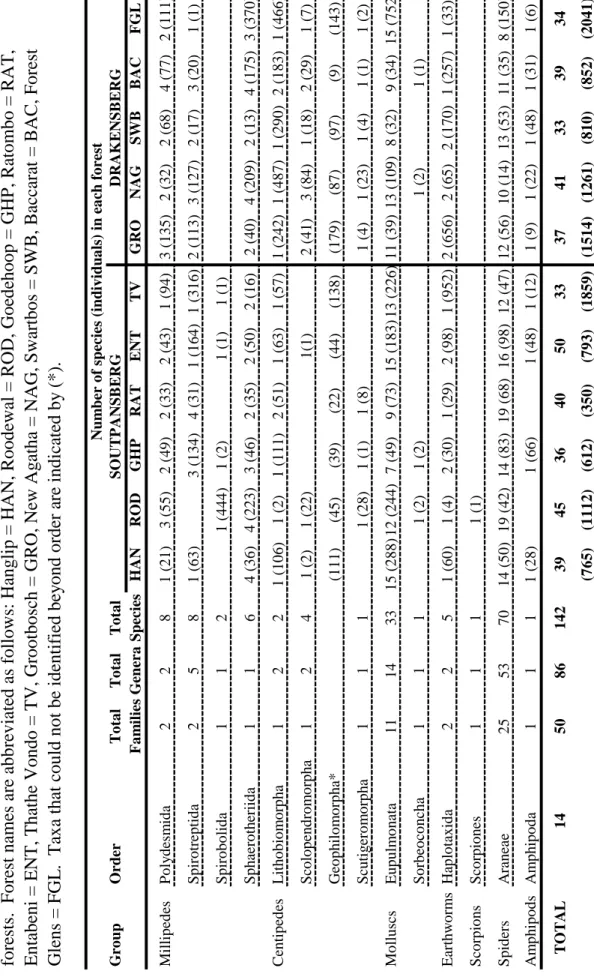
- Total numbers of species and individuals
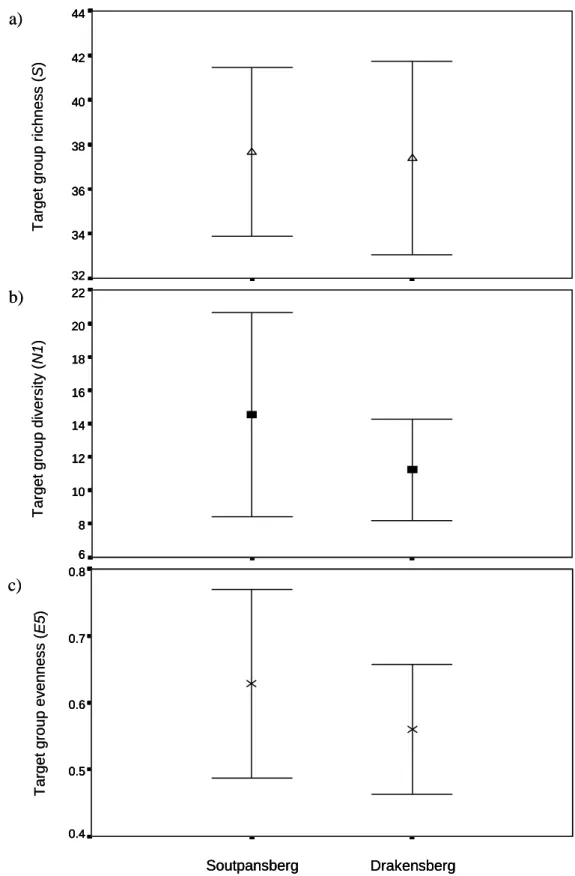
- Regional comparisons of richness, diversity and evenness
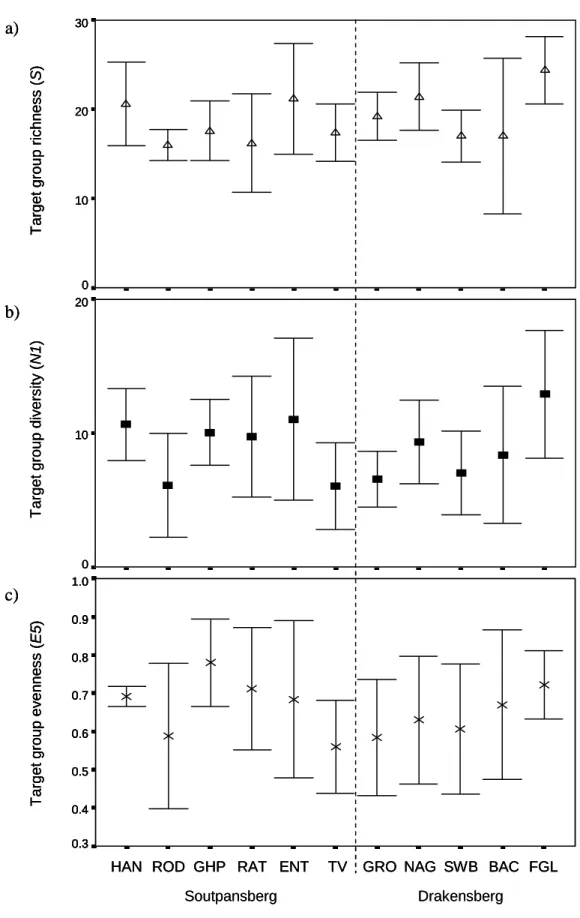
- Comparisons of forest richness, diversity and evenness
- Comparisons of target group richness, diversity and evenness
- Absolute species richness, diversity and evenness
- Descriptive models - multiple regression analysis
- Introduced species
Post hoc testing revealed the importance of differences in target richness, diversity and evenness between individual forests. Multiple regression was used to determine the biotic and abiotic variables that influenced target species richness in the forests of Limpopo Province.
DISCUSSION
- Species composition
- Regional richness, diversity and evenness
- Forest richness, diversity and evenness
- Target group richness, diversity and evenness
- Introduced species
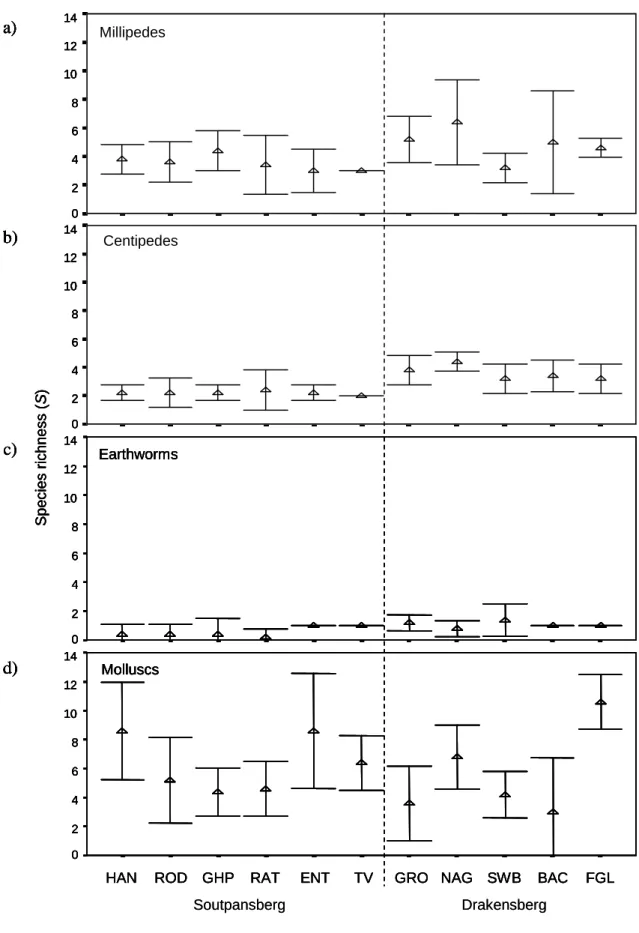
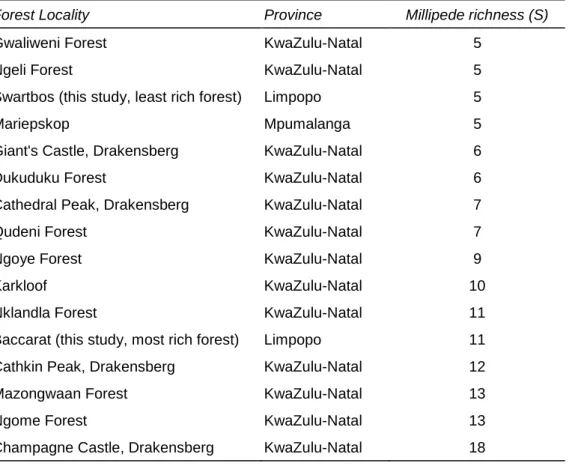
Druce (2000) recorded three centipede species in the savannah habitat of the Greater Makalali Conservancy, Limpopo Province. In the current study, up to five millipede species were recorded in a single forest area in Limpopo Province (Table 3.7) and a total of seven millipede species were sampled during this study.
CONCLUSION
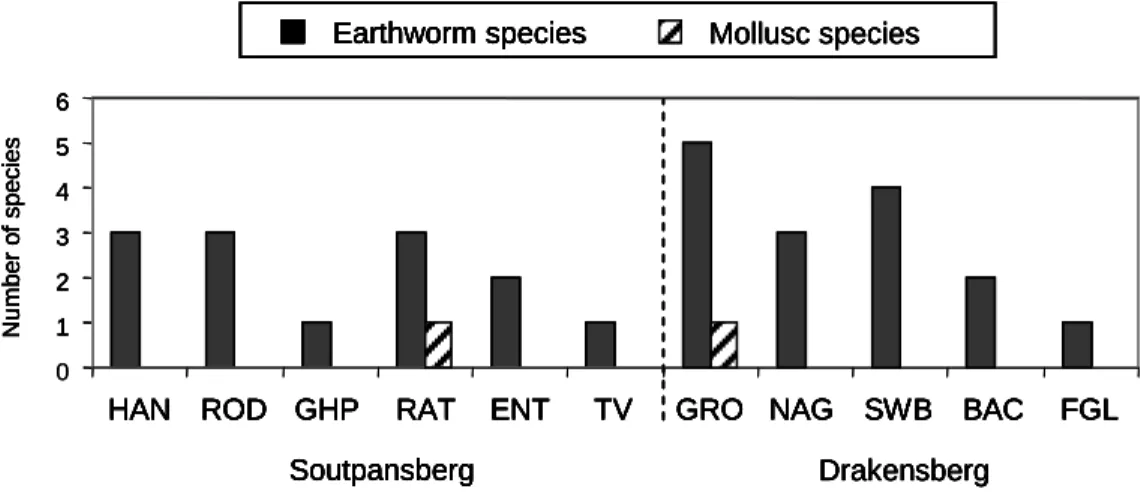
This appears to be the case in the current study, where introduced earthworms accounted for most of the earthworm species sampled (Figure 3.8). In the South African context, the invertebrate richness of Limpopo Province forests is high, especially when considering that many of the figures presented are probably underestimated.
INTRODUCTION
Measuring beta diversity
The beta diversity of site pairs is most easily measured using coefficients of similarity, such as the Jaccard index and the Sorensen index (Southwood 1978; Magurran 1988). Another method of beta diversity investigation is cluster analysis, which can be used when there are a number of sites to be compared.
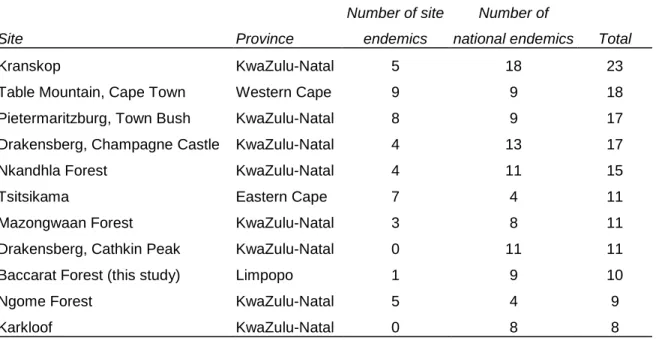
Species endemism
Endemism can be expressed as a percentage of all taxa present or as the absolute number of endemics in an area (Hawksworth & Kalin-Arroyo 1995). In this chapter I examine invertebrate species endemism in Limpopo Province forests at four levels and characterize the amounts of endemism in the two regions, the three vegetation subtypes and the eleven individual forests.
Limpopo Province forest history in brief
Climate change during this time probably reduced forests in South Africa to a highly compacted Afrotemperate forest archipelago south of Limpopo Province (Lawes 1990, Eeley et al. 1999). Afromontane forests in South Africa likely expanded in response to a more favorable climate (Meadows & Linder 1989; Lawes 1990, Eeley et al. 1999).
METHODS
- Site similarity
- Cluster analysis
- Species endemism analysis
- Comparison with Zimbabwean and KwaZulu-Natal forests
Karkloof was chosen because it has the highest number of records and is the best sampled forest in KwaZulu-Natal. Additional KwaZulu-Natal forests were not considered because the list of species would be excessively long and would confuse comparisons.
RESULTS
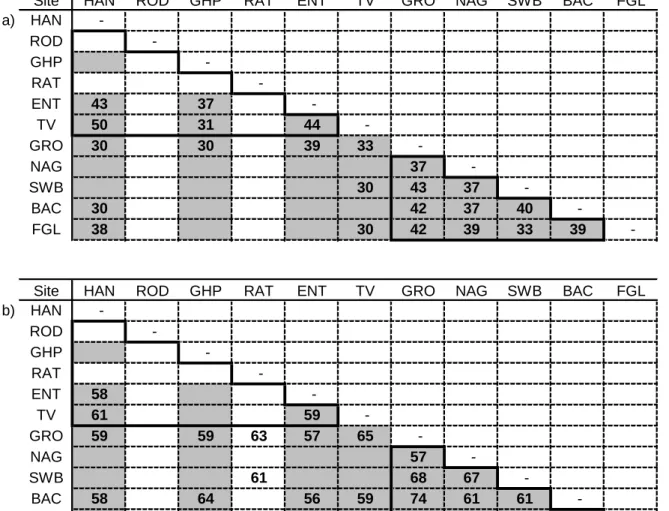
Site similarity
However, family composition did not reflect these trends and Baccarat was most similar to Soutpansberg at the family level while Swartbos, Baccarat's nearest neighbour, was least similar (Figure 4.3a). At the species level, Roodewal was least similar to the Drakensberg and Ratombo was least similar at the family level (Figure 4.3b).
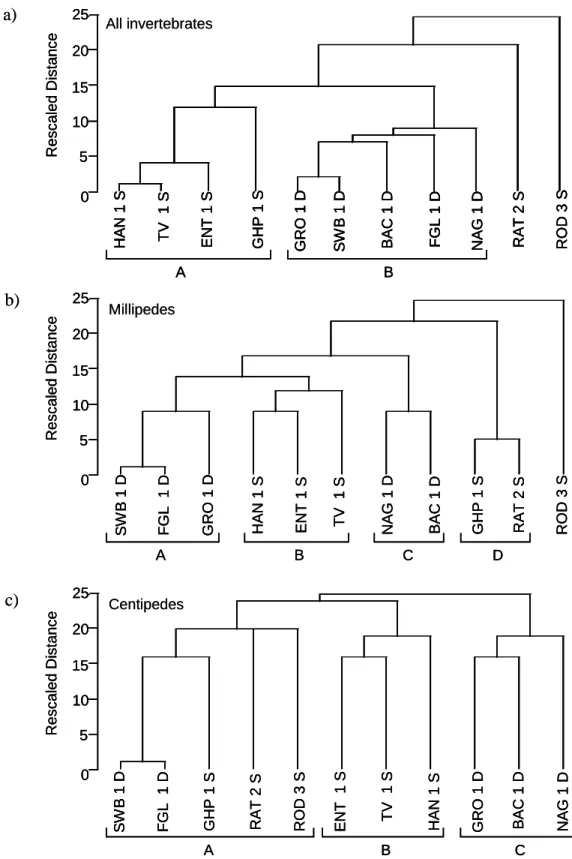
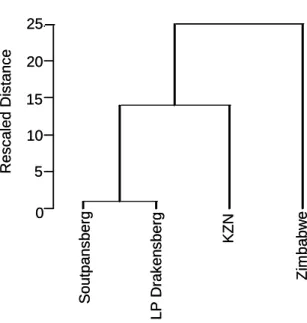
Cluster analysis
Species endemism analysis
The number of endemic species sampled in each forest varied, as did the taxonomic composition of endemics. HANGHPRODENTRATFGLTVBACSWBNAGGRO SoutpansbergDrakensberg Figure 4.11: The number of endemics for each sampled forest, with the total endemics (all levels, l), Limpopo Province forest endemics (regional, local and site levels, o) and 95% confidence limits.
Comparison with Zimbabwean and KwaZulu-Natal forests
At the species level, the similarity was strongest between the Soutpansberg and the Northern Drakensberg (Table 4.4a). Also at the species level, the Soutpansberg was more similar to KwaZulu-Natal than the northern Drakensberg.
DISCUSSION
Site similarity
If this is indeed the case, Hanglip would be the sampled forest most closely connected to the Drakensberg, and Thathe Vondo would be the most isolated from the region.
Endemism
However, the extent of centipede endemism in the forests of Limpopo Province is not exceptional compared to other forest areas. A large proportion of the endemic centipedes sampled in the forests of Limpopo Province belonged to the genera Gnomeskelus (39%) and Sphaerotherium (33%).
Forest history and invertebrate distribution
Two genera represent all endemic species of earthworms sampled in the forests of Limpopo Province, Parachilota and Tritogenia. Linear regression was used to determine whether distance to Pleistocene forest refugia sites was associated with the number of local endemic species in Limpopo Province forests.
CONCLUSION
These results indicate that historical processes significantly influence local endemism in the forests of Limpopo province. Linear regression analysis suggests that local endemism in the forests of Limpopo province could be a product of historical processes.
INTRODUCTION
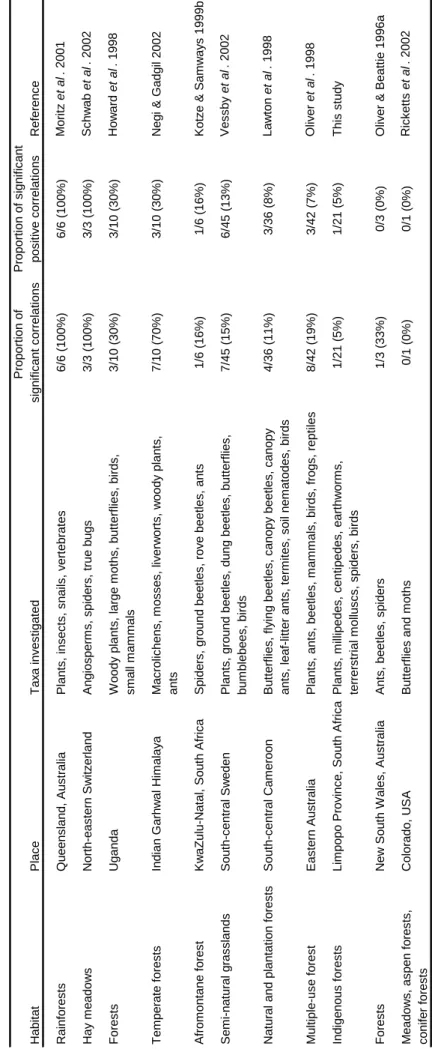
Biodiversity indicators and invertebrate studies
This substitution method requires good evidence that changes in species richness are reflected at other taxonomic levels (Balmford et al. 1996). In addition, few studies have been conducted using this method with terrestrial invertebrate groups (Pik et al. 1999).
Land classes as surrogates for species’ distributions
Environmental proxies are usually discrete land classes, but can also be continuous variables (Lombard et al. 2003). The land classes used in this study were those proposed by von Maltitz et al. 2003), which includes environmental data (climate and soil) and species of plants, birds, mammals, frogs and reptiles into land classes.
METHODS
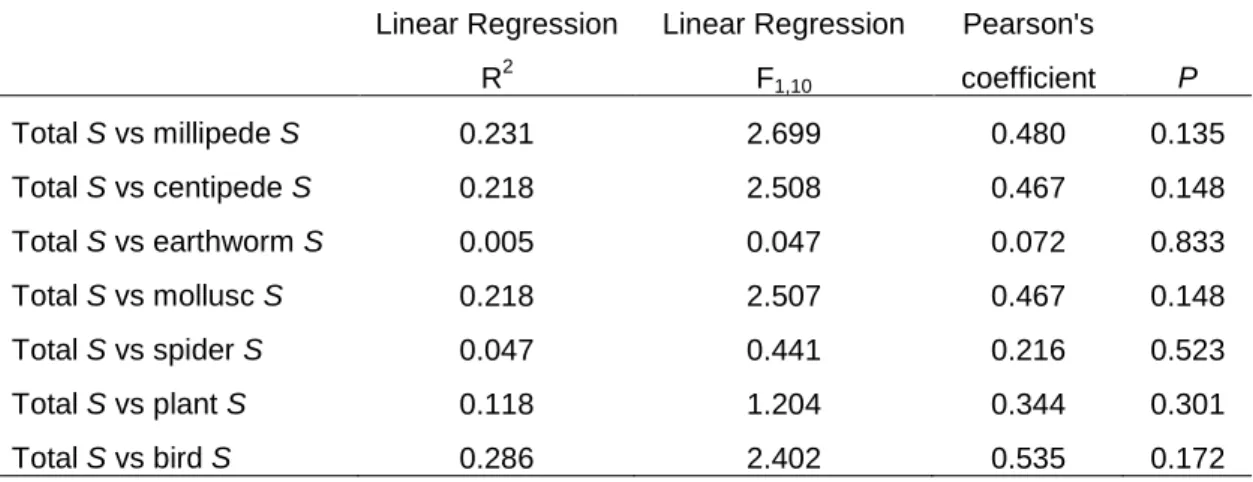
- Individual taxa as indicators of species richness
- Higher taxa as indicators of invertebrate species richness
- Morphospecies as indicators of formal (true) invertebrate species richness
- Vegetation classification as a surrogate for invertebrate species’ distributions
Cumulative species richness (S) of Limpopo province forests was calculated for each target group and for all target groups together (total target species richness). Second, the relationship between total invertebrate morphospecies and true species richness and between morphospecies and true species richness of each group was.
RESULTS
- Individual taxa as indicators of species richness
- Higher taxa as indicators of invertebrate species richness
- Morphospecies as indicators of formal (true) invertebrate species richness
- Vegetation classification as a surrogate for invertebrate species’ distributions
These results suggest that both the genus and family levels can be used as reliable surrogates for invertebrate species richness. Sheldonia(3) . Figure 5.5: Distribution of native species across families and genera in all forests of Limpopo Province for a) earthworms and b) molluscs.
DISCUSSION
- Individual taxa as indicators of species richness
- Higher taxa as indicators of invertebrate species richness
- Morphospecies as indicators of invertebrate species richness
- Vegetation classification as a surrogate for invertebrate species’ distributions
Compared to past classification systems, the relative success of von Maltitz et al.'s (2003) classification system as a surrogate for the distribution of invertebrate species becomes apparent. Although the classification of von Maltitz et al. 2003) was relatively successful as a surrogate for the distribution of invertebrate species and their uses.
CONCLUSION
INTRODUCTION
Uses of and threats to South African forests
As a result of various abuses, forests have recently become increasingly fragmented (Midgley et al. 1997). Forests are now considered one of South Africa's most vulnerable vegetation types (von Maltitz et al. 2003).
South African forest conservation
The conservation of protected but isolated forest areas depends on the conservation of species within the forests and ecosystem processes operating within and between islands (Midgley et al. 1997). Ecologists cannot prioritize conservation efforts wisely without first identifying key species and processes (Barbier et al. 1994).
Limpopo Province forest conservation at present
Hanglip Nature Reserve High intensity recreational use, socio-cultural use Roodewal Nature Reserve Conservation limited sustainable use Goedehoop Bioreserve Socio-cultural use. Thathe Vondo Nature Reserve High intensity recreational use, low intensity recreational use, socio-cultural use.
LIMPOPO PROVINCE FOREST INVERTEBRATES
Invertebrate species diversity – major findings