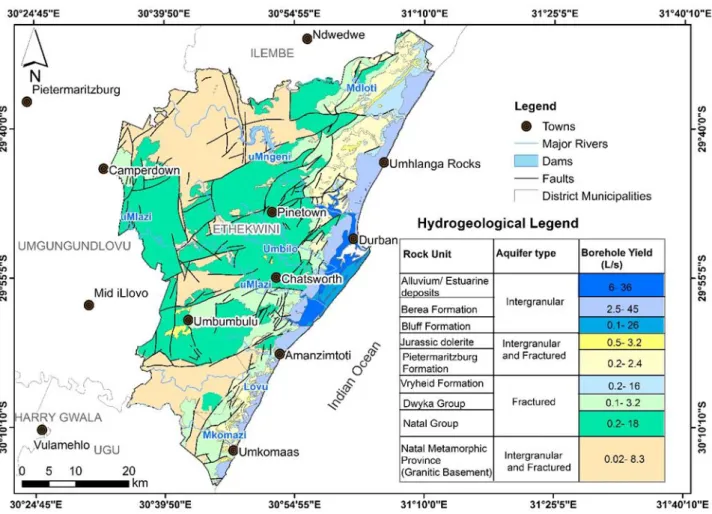
Recent alluvial and estuarine deposits have an average well yield of 24 l/s, a K value of 6.5 m/day and a T value of up to 32 m2/day. The largest percentage of deep (> 50 m) groundwater levels are associated with wells drilled in the Natal Group and Granitic Basement rocks of Natal.
Plagiarism
Research Questions
Aims and Objectives
Structure of the Dissertation
The chapter provides an account of the challenges of MAR and the legislative framework in the country. Finally, all references used in the preparation of the thesis are listed under the reference list.
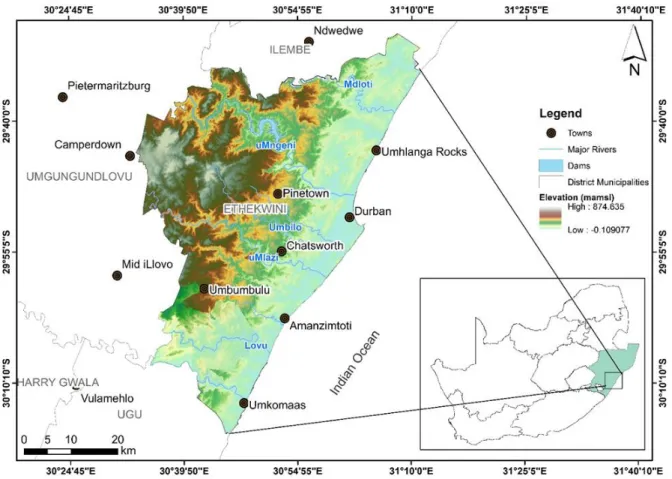
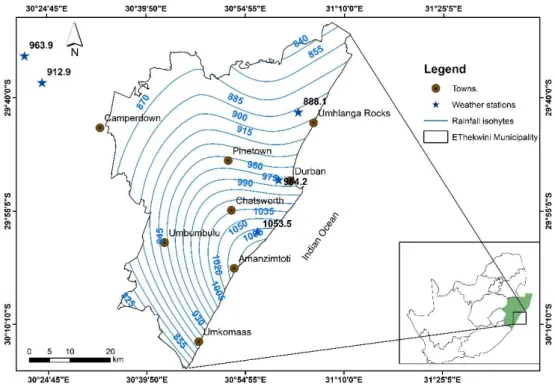
Location of the study area
Climate
DESCRIPTION OF THE STUDY AREA. Average monthly rainfall and temperature for a) Mount Edgecombe, b) Virginia, c) Botanic Gardens and d) Durban South weather stations located in the study area (data provided by SAWS, 2019).
Topography and drainage
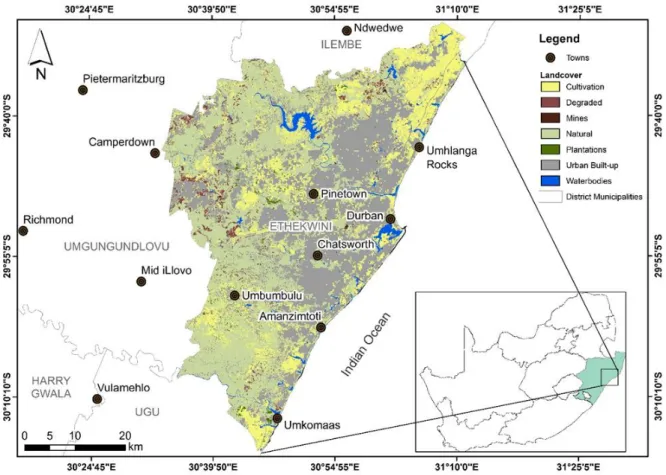
Land use and land cover
The natural vegetation of the greater eThekwini district is evergreen (Ficus natalensis, Calodendrum, Celtis, Erythrina caffra and E. lysistemon), tropical forest, consisting of widely spaced trees (Golder, 2018).
Soils
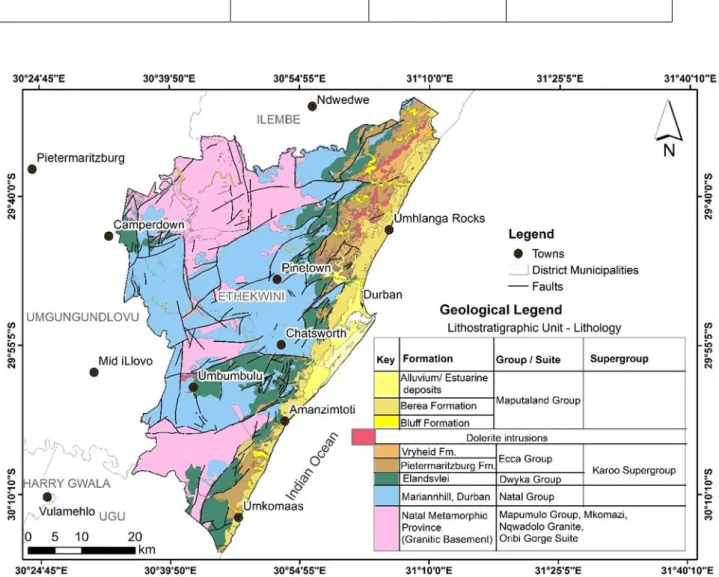
Geological Settings
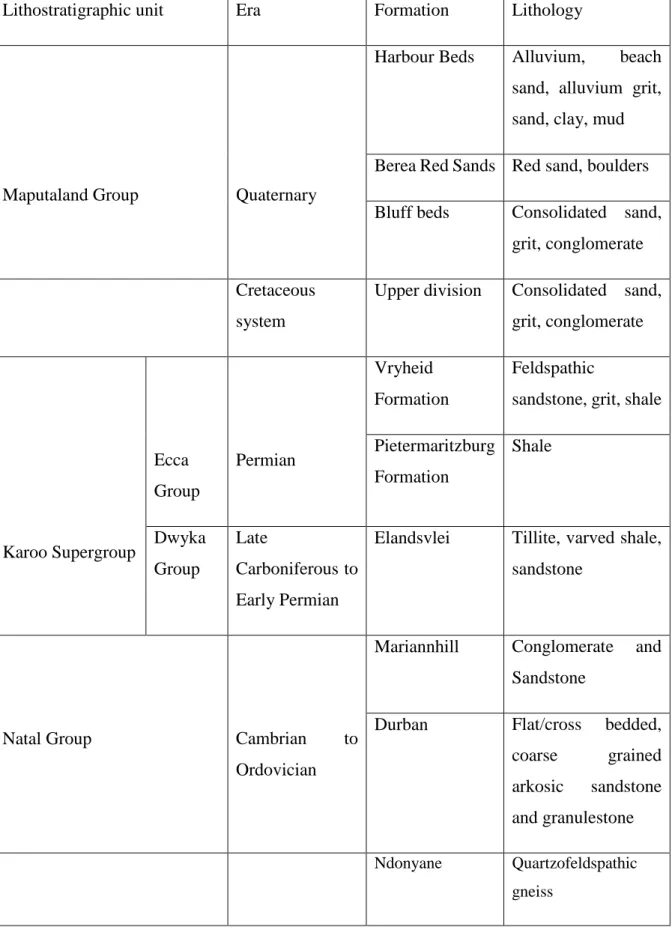
- Regional Geology
- Local geology of the greater eThekwini District Municipality
The granitic basement rocks occur in the extreme northwest and southwest of the study area. According to Bell and Lindsay (1999), the newspaper member is the fattest member of the Natal group.
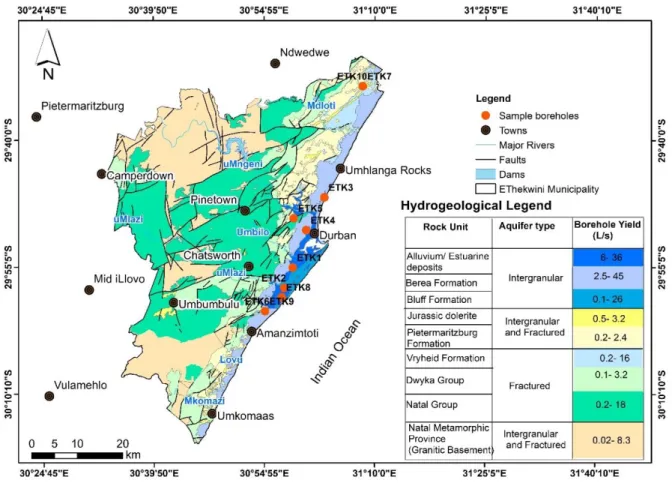
General Hydrogeological Setting
- Aquifer types
- Intergranular aquifers
- Intergranular and fractured aquifers
- Fractured aquifers
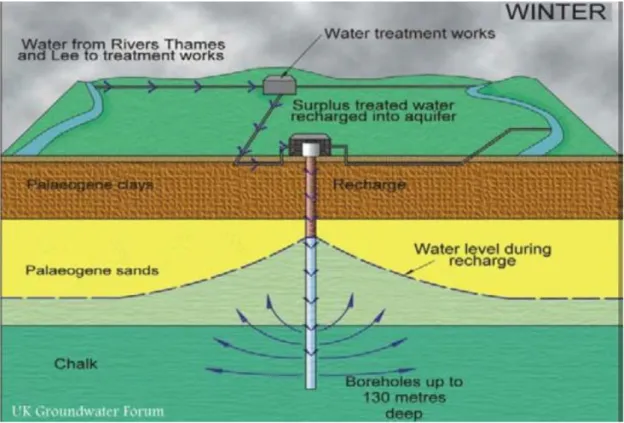
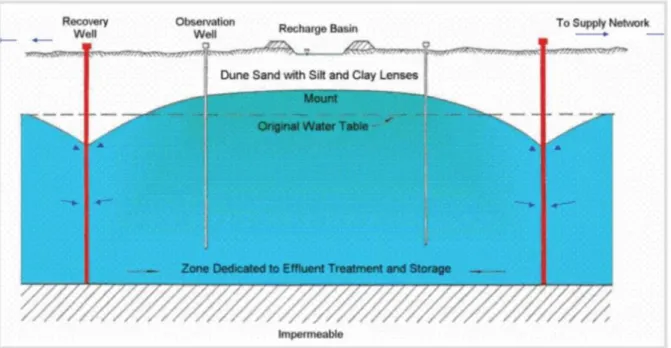
The sedimentary deposits of the Karoo Supergroup (mud/shale) and metamorphic rocks of the Namaqua Natal Metamorphic Province create intergranular and fractured aquifers (DWA, 2014). Artificial recharge of the Chalky Aquifer in the Lee Valley, North London, UK (adapted from UK Groundwater forum, 2011). The city has a population of 67,491 people (2011 census). The Atlantis Water Resources Management Scheme (AWRMS) was designed to optimize water use in the city of Atlantis, located along the arid west coast of southern Africa (DWAF, 2007).
According to SCS (1986), the hydraulic condition of any land use can be determined on the basis of the Hydrologic Soil Group (HSG) (Figure 5.3). The HSG, land use type, vegetation cover and hydraulic conditions are the basic parameters used for CN number calculation. This site consists of red to yellowish, silty, fine and medium sand, covering an area of approximately 42.84 km2. The average depth to the water level is 10 m above sea level. Assuming that a water level recovery of 3 m is allowed during MAR, using equation (6.1) the volume of 0.128 km3 is calculated for the unsaturated sand without inducing water decantation.
As a result of the hydraulic conductivity (5 m/day) and transmissivity (7 to 406 m2/day), the area around Westridge and Bulwer (where the Berea FM is thickest) will be conducive to MAR. Characteristics of the uMgeni alluvial deposits and site 7 of potential MAR in the study area. Depositional model of the Vryheid Formation in the northeastern part of the Karoo Basin- A review.
Demography and water demand and supply in the greater eThekwini District
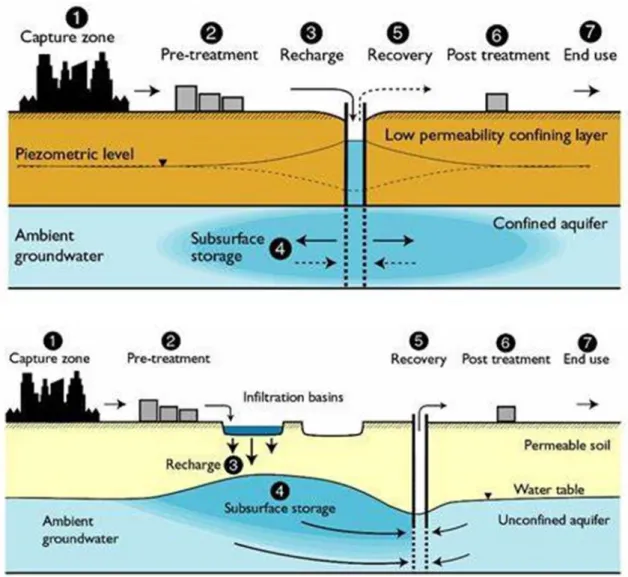
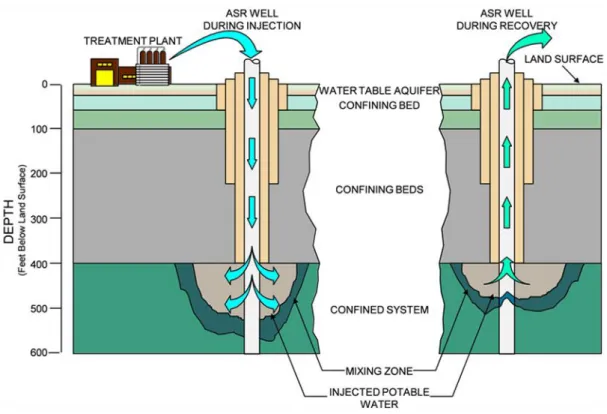
Review of managed aquifer recharge
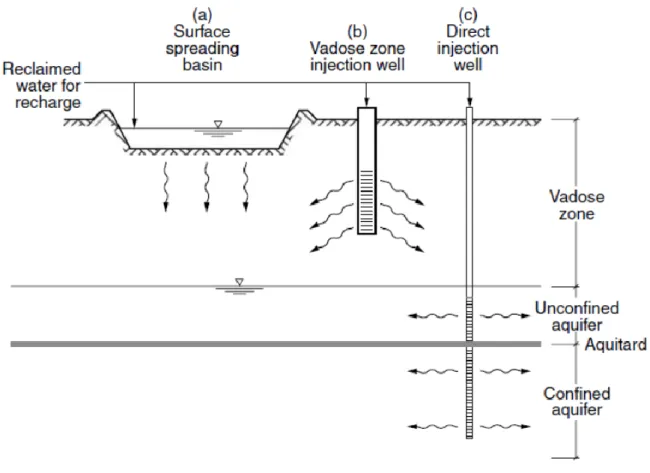
- Artificial aquifer recharge techniques
Consequently, serious concerns have not been expressed about water quality variation during aquifer storage (Pyne, 1995; Dillon et al., 2006). Sand dams: These types of dams are constructed in ephemeral streams in arid regions with low permeability lithology (Dillion et al., 2009).
Feasibility of MAR
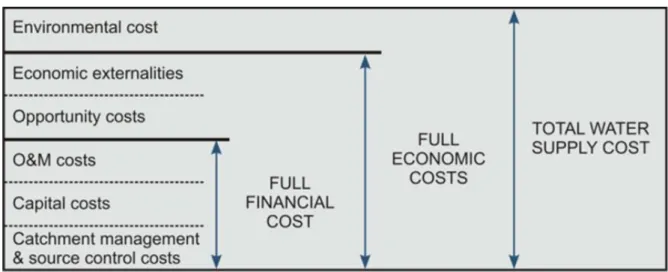
- Economic feasibility of MAR
- Legal and regulatory issues
All artificial replenishment programs must be licensed because storing water underground is defined as "water use" in the National Water Act (NWA, 1998). The NWA and the NEMA are the two primary laws governing artificial charging projects in South Africa.
Examples of managed aquifer recharge schemes
- International Experience with Managed Aquifer Recharge
- Southern African experience with Managed Aquifer Recharge
Artificial recharge is not a new concept in Australia and has been practiced at Mount Gambier in southern Australia for over a century (Riad et al. 2012; DWAF, 2007). There are 1800 artificial recharge schemes in the country and 80 out of 284 municipalities use this technology (Riad et al., 2012). Artificial recharge has been motivated by decreasing groundwater yields, increasing demands, deteriorating groundwater quality, and the need for reliable supply (Riad et al., 2012).
Feasibility studies to develop similar artificial recharge schemes have been undertaken in south London and projects in the Severn-Trent and Yorkshire regions of England are at the planning stage (Riad et al., 2012). Surface water transfer from the Okavango River was estimated at R1.79 billion compared to R242.5 million required for the artificial recharge scheme (Tredoux et al., 2012).
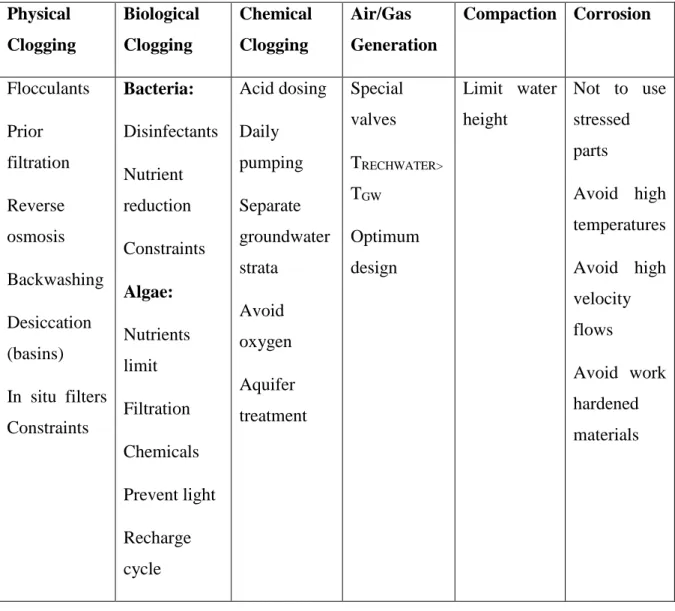
Challenges of MAR
- Clogging
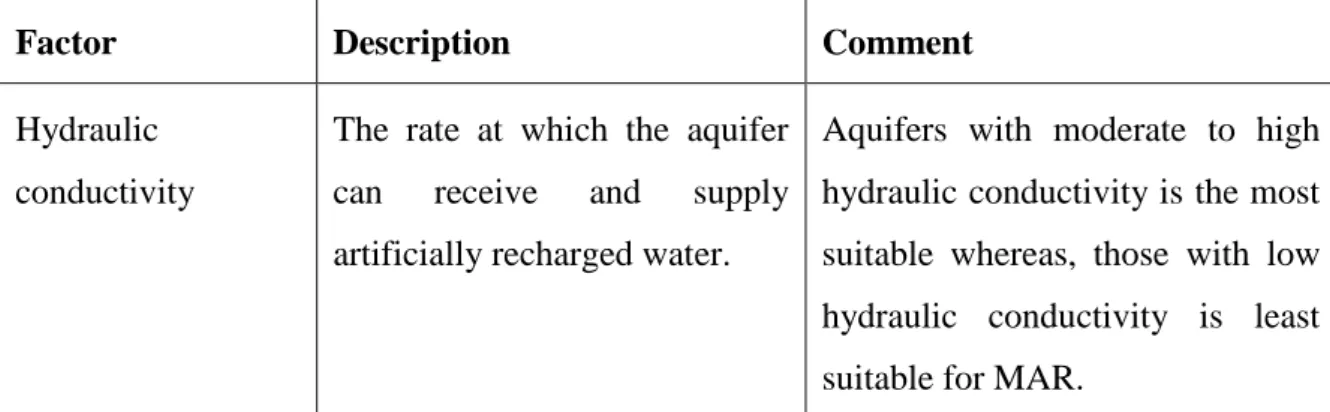
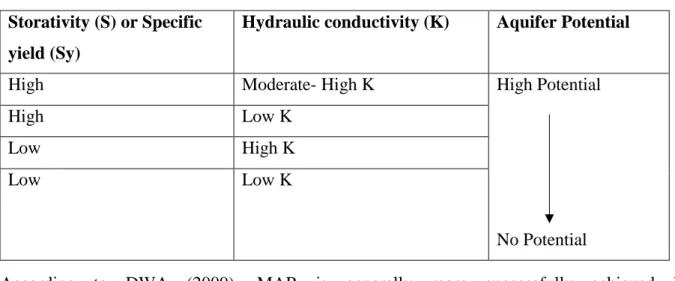
- Suitability of an aquifer to receive artificially recharged water
Second, the intergranular aquifer system occurring in eThekwini District Municipality was conceptualized based on the analysis of the collected data and information. Sample ETK8 is plotted in the left quadrant of the Piper chart, indicating recently replenished groundwater. The order of abundance of the groundwater ions in the intercrystalline aquifers is Na+>Ca2+>Mg2+>.
The order of ion abundance in groundwater is Na+> Ca2+> Mg2+>. The order of ion abundance in groundwater is Na+> Ca2+> Mg2+>. The residual concentrations of free chlorine in the final treated effluents of various WWTW plants are shown in Table 6.3.
The properties of the main aquifers occurring in the greater Durban metropolitan region are shown in Table 6.5. The quality of wastewater treated for MAR is a major concern as described in the previous sections. Wastewater Management in the City of the Future, SWITCH Training Kit, SWITCH Water Management for the City of the Future.
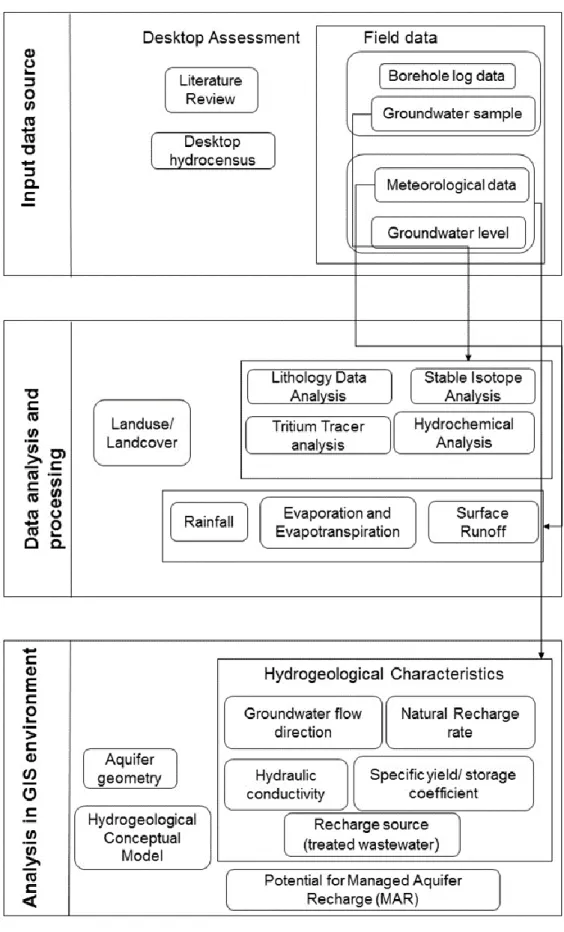
Study design
Research design methods
Data types and sources
The literature review showed that ideal aquifers where MAR can be practiced are intergranular and intergranular and fractured aquifers where the borehole yield is greater than 0.5 l/s (Murray and Tredoux, 1998). Phase 1: examination of the geological and hydrogeological map, topography and aerial photograph of the study area. The reason for studying the topography of the area was to eliminate steep terrains as they would not favor infiltration and storage.
It is noted that primary aquifers yielding more than 0.5 l/s and intergranular and fractured aquifers producing more than 5 l/s and those yielding more than 10 l/s on the hydrogeological scale map will be prioritized. Phase three: the elimination phase, where examination of information from phase two was undertaken to determine which sites had more information compared to the others and to recommend further investigation at sites lacking data.
Data analysis, interpretation and conceptualization
The permeability of the aquifer was determined in the analysis using pump test data on the FC program (Van Tonder et al., 2013). The hydrochemical signature indicates that water has undergone significant ion exchange due to the long residence time in the aquifer. Evaluating the impact of wastewater treatment plant discharge and other anthropogenic variables on river water quality in the eThekwini Metropolitan area (Doctoral dissertation).
Hydrogeological and hydrochemical investigation of the Durban Metropolitan District, Eastern South Africa (unpublished Master's thesis).
Hydrogeological conceptual model
Study limitation
- Precipitation
- Evapotranspiration
- Surface Runoff
- Groundwater abstraction and use
- Groundwater recharge
The statistical analysis shows the minimum, maximum, mean and standard deviation of the parameters in the hydrochemical data as shown in Table 5.7. If the quality of the treated water is improved, the overall rating of the Berea formation at site 1 is a medium potential for MAR. The clay content in the alluvium/estuarine deposits may be restricting flow in some parts of the aquifer, creating trapping layers.
Hydrogeological characteristics of the Durban Metropolitan Region
- Intergranular/Primary aquifers
- Fractured aquifers
- Weathered and fractured aquifers
Groundwater levels and groundwater flow direction
Groundwater hydrochemistry
- Intergranular/ primary aquifers
- Fractured aquifers
- Weathered and fractured aquifers
- Statistical analysis of hydrochemical data
A summary of eThekwini District Municipality's groundwater hydrochemistry and groundwater quality is presented based on aquifer types in the following sections using published literature and additional hydrochemical data from WARMS, GRIP and NGA. Based on the Piper diagram of Figure 5.9, holes ETK7 and ETK10 show calcium sulfate waters, which are shown in the right quadrant of the Piper diagram, confirming a relatively saline water type and may suggest contamination. All sulfate values comply with the drinking water quality standards SANS 241:2015, as the values are below 500 mg/l.
Sodium concentrations are above SANS 241: 2015 drinking water quality standards for sample ETK44 and ETK52. The Ward method of cluster analysis is the clustering of clusters or objects that causes the smallest increase in the sum of the squared deviations from the arithmetic mean of the group.
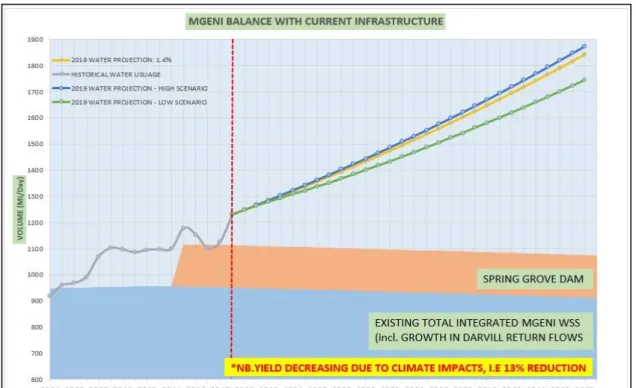
Water Supply Situations in the eThekwini District Municipality
The eThekwini Water and Sanitation Unit (EWS), the eThekwini Metropolitan Municipality's water service provider, purchases water from the uMgeni and uMdloti River Scheme through the Umgeni State Water Board. With the newly constructed Spring Grove Dam, the total water supply is just over 1100 ML/day, while the demand is estimated at around 1230 ML/day, resulting in a current water supply gap of about 120 ML/day. The current and future water supply requirement for the eThekwini District Municipality is presented in Table 6.1.
Amount of treated wastewater produced annually in eThekwini Municipality eThekwini Water and Sanitation (EWS) is responsible for the operation and management of.
Volume of treated wastewater generated annually in the eThekwini Municipality
The catchments from Lovo to Mkomazi consist of Magabeni, Umkomaas and Craigieburn WWTWs, with treated sewage discharged into the Umkhomazi River.
Quality of treated wastewater discharged into the receiving environment per bulk
- pH
- Ammonia (NH 3 )
- Chemical Oxygen Demand (COD)
- Electrical Conductivity (EC)
- Total Suspended Solids (TSS)
- Residual chlorine
The observed physicochemical composition of the various treated wastewaters is shown in Table 6.3 and discussed below. Treated wastewater with COD greater than 75 mg/l indicates the level of organic pollutants after treatment of the wastewater at the treatment plants. This could possibly indicate the inefficiency of the wastewater treatment plants in lowering the chemical oxygen consumption of the treated water and should be corrected to improve the quality of water discharged to the receiving environment.
The average residual chlorine in the treated effluent in Table 6.3 was not recorded for uMhlanga, Dassenhoek, Central, kwaNdengezi, Southern and Cato Ridge. This is the sum of the free chlorine residual and the combined available chlorine residual.
Identification of potential aquifers in the greater Durban Metropolitan region for mar
- Introduction
- Potential sites for MAR in the Berea Formation
The Berea Formation in the study area occurs as a few discrete dune deposits extending in a northeast to southwest direction along the coast and separated by the uMgeni River, uMbilo River and uMlazi River (Figure 6.5). Available information suggests that the thickness of the Berea Formation is about 23 m in the south-central part of the eThekwini District Municipality, but thicknesses as high as 77 m have been reported. The Isipingo WWTW is located less than one kilometer south of the site and can be used as a source of recharge water for the MAR.
The Amanzimtoti WWTW is located within one kilometer north of the aquifer unit and can be used to draw water to the MAR in this vicinity. Several sand layers of the uMgeni sediments can be identified in the borehole logs, although data are too sparse to delineate a specific sand layer aquifer. Based on an assessment of the hydraulic properties and related factors, the aquifer has a low potential for MAR.
One of the main goals of the eThekwini Municipality is to provide safe drinking water for every household.
Potential MAR in the alluvium and Harbour Beds Formation