Several techniques have been developed in exploring the rich spectral and spatial information in HSI. It couldn't be easier without my beloved husband: The best in the world.
Introduction
Categorization of Images Based on their Dimensionality
Remote sensing images can be classified based on the number of bands as either multispectral or hyperspectral. On the other hand, hyperspectral images contain hundreds of bands, and moreover, these bands are continuous and narrow.
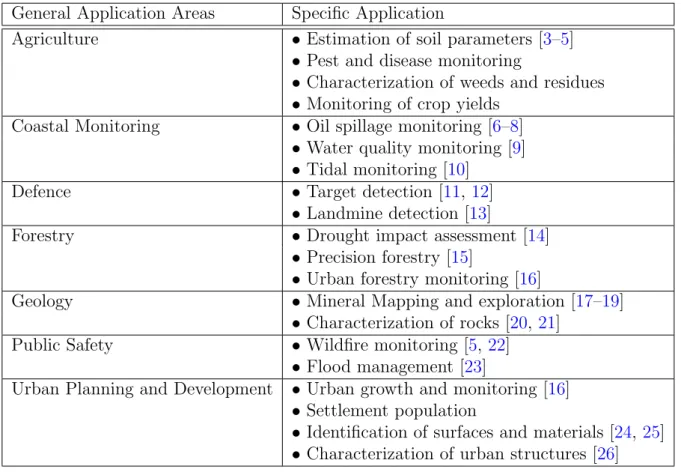
Application Areas for Hyperspectral Images
Although this distinction between multispectral and hyperspectral images is based on the number of spectral bands, they can also be differentiated based on their spectral properties, depending on whether the spectral bands in the image are separated or continuous [2].
Problems in Hyperspectral Image Processing
This challenge, also known as the 'curse of dimensionality', has attracted research efforts towards the development of highly efficient and low-complexity feature extraction and classification algorithms for processing hyperspectral images of urban areas. Also, the problem of mixed samples in hyperspectral images makes it difficult to classify some images.
Overview and Motivation
Supervised feature extraction algorithms use class labels to transform the high-dimensional HSI data space into a lower-dimensional one. A new class of feature extraction methods known as semi-supervised methods has also been conceived for processing HSIs.
Thesis Objectives
However, a need still exists for new algorithms capable of improving classification accuracy while making full use of the available unlabeled samples. Experiments show that SDA is able to exploit unlabeled samples for highly accurate feature extraction, but because it uses adjustable variables in the calculation of its projection matrix, its complexity increases significantly.
Thesis Contributions
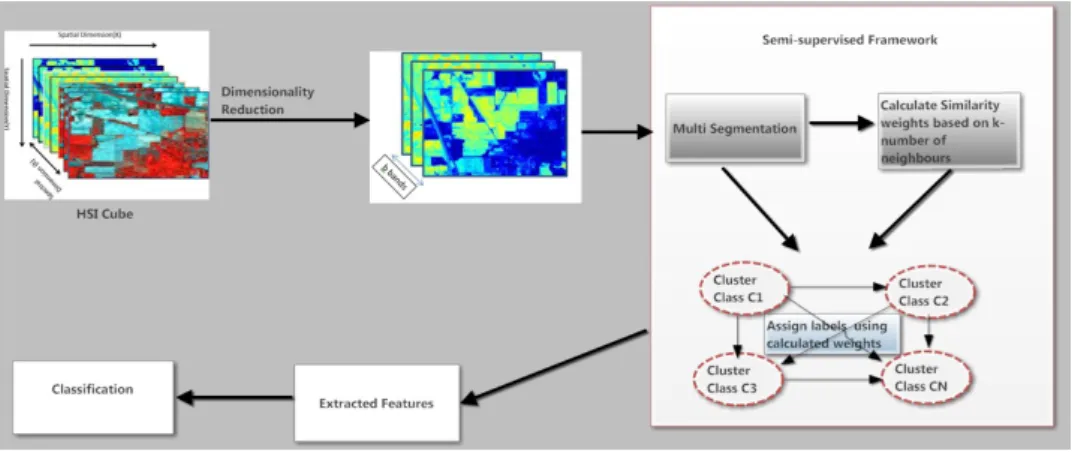
In order to use unlabeled samples in the proposed algorithm, we developed a framework that uses unsupervised k-means in a semi-supervised approach. The developed graph-based method was optimized in a way that maximized the discrimination between classes of interest in the feature extraction process, thereby increasing the expected accuracy compared to fully supervised approaches.
Thesis Outline
In the GCDA approach, unlabeled samples of hyperspectral image data are first clustered, and then the resulting labels from all clusters are used to obtain a reduced data space in a semi-supervised manner. The thesis concludes with a general discussion of the research contributions in the sixth chapter.
Introduction
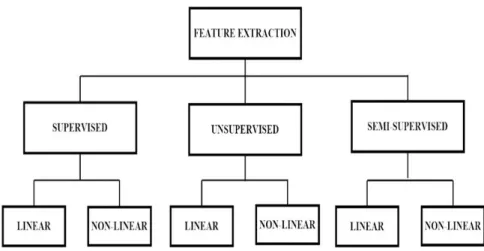
Feature Extraction in Hyperspectral Imaging
Supervised Feature Extraction
A feature extraction method is said to be supervised if it uses a priori knowledge about the structure of data using training samples. However, due to the singularity of the within-class scatter matrix, LDA would fail when the sample size is small.
Unsupervised Feature Extraction
However, the ADA and LADA algorithms have the best performance when the method used for image classification is the one based on angular distance. It calculates covariance matrices on a two-dimensional image and has a higher recognition rate compared to conventional PCA.
Semi-Supervised Feature Extraction
This approach uses multiple algorithms in preserving spatial structures through the use of graph-based approaches [51]. This method is a hybrid of discriminative locality stretching (DLA) [54] and is developed so that the spatial and spectral properties of the hyperspectral image are preserved in the reduced space.
Related Works
The approach used in the developed algorithm considers each piece of image as a cube which improves the representation of the image both spectrally and spatially. In [59], another method known as Neighborhood Preserving Orthogonal PNMF (NPOPNMF) is proposed for feature extraction in the classification of hyperspectral images.
Conclusion
This chapter presents a semi-supervised method for feature extraction in the processing of hyperspectral images. LDA and LLE have been widely used for feature extraction in the treatment of HSI.
Background of Related Feature Extraction Methods
Linear Discriminant Analysis
We discuss LDA and LLE and the detailed analysis of the developed semi-supervised local linear embedding is presented in Section 3.2. In terms of class separability, an optimal linear transformation matrix, W, can be found using Fisher's Discriminant Function Ratio, also known as Raleigh's Quotient. Using these eigenvectors, {Wi∗}C−1i=1 and equations 3.6, 3.13 and 3.15, an optimal linear transformation T∗ based on Fisher's Discriminant Analysis is derived.
Local Linear Embedding
Compute the vectors that are best reconstructed by [Wij] minimizing the quadratic form by its lower nonzero eigenvectors. LLE has a computational complexity of O(dn2), O(dnK3) and O(rn2) for the three steps respectively where d is the input dimensionality, K is the number of nearest neighbors, n is the number of data points and r is the output dimensionality. LLE on the other hand preserves the local environment of the data in the low dimensional feature space.
Semi-supervised Local Embedding
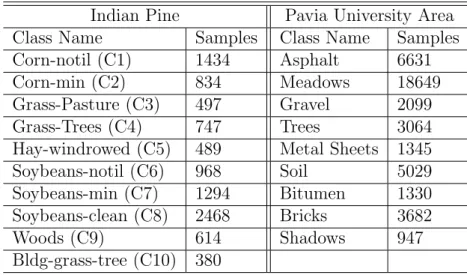
After a careful survey, it was determined that LDA maximizes the between-class similarity while minimizing the intra-class similarity. A non-linear dimensionality reduction method, LLE is used in the within-class scatter matrix of LDA. Then, the principal components (PCs) obtained are substituted for the overall 200 data dimensions after removing the 20 water absorption bands.
Experimental Results and Discussion
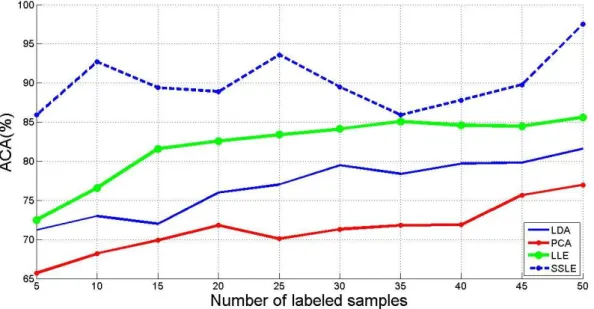
Landgrebe shows in his work that the majority of the hyperspectral image bands contain null spaces [75]. The trained classifier was applied to the remaining 80% of the known ground truth pixels in the scene. LDA and LLE performed relatively closer to each other, although LLE had higher accuracies than LDA due to the singularity problem in LDA.
Conclusion
Discriminative feature extraction methods perform dimensionality reduction by eigenvalue decomposition of the covariance matrix of the image data. The proposed method assumes that there is prior knowledge of the number of classes in the image, but this assumption causes difficulties in the implementation of the algorithm. In addition, nonlinear methods are very successful when implemented in HSI processing due to the nonlinear manifold nature of hyperspectral images [78].
Related Work
Linear Discriminant Analysis
Originally introduced in [32], the supervised linear feature extraction method maximizes the ratio of the between-class covariance matrix to the within-class covariance matrix. Sw represents the within-class distribution matrix and Sb represents the between-class distribution matrix.
K-means Clustering
Laplacian Eigenmaps
To represent a low-dimensional data from a high-dimensional one, we place an edge between nodes i and j if two data points xi and xj are close. For any two data points xi and xj connected by an edge, we place a weight Wij = 1 and the eigenvalues and eigenvectors are calculated from. The constraintTDy= 1 is said to remove an arbitrary scale factor in the Laplacian Embedding.
Graph Clustered Discriminant Analysis (GCDA)
In other words, in the extracted low-dimensional subspace, points from the same class are intended to be kept as spatially close as possible, and points from different classes are kept as far apart as possible. Each vertex of the graph is represented in the low-dimensional vector by maintaining the similarities between pairs of vertices, where the similarity is measured by LE functions. Considering the weight centers of each class in the inter-class Gbn graph, only the points that are connected to each other are used.
Experiments
For each of the DR methods, the accuracies for the NN and SVM classifiers were obtained. In Figures 4.7 and 4.8, the average accuracy is presented as a function of the number of extracted features when classified with SVM using 16 and 32 training samples, respectively. The results of the z-score significance test for the Indian Pines AVIRIS data sets using SVM and NN are presented.
Conclusion
Supervised feature extraction methods use class labels for the computation of their projection matrix, while the unsupervised ones do not. In spectral feature extraction methods, pixels are analyzed individually, while in spatial methods pixels are grouped based on predefined similarities. Despite the existence of other feature extraction techniques, PCA [76] is an unsupervised feature extraction technique that has been widely used in HSI processing due to its simplicity and ability to represent the total variance of the image in few eigenvectors ( components). ).
Related Works
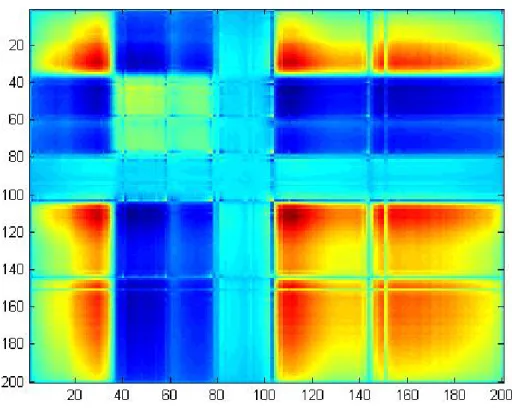
The idea is to dimension the HSI cube into a specified number of windows and then estimate the covariances for each window in the HSI to reduce the loss in spatial information when computing the principal components. The overall covariance of the HSI is then obtained by an iterative fusion of the covariance of each window in the HSI based on Kalmer filtering. Covariance matrices, also referred to as second moments, play an important role in the formulation of PCA algorithm.
Windowed Linear Feature Extraction
Since the covariance matrices are square matrices, the dimension of the covariance matrix obtained from the window image is l×l. Mn, Cn)) of all n windows, the calculation of the total mean vector and the total covariance matrix (M, C) of the image is done as shown by algorithm 3. The eigenvalues and eigenvectors for the whole image are calculated from the matrices combined covariance. It is required to obtain the total covariance of the HSI by combining the covariances of all windows of.
Experiments
From table 5.2, it was shown that with the increase of training samples the accuracies of PCA, Seg-PCA and. WinPCA increased, but on a different number of training samples, WinPCA outperforms the Seg-PCA and PCA feature extraction methods. Also the performance of WinPCA with 30 training samples was better than that of PCA and Seg-PCA.
Conclusion
The proposed techniques adopt unsupervised and semi-supervised feature extraction methods for their development. In particular, three feature extraction methods are developed, namely, Semi-Supervised Local Linear Embedding (SSLE), Graph Clustered Discriminant Analysis (GCDA), and Windowed Principal Component Analysis (Win-PCA). The development of the SSLE technique aimed to exploit the strengths of Linear Discriminant Analysis (LDA), a supervised method, and Local Linear Embedding (LLE), which is an unsupervised feature extraction method.
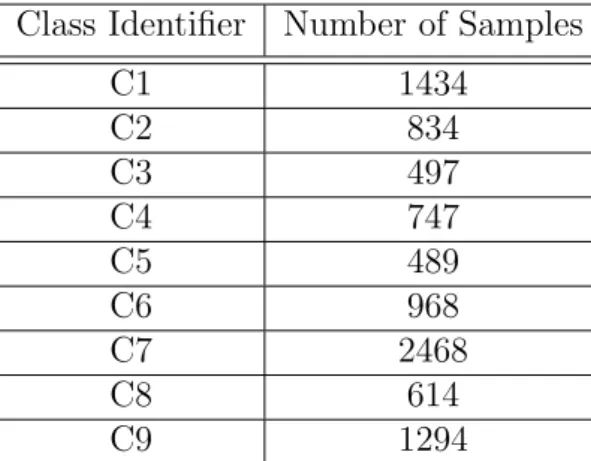
Class Accuracy
The following provides a brief description of the various metrics used to calculate the accuracy and express the effectiveness of the methods described in this research.
Overall Accuracy
Average Accuracy
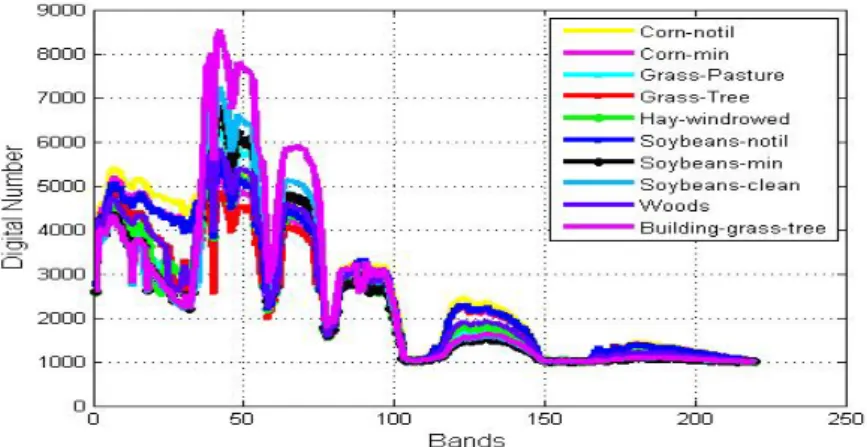
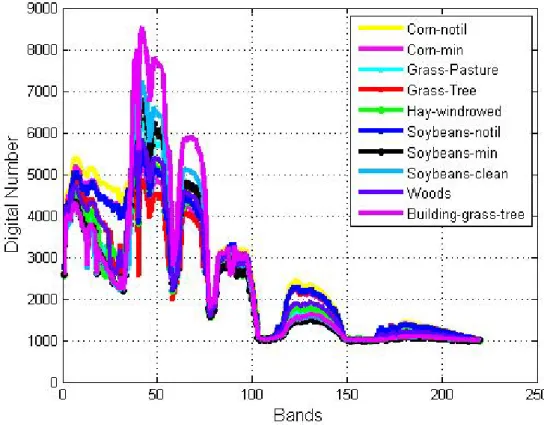
- Spectral Curves of the AVIRIS Indian Pine Image
- Feature Extraction in HSI
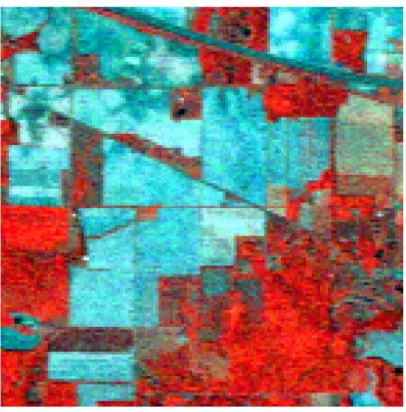
- Ground Truth of the AVIRIS Image showing the Sixteen Classes 32
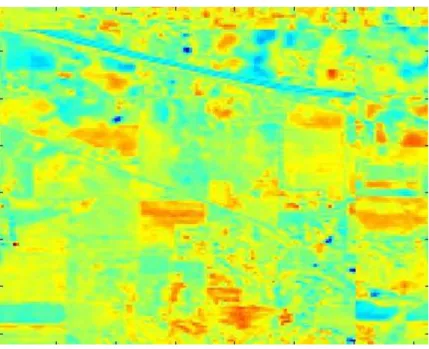
- Spatial Display of the Second Extracted Principal Component
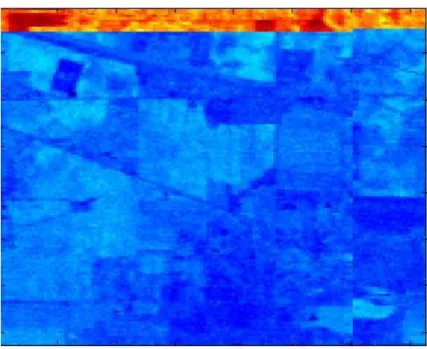
- Spatial Display of the Third Extracted Principal Component
- Average Accuracy with varied number of labelled samples
- Illustration of the within-class and between-class weight
- Flow chart of the proposed approach
- Indian Pine Image Using NN Classifier with 16 Training Samples 58
- Covariance for the AVIRIS Indian Pine Data
- Windowed-PCA Approach
- Spectral Curves for the AVIRIS Indian Pine Data
- Classification Accuracy for Extracted Principal Components
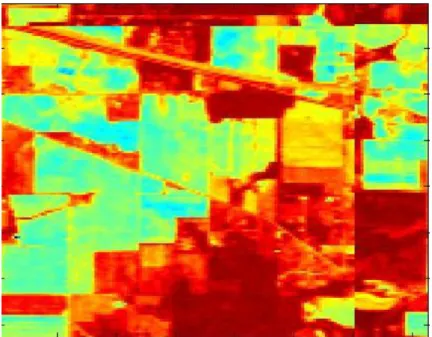
- The First 12 Components Extracted by PCA
- The First 12 Components Extracted by WinPCA
- Classification Accuracy for Extracted Principal Components
The use of hyperspectral remote sensing data for the assessment of chemical properties of arid soils in se-Spain. Application of hyperspectral remote sensing in ecological boundary research in northern agriculture-pasture transition in China. Novel folded pca for improved feature extraction and data reduction with hyperspectral imaging and sar in remote sensing.