THE INVESTIGATION OF FLUORINATED SOLVENTS FOR CARBON DIOXIDE ABSORPTION
ZIBUSISO LUBIMBI
[B.ENG, NUST, ZIMBABWE]
Submitted in fulfilment of the requirements for the degree Master of Science in Engineering (Chemical Engineering) in the College of Agriculture, Engineering and Science, University of
KwaZulu-Natal, Durban.
Supervisors: Prof. Deresh Ramjugernath, Prof. Paramespri Naidoo and Dr. Wayne Nelson.
i | P a g e As the candidate’s supervisor I agree to the submission of this thesis:
Prof. Deresh Ramjugernath Prof. Paramespri Naidoo
Dr. Wayne Nelson
DECLARATION
I, Zibusiso Lubimbi, student number: 215081031 declare that:
The research reported in this dissertation/thesis, except where otherwise indicated, is my original work.
(i) This dissertation/thesis has not been submitted for any degree or examination at any other university.
(ii) This dissertation/thesis does not contain other person’s data, pictures, graphs or other information unless specifically acknowledged as being sourced from other persons.
(iii) This dissertation/thesis does not contain other person’s writing unless specifically acknowledged as being sourced from other researchers. Where other written sources have been quoted, then:
a) their words have been re-written, but the general information attributed to them has been referenced;
b) Where their exact words have been used, their writing has been placed inside quotation marks and referenced.
(iv) Where I have reproduced a publication of which I am an author, co-author or editor, I have indicated in detail which part of the publication was written by myself alone and have fully referenced such publications.
Signed: Date:
ii | P a g e
Acknowledgements
“Knowledge is in the end based on acknowledgement” Ludwig Wittgenstein.
This work was made possible through the encouragement, assistance and support of the following:
My God, through whom all things are possible.
My supervisors Dr. W. Nelson, Prof. P. Naidoo and Prof. D. Ramjugernath for their invaluable support and assistance throughout the duration of the project and for affording me the opportunity to call UKZN my alma mater.
The Fluorochemical Expansion Initiative (FEI) and NRF for their financial assistance.
The Thermodynamics Research Unit’s laboratory staff and the Chemical Engineering Workshop technicians, with special mention given to Mr Ayanda Khanyile and Mr Sanjay Deeraj.
My colleagues in the Chemical Engineering department, Mr E. Gande, Miss N. Moodley, Mr P. Bengesai, Mr P. Ndlovu, Mr F. Chikava and Mr S. Nkwanyana.
Last but not least, my Parents, Mr and Mrs Lubimbi, for the encouragement and unwavering support throughout all the years of my studies, of which I am eternally grateful.
iii | P a g e
Abstract
Research studies have shown that the solubility of carbon dioxide is higher in compounds that contain a fluorinated alkyl segment compared to their non-fluorinated counterparts. Despite this, published experimental data relating to the solubility of carbon dioxide in fluorinated compounds is still limited in literature, with the available data comprising of only fluorinated hydrocarbons (perfluorocarbons). Previous studies utilised the perfluorocarbons (PFCs) C6F14, C6F6, C7F8, C7F14, C8F18, C10F18 and heavier PFCs C13F22, C14F24 and C17F30. This study builds upon the investigation of fluorinated compounds as potential solvents for flue gas treatment. The research work involved generating a database of thermophysical properties of fluorinated chemicals and identifying the effects of chemical functional groups on the solubility of carbon dioxide in fluorinated chemicals. HPVLE measurements were performed at the temperatures (273.15, 293.15 and 313.15) K and pressures up to approximately 7.5 MPa. The binary systems of carbon dioxide with either perfluoroheptane, perfluorononane or 1,1,2,2-tetrafluoroethyl 2,2,3,3-tetrafluoropropyl ether were measured at three isotherms. The core measurements were conducted through the use of an apparatus which utilised the static analytic method and was fitted with an equilibrium cell with a volume of approximately18 cm3. Sample withdrawal from within the cell was achieved via the Rapid Online Sampler Injector (ROLSI™). A second apparatus of the static synthetic type, with a variable volume cell, was used to affirm the data from the static analytic apparatus. The generated experimental data was regressed via the Peng-Robinson equation of state with the classical one-fluid mixing rule and/or the Peng–Robinson equation of state incorporating the Mathias-Copeman alpha function with the Wong-Sandler mixing rules and the Non-Random Two Liquid local composition model. The three novel binary systems were better correlated by the complex model, with relative deviations in both pressure and composition below 1.5%. The binary system consisting of the hydrofluoroether exhibited negative deviation from Raoult’s law due to the combination of the ether group and the (C-F) bond, resulting in better carbon dioxide solubility relative to the perfluorocarbons used in this work.
Carbon dioxide solubility data for the hydrofluoroether system measured at 313.15 K was then compared to VLE data for the industrial solvent GENOSORB 1753 (mixture of polyethylene glycol dimethyl ethers), which was also measured at 313.15 K. The comparison indicated that the two solvents had near identical carbon dioxide dissolution capabilities in the (0 - 0.2) mole fraction
iv | P a g e range, with the hydrofluoroether eventually outperforming the industrial solvent in the (0.2 – 1) range. Studies have shown that the GENOSORB 1753 solvent is on par with the reputable SELEXOL solvent with regard to carbon dioxide dissolution capabilities. Thus the exceptional proficiency of the hydrofluoroether in absorbing carbon dioxide was deemed competitive at an industrial level. However other factors such as the high vapour pressure of the fluorinated compounds still need to be rectified, possibly through the mixing of various homologs of the solvents. Furthermore, the selectivity of the hydrofluoroethers for other gases in a flue gas stream should also be studied in conjunction with a comprehensive process selection and design study to further assess their viability as absorption solvents.
v | P a g e
Nomenclature
α Cubic equation of state parameter
𝒂𝒊𝒋 Temperature dependence in the Aspen NTRL τ function/classical combining rule A Molar Helmholtz free energy (kJ.mol-1)
b Equation of state co-volume parameter
𝒃𝒊𝒋 Temperature dependence in the Aspen NTRL τ function 𝒄𝒊(𝒊 = 𝟏, 𝟐, 𝟑) Mathias-Copeman parameters
f Fugacity (MPa)
𝒈𝒊𝒋 Adjustable parameter for the NRTL model (kJ.mol-1) G Molar Gibbs free energy (kJ.mol-1)
k Coverage factor
𝒌𝒊𝒋 Binary interaction parameter 𝒍𝒊𝒋 Binary interaction parameter
n Number of data point
P Pressure (MPa)
R Universal gas constant (J. mol-1.k-1 T Temperature (K)
𝒖𝒄 Combined standard uncertainty U Expanded uncertainty
v Molar volume (m3. mol-1) x liquid mole fraction
y Vapour mole fraction
z Liquid or vapour compositions
Greek Letters
α Alpha function in the equation of state
𝜶𝒊𝒋 Non-randomness parameter in the NRTL model 𝝋 Fugacity coefficient
𝜺 Equation of state constant
vi | P a g e 𝜸 Activity coefficient
𝝉 NRTL energy parameter 𝝈 Standard deviation 𝝆 Density (kg. m3) 𝝎 Acentric factor
vii | P a g e
Table of Contents
DECLARATION ... i
Acknowledgements ... ii
Abstract ... iii
Nomenclature ... v
List of Figures ... xi
List of Tables ... xiii
Chapter 1 ... 1
1 Introduction ... 1
1.1 Dissolution of light gases ... 2
1.1.1 Carbon dioxide capture through absorption ... 2
1.2 Overview of the study ... 3
Chapter 2 ... 6
2 Review of solvents for carbon dioxide physical absorption ... 6
2.1 Introduction ... 6
2.2 Characteristics of a suitable absorption solvent ... 6
2.3 Industrial solvent ... 10
2.4 Fluorinated solvents ... 11
2.5 Physical properties of the chemicals of interest ... 15
2.6 Published VLE data for carbon dioxide + fluorinated compounds ... 17
Chapter 3 ... 20
3 Equipment review ... 20
3.1 Analytic-Isothermal methods with sampling ... 22
3.2 Synthetic-visual method with phase transition... 24
Chapter 4 ... 27
viii | P a g e
4 Experimental apparatus ... 27
4.1 Static analytic apparatus ... 27
4.1.1 Equilibrium cell and housing ... 29
4.1.2 Equilibrium cell temperature and pressure ... 32
4.1.3 Sample analyses ... 33
4.2 Static synthetic apparatus ... 36
4.2.1 Variable volume cell and housing... 38
Chapter 5 ... 39
5 Experimental procedures ... 39
5.1 Experimental procedure for the static analytical apparatus ... 39
5.1.1 Temperature and pressure calibration ... 39
5.1.2 Gas Chromatograph detector calibration ... 40
5.1.3 Equilibrium measurements ... 44
5.1.4 Vapour Pressure measurement ... 46
5.1.5 HPVLE Measurements ... 47
5.2 Experimental procedure for the static synthetic variable volume apparatus ... 49
Chapter 6 ... 53
6 Theoretical analysis of phase equilibria data ... 53
6.1 Analyses of HPVLE Data ... 53
6.2 Thermodynamic models used in the study ... 55
6.2.1 Cubic equation of state: Peng-Robinson (Peng –Rob) ... 55
6.2.2 Alpha function: Mathias Copeman. ... 56
6.2.3 Mixing rules: Wong-Sandler ... 59
6.2.4 Activity coefficient model: NRTL ... 62
6.3 Data regression ... 63
ix | P a g e
Chapter 7 ... 66
7 Results and discussion ... 66
7.1 Introduction ... 66
7.2 Purity of chemicals ... 66
7.3 Calibrations ... 68
7.4 Vapour pressures ... 74
7.5 Vapour-liquid equilibrium test system measurements and modelling. ... 78
7.5.1 Carbon dioxide (1) + hexane (2):1st test system ... 79
7.5.2 Carbon dioxide (1) + perfluorooctane (2): 2nd test system ... 82
7.6 Novel phase equilibrium measurements ... 87
7.6.1 Carbon dioxide (1) + 1,1,2,2-tetrafluoroethyl 2,2,3,3-tetrafluoropropyl ether (2) . 88 7.6.2 Carbon dioxide (1) + perfluoroheptane (2) ... 96
7.6.3 Carbon dioxide (1) + perfluorononane (2) ... 103
7.7 Comparison of carbon dioxide solubility in solvents ... 108
Chapter 8 ... 114
8 Conclusions and Recommendations ... 114
8.1 Conclusions ... 114
8.2 Recommendations ... 115
References ... 117
Appendix A ... 129
A. Temperature and pressure calibration data ... 129
A.1 Temperature ... 129
A.2 Pressure ... 130
Appendix B ... 132
B. Gas chromatography TCD calibration data ... 132
x | P a g e
Appendix C ... 136
C. Estimation of experimental uncertainty ... 136
C.1 Temperature and pressure ... 137
C.2 Uncertainties in composition ... 138
C.3 Sample calculation for the static analytic apparatus ... 140
xi | P a g e
List of Figures
FIGURE 2-1: P-X PLOTS FOR CO2 (1) + FLUORO-COMPOUND (2) SYSTEMS AT 313.15 K. ( ... 18 FIGURE 3-1: CLASSIFICATION OF EXPERIMENTAL TECHNIQUES FOR HIGH-PRESSURE PHASE
EQUILIBRIUM MEASUREMENTS. ... 21 FIGURE 4-1: SCHEMATIC OF THE STATIC ANALYTIC HIGH-PRESSURE VLE APPARATUS OF
NARASIGADU. ... 28 FIGURE 4-2: CROSS-SECTIONAL DRAWING OF THE ROLSI™ (IN OPEN POSITION): ... 34 FIGURE 4-3: SCHEMATIC OF THE STATIC SYNTHETIC APPARATUS WITH A VARIABLE VOLUME
CELL... 37 FIGURE 5-1: PRESSURE VS TIME CHART FOR THE CARBON DIOXIDE (1) + 1,1,2,2-
TETRAFLUOROETHYL 2,2,3,3-TETRAFLUOROPROPYL ETHER (2) SYSTEM. ... 52 FIGURE 7-1: DEVIATION PLOTS FOR TRUE AND CALCULATED CARBON DIOXIDE NUMBER OF
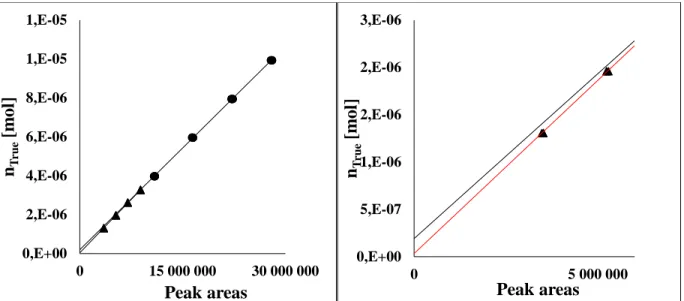
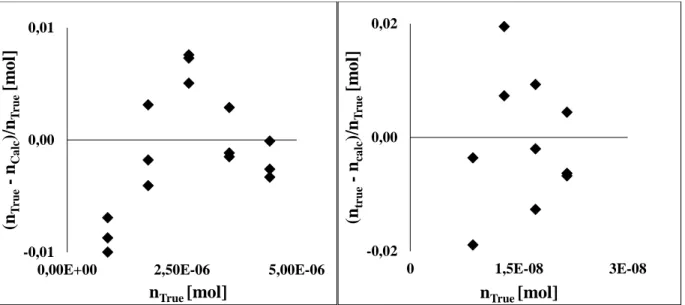
MOLES,. ... 69 FIGURE 7-2: GC CALIBRATION PLOTS FOR CARBON DIOXIDE VIA DIRECT INJECTION FROM A
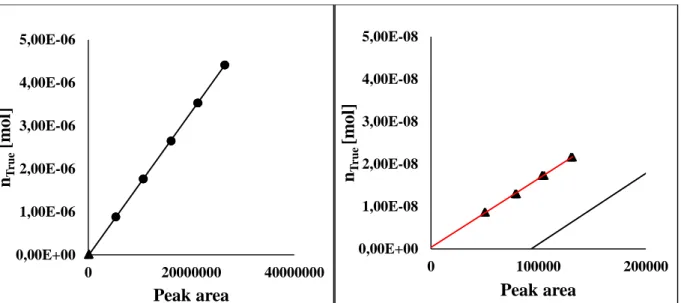
250µL SYRINGE, ... 70 FIGURE 7-3: CALIBRATION PLOTS FOR 1,1,2,2-TETRAFLUOROETHYL-2,2,3,3-TETRAFLUOROPROPYL
ETHER. (LEFT), LINEAR CALIBRATION PLOT (RIGHT) DEVIATION PLOT OF TRUE AND CALCULATED 1,1,2,2-TETRAFLUOROETHYL 2,2,3,3-TETRAFLUOROPROPYL ETHER NUMBER OF MOLES. ... 71 FIGURE 7-4: DEVIATION PLOTS FOR TRUE AND CALCULATED PERFLUOROHEPTANE NUMBER OF
MOLES, (LEFT) INJECTION OF PURE PERFLUROHEPTANE, (RIGHT) INJECTION OF A
PERFLUOROHEPTANE + PENTANE MIXTURE. ... 72 FIGURE 7-5: DEVIATION PLOTS FOR TRUE AND CALCULATED PERFLUORONONANE NUMBER OF
MOLES, (LEFT) INJECTION OF PURE PERFLURONONANE, (RIGHT) INJECTION OF A
PERFLUORONONANE + HEXANE MIXTURE. ... 72 FIGURE 7-6: GC CALIBRATION PLOTS FOR PERFLUOROHEPTANE VIA DIRECT INJECTION FROM A
250µL SYRINGE,. (LEFT) THE SUPERIMPOSED PLOT FOR THE TWO CALIBRATIONS. (RIGHT) THE EXPANDED PLOT,. ... 73 FIGURE 7-7: GC CALIBRATION PLOTS FOR PERFLUORONONANE VIA DIRECT INJECTION FROM A
250µL SYRINGE,. (LEFT) THE SUPERIMPOSED PLOT FOR THE TWO CALIBRATIONS. (RIGHT) THE EXPANDED PLOT, ... 73 FIGURE 7-8: VAPOUR PRESSURE DATA FOR (LEFT) CARBON DIOXIDE, (RIGHT) 1,1,2,2
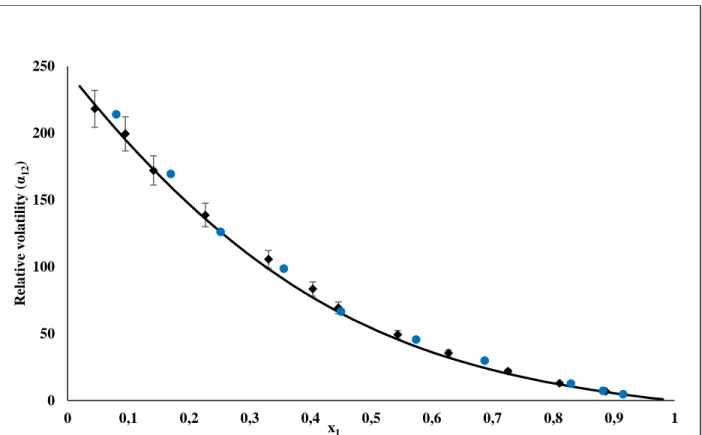
TETRAFLUOROETHYL 2,2,3,3-TETRAFLUOROPROPYL ETHER………... 76 FIGURE 7-9: P-XY DATA FOR THE CARBON DIOXIDE (1) + HEXANE (2) SYSTEM AT 313.12 K. 80 FIGURE 7-10: PLOT OF RELATIVE VOLATILITY (Α12) AS A FUNCTION OF LIQUID COMPOSITION (X1)
FOR THE CARBON DIOXIDE (1) + HEXANE (2) SYSTEM... 81
xii | P a g e
FIGURE 7-11: P-XY DATA FOR THE CARBON DIOXIDE (1) + PERFLUOROOCTANE (2) BINARY
SYSTEM MEASURED AT 293.12 K. ... 84 FIGURE 7-12: RELATIVE VOLATILITY (Α12) AS A FUNCTION OF THE LIQUID COMPOSITION (X1), 86 FIGURE 7-13: P-XY DATA FOR THE CARBON DIOXIDE (1) + 1,1,2,2-TETRAFLUOROETHYL 2,2,3,3-
TETRAFLUOROPROPYL ETHER (2) BINARY SYSTEM FOR THREE ISOTHERMS VIA THE STATIC ANALYTIC APPARATUS. ... 91 FIGURE 7-14: RELATIVE VOLATILITY (Α12) AS A FUNCTION OF COMPOSITION FOR THE CARBON
DIOXIDE (1) + 1,1,2,2-TETRAFLUOROETHYL 2,2,3,3-TETRAFLUOROPROPYL ETHER (2) BINARY SYSTEM. ... 93 FIGURE 7-15: MODEL PARAMETERS FOR THE CARBON DIOXIDE (1) + 1,1,2,2-TETRAFLUOROETHYL
2,2,3,3-TETRAFLUOROPROPYL ETHER (2) BINARY SYSTEM. (LEFT) PARAMETERS FOR THE NRTL MODEL OBTAINED THROUGH INDIVIDUAL REGRESSION, (RIGHT) PARAMETERS FOR THE WONG SANDLER MIXING RULES OBTAINED THROUGH INDIVIDUAL REGRESSION …….95 FIGURE 7-16: P-XY DATA FOR THE CARBON DIOXIDE (1) + PERFLUOROHEPTANE (2), FOR THREE
ISOTHERMS VIA THE STATIC ANALYTIC APPARATUS. ... 98 FIGURE 7-17: RELATIVE VOLATILITY (Α12) AS A FUNCTION OF COMPOSITION FOR THE CARBON
DIOXIDE (1) + PERFLUOROHEPTANE (2) BINARY SYSTEM. ... 100 FIGURE 7-18: MODEL PARAMETERS FOR THE CARBON DIOXIDE (1) + PERFLUOROHEPTANE (2)
BINARY SYSTEM. (LEFT) PARAMETERS FOR THE NRTL MODEL OBTAINED THROUGH
INDIVIDUAL REGRESSION,. (RIGHT) PARAMETERS FOR THE WONG SANDLER MIXING RULES OBTAINED THROUGH INDIVIDUAL REGRESSION ... 101 FIGURE 7-19: P-XY DATA FOR THE CARBON DIOXIDE (1) + PERFLURONONANE (2) BINARY SYSTEM
FOR THREE ISOTHERMS VIA THE STATIC ANALYTIC APPARATUS. FOR TWO ISOTHERMS VIA THE STATIC SYNTHETIC APPARATUS: ... 104 FIGURE 7-20: RELATIVE VOLATILITY (Α12) AS A FUNCTION OF COMPOSITION FOR THE CARBON
DIOXIDE (1) + PERFLUORONONANE (2) BINARY SYSTEM. ... 106 FIGURE 7-21: MODEL PARAMETERS FOR THE CARBON DIOXIDE (1) + PERFLUORONONANE (2)
BINARY SYSTEM. (LEFT) PARAMETERS FOR THE NRTL MODEL OBTAINED THROUGH
INDIVIDUAL REGRESSION, (RIGHT) PARAMETERS FOR THE WONG SANDLER MIXING RULES OBTAINED THROUGH INDIVIDUAL REGRESSION ... 107 FIGURE 7-22: P-X PLOTS FOR CO2 (1) + FLUORO-COMPOUND (2) SYSTEMS AT 313.15 K. ... 110 FIGURE A-1: CALIBRATION CHARTS FOR THE TEMPERATURE PROBES. ... 129 FIGURE A-2: ERRORS INDUCED BY THE CALIBRATION POLYNOMIALS FOR THE TEMPERATURE
PROBES. ... 130 FIGURE A-3: PRESSURE CALIBRATION PLOTS. (LEFT) LINEAR CALIBRATION (RIGHT) ERRORS
INDUCED BY THE CALIBRATION POLYNOMIAL. ... 131
xiii | P a g e
List of Tables
TABLE 2-1: PHYSICAL PROPERTIES OF INDUSTRIAL ABSORPTION SOLVENTS. ADAPTED FROM
BUCKLIN AND SCHENDEL (1984). ... 8
TABLE 2-2: SELECTIVITY OF DIMETHYL ETHERS. ADAPTED FROM ZAWACKI ET AL. (1981). ... 11
TABLE 2-3: PHYSICAL PROPERTIES OF SOME PERFLUOROCARBONS. ADAPTED FROM BANKS ET AL. (1994). ... 13
TABLE 2-4: PHYSICAL PROPERTIES OF THE STUDIED CHEMICALS.... 16
TABLE 3-1: A SUMMARY OF MODERN STATIC ANALYTIC APPARATUS. ... 23
TABLE 3-2: A SUMMARY OF VISUAL STATIC SYNTHETIC APPARATUS. ... 25
TABLE 5-1: GC OPERATING CONDITIONS FOR THE SHIMADZU GAS CHROMATOGRAPH (GC-2010). 41 TABLE 5-2: CONSTITUENTS OF THE MIXTURES AND HILDERBRAND SOLUBILITY PARAMETER RANGES FOR THE RESPECTIVE CHEMICAL SPECIES. ... 44
TABLE 6-1: CHARACTERISTICS OF ALPHA FUNCTIONS. ADAPTED FROM (YOUNG ET AL., 2016). .... 58
TABLE 6-2: ASPEN VLE REGRESSION PROCEDURE. ... 64
TABLE 7-1: SUPPLIER AND PURITIES OF CHEMICALS USED IN THIS STUDY. ... 67
TABLE 7-2: DENSITY AND REFRACTIVE INDICES FOR THE CHEMICALS USED IN THIS STUDY. ... 68
TABLE 7-3: VAPOUR PRESSURE DATA FOR CARBON DIOXIDE. ... 75
TABLE 7-4: VAPOUR PRESSURE DATA FOR 1,1,2,2-TETRAFLUOROETHYL 2,2,3,3- TETRAFLUOROPROPYL ETHER. ... 76
TABLE 7-5: ABSOLUTE AVERAGE RELATIVE DEVIATIONS (AARD), AVERAGE ABSOLUTE DEVIATION (AAD) AND BIAS FOR THE VAPOUR PRESSURE DATA. ... 77
TABLE 7-6: MATHIAS –COPEMAN PARAMETERS FOR THE COMPONENTS USED IN THE STUDY. ... 77
TABLE 7-7: EXPERIMENTAL AND REGRESSED VLE DATA FOR CARBON DIOXIDE (1) + HEXANE (2). ... 79
TABLE 7-8: ERROR ANALYSIS FOR THE CARBON DIOXIDE (1) + HEXANE (2) SYSTEM. ... 81
TABLE 7-9: MODEL PARAMETERS FOR THE CARBON DIOXIDE (1) + HEXANE (2) SYSTEM. ... 82
TABLE 7-10: EXPERIMENTAL AND REGRESSED VLE DATA FOR CARBON DIOXIDE (1) + PERFLUOROOCTANE (2). ... 83
TABLE 7-11: ERROR ANALYSIS FOR THE CARBON DIOXIDE (1) + PERFLUOROOCTANE (2) SYSTEM86 TABLE 7-12: MODEL PARAMETERS FOR THE CARBON DIOXIDE (1) + PERFLUROOCTANE (2) SYSTEM. ... 87
TABLE 7-13: EXPANDED COMPOSITIONAL UNCERTAINTIES. ... 88
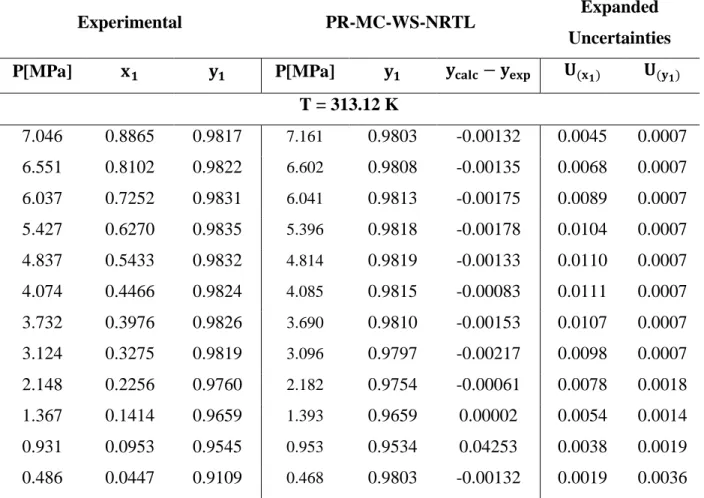
TABLE 7-14: EXPERIMENTAL AND REGRESSED VLE DATA FOR CARBON DIOXIDE (1) + 1,1,2,2- TETRAFLUOROETHYL 2,2,3,3-TETRAFLUOROPROPYL (2). ... 90
TABLE 7-15: ERROR ANALYSIS FOR THE CARBON DIOXIDE (1) +1,1,2,2-TETRAFLUOROETHYL 2,2,3,3-TETRAFLUOROPROPYL ETHER (2) BINARY SYSTEM FOR THE CASE WITH INDIVIDUAL REGRESSED PARAMETERS. ... 92
xiv | P a g e
TABLE 7-16: GLOBALLY AND INDIVIDUALLY REGRESSED PRWS MODEL PARAMETERS FOR THE CARBON DIOXIDE (1) +1,1,2,2-TETRAFLUOROETHYL 2,2,3,3-TETRAFLUOROPROPYL (2) ETHER
SYSTEM. ... 94
TABLE 7-17: ERROR ANALYSES FOR THE CARBON DIOXIDE (1) +1,1,2,2-TETRAFLUOROETHYL 2,2,3,3-TETRAFLUOROPROPYL ETHER (2) SYSTEM FOR THE CASE WITH GLOBAL PARAMETERS. ... 95
TABLE 7-18: EXPERIMENTAL AND REGRESSED VLE DATA FOR CARBON DIOXIDE (1) + PERFLUOROHEPTANE (2). ... 97
TABLE 7-19: ERROR ANALYSIS FOR CARBON DIOXIDE (1) +PERFLUOROHEPTANE (2) BINARY SYSTEM FOR THE CASE WITH INDIVIDUAL REGRESSED PARAMETERS. ... 99
TABLE 7-20: GLOBALLY AND INDIVIDUALLY REGRESSED PRWS MODEL PARAMETERS FOR THE CARBON DIOXIDE (1) +PERFLUOROHEPTANE SYSTEM. ... 101
TABLE 7-21: ERROR ANALYSIS FOR THE CARBON DIOXIDE (1) +PERFLUOROHEPTANE (2) SYSTEM FOR THE CASE WITH GLOBAL PARAMETERS. ... 102
TABLE 7-22: EXPERIMENTAL AND REGRESSED VLE DATA FOR CARBON DIOXIDE (1) + PERFLUORONONANE (2). ... 103
TABLE 7-23: ERROR ANALYSIS FOR THE CARBON DIOXIDE (1) +PERFLUORONONANE (2) SYSTEM GENERATED FROM THE PR-MC-WS-NRTL MODEL FOR THE CASE WITH INDIVIDUALLY REGRESSED PARAMETERS. ... 105
TABLE 7-24: GLOBALLY AND INDIVIDUALLY REGRESSED PRWS MODEL PARAMETERS FOR THE CARBON DIOXIDE (1) +PERFLURONONANE SYSTEM. ... 107
TABLE 7-25: ERROR ANALYSIS FOR THE CARBON DIOXIDE (1) +PERFLUORONONANE (2) SYSTEM FOR THE CASE WITH GLOBAL PARAMETERS. ... 108
TABLE 7-26: HENRY’S LAW CONSTANTS (H) FOR CARBON DIOXIDE IN POLYETHYLENE GLYCOL DIMETHYL ETHERS AT LOW PRESSURE. ADAPTED FROM (RAYER ET AL., 2012). ... 112
TABLE A-1: CALIBRATION POLYNOMIALS FOR PROBES 204 AND 205... 129
TABLE A-2: PRESSURE CALIBRATION POLYNOMIAL. ... 130
TABLE B-1: PURE CARBON DIOXIDE TCD CALIBRATION DATA (250 𝜇L SYRINGE). ... 133
TABLE B-2: CARBON DIOXIDE + HELIUM MIXTURE CALIBRATION DATA (250𝜇L SYRINGE). ... 134
TABLE B-3: CALCULATION OF THE DEVIATION BETWEEN THE PURE COMPONENT AND MIXTURE CALIBRATION POLYNOMIALS. ... 135
TABLE C-1: SAMPLE DATA FOR THE CARBON DIOXIDE (1) + PERFLUORONONANE (2) SYSTEM MEASURED AT AN AVERAGE TEMPERATURE AND PRESSURE OF 273.15 K AND 1.8 MPA. ... 141
Introduction
1 | P a g e
Chapter 1
1 Introduction
The advent of fluorine chemistry and its progressive development ushered in a growing understanding of how the fluorine atom affects the reactivity, structure, and function of fluorine- containing molecules. This development, in turn, has sparked investigations into the properties and applications of perfluorocarbons (PFCs) and other fluorinated compounds (with various functional groups) in diverse fields such as engineering, biochemistry, biophysics, pharmacology and biotechnology. The term perfluorocarbon refers to chemicals which contain only carbon and fluorine atoms, as per the standard in fluorine chemistry (Banks et al., 1994).
As a direct result of the innovations in fluorine chemistry, the Fluorochemical Expansion Initiative (FEI), was launched in 2008 by the South African Government and seeks to establish fluorochemical industries locally. This project falls under the FEI initiative and the DST/NRF South African Research Chairs Initiative (SARChI) in Fluorine Process Engineering and separation technology, based in the Thermodynamics Research Unit (TRU) at the University of KwaZulu-Natal (UKZN). Thus, this work is also aligned with the ethos of generating a database for the thermophysical properties of fluorochemicals, which is useful in the design of separation processes and valuable for knowledge generation.
Various independent studies have demonstrated that compounds containing a fluorinated alkyl segment have a heightened affinity for the dissolution of light gases (Lazzaroni et al., 2005; Dias et al., 2006; Heintz et al., 2008). This is due to the high electronegativity of the fluorine atoms which results in the repulsion between the molecules of the liquid, causing formation of larger cavities within the intermolecular structure of the liquid (Gwinner et al., 2006). However, most data pertaining to the solubility of carbon dioxide in fluorinated compounds consists of binary mixtures of the gas with perfluorocarbons. The ability to dissolve large amounts of light gases is not only inherent to perfluorocarbons but also exists for partial or fully fluorinated chemical species, containing an electron donating functional group (Gui et al., 2011).
Introduction
2 | P a g e 1.1 Dissolution of light gases
Experimental data asserting to the excellent solubility of light gases, particularly carbon dioxide and oxygen in perfluorocarbons has resulted in studies aimed at developing industrial, environmental and clinical applications. These applications include carbon dioxide capture from gaseous waste streams (Pennline et al., 2008), improvement of the solubility of hydrophilic substances in supercritical reaction or extraction media (Raveendran and Wallen, 2002) and the utilisation of PFCs in gas delivery therapeutics (Riess, 2001). The clinical applications, however, are mostly dependent on the inertness of the compounds, which results from the strong electrovalent liaisons formed through the complete substitution of all hydrogen atoms with fluorine. Thus perfluorocarbons are applicable.
1.1.1 Carbon dioxide capture through absorption
The Intergovernmental Panel on Climate Change (IPCC), in their fourth assessment, concluded that most of the increase in global temperatures since the mid -20th century was due to the increase in greenhouse gas emissions from the energy sector (Edenhofer and Sokona, 2011). Thus, there is a consensus on the need to develop reliable energy alternatives that can effectively replace fossil fuels (Dresselhaus and Thomas, 2001; Sims et al., 2003). However, studies indicate that the global energy market will continue to depend on fossil fuels for the next couple of decades (Shafiee and Topal, 2009). In order to mitigate the adverse effects of fossil fuels on the environment, various technologies aimed at reducing the amounts of anthropogenic greenhouse gas emissions are being developed. These technologies include fossil fuel switching, renewable energy, flue gas capture technologies, control of power consumption and nuclear power.
Technologies for flue gas capture are currently the most viable at an industrial scale. These technologies, however, consists of three main pathways which are post-combustion capture, pre- combustion capture, and oxy- combustion capture. Among the three, the post-combustion carbon capture pathway has the highest near-term potential, as it can be retrofitted to most existing power generation units (Figueroa et al., 2008). The separation technology that is most utilised in post- combustion applications at an industrial scale is absorption (Gwinner et al., 2006). Absorption can be employed via a physical or chemical route. Physical absorption is dependent on the solubility of the gaseous effluent within the extraction solvent. Thus its extraction mechanism is in line with
Introduction
3 | P a g e the work that was performed in this project. Consequentially, only processes utilising physical absorption are reviewed in this study.
The physical absorption processes currently most utilised at an industrial scale are the SELEXOL and RECTISOL processes, and these make use of the mixtures of Poly(ethylene glycol)dimethyl ether and refrigerated methanol, respectively (Kohl and Nielsen, 1997). These processes can only be effectively utilised in syngas treatment, where the gas stream is at high pressure, which varies between (4−5.5) MPa, depending on the type of gasifier used (Heintz et al., 2008). The RECTISOL technology can be classified as a cold gas clean-up technology since the entire syngas stream is cooled to temperatures in the range of (211 - 272) K prior to hydrogen sulphide and carbon dioxide removal (White et al., 2003). The cooling, however, results in a drastic reduction of thermal efficiency in the processes due to condensation of most of the water vapour present within the syngas, thus increasing the capital cost of the technology.
The major drawback of cold gas clean-up technologies has resulted in a pressing need for the development of what are termed warm gas clean-up technologies. Such technologies are being developed with the capability of operating at moderate temperatures of approximately 500 K, in order to produce a syngas stream that can be effectively utilised in downstream processes (e.g., Fisher−Tropsch) (Heintz et al., 2008). However, the work done herein pertaining to the solubility of carbon dioxide was conducted at mild temperatures which are in the working range of the SELEXOL process, which has a maximum working temperature of 448.15 K (Kohl and Nielsen, 1997).
1.2 Overview of the study Aim
To analyse the solubility of carbon dioxide in three fluorinated chemicals, which are perfluoroheptane, perfluornonane and 1,1,2,2-tetrafluoroethyl-2,2,3,3-tetrafluoropropyl ether by way of high-pressure vapour-liquid equilibrium (HPVLE) measurements, for the purpose of proposing a potential solvent family for integrated gasification combined cycle (IGCC) waste gas treatment through the physical absorption route.
Introduction
4 | P a g e Objectives
Measurement of two binary test systems comprising of carbon dioxide in conjunction with the liquids hexane and perfluorooctane at temperatures of 313.15 K and 293.15 K respectively. The purpose of the test system measurement was to allow the experimentalist to develop a sound technique before embarking on the core measurements.
The measurement of three novel binary systems comprising of carbon dioxide in conjunction with the fluorinated liquids perfluoroheptane, perfluorononane and 1,1,2,2 – tetrafluoroethyl 2,2,3,3-tetrafluoropropyl ether, measured at the isotherms (273.15 K, 293.15 K and 313.15 K) for each binary pair.
Modelling of all experimental data using Aspen Plus V8.4 through the use of suitable thermodynamic models.
Benchmarking the carbon dioxide absorption capabilities of the fluorinated compounds against those of an industrial solvent.
In this dissertation, the introductory chapter is succeeded by a literature review of the physical absorption solvents which are used in industrial processes, including an analysis of the attributes which make the solvents ideal for gas cleaning applications. The mechanisms which facilitate the dissolution of carbon dioxide in the most prominent of these solvents are also discussed. The second chapter also includes an analysis of the physical properties of fluorinated compounds in conjunction with published HPVLE data of carbon dioxide in fluorinated compounds.
The third chapter focuses on a brief but concise review of HPVLE equipment based on the extensive reviews of most HPVLE equipment configurations developed over the years. The description of the static analytic and static synthetic apparatus which were used in this work is published in the fourth chapter, while the experimental procedures used are comprehensively outlined in the fifth chapter.
The sixth chapter deals with thermodynamic modelling, with emphasis on the explanation of the rationale behind the selection of each thermodynamic correlation/model. The procedure used to carry out the regression of VLE experimental data is also aptly outlined in this chapter.
The experimental results generated in this work (purity tests, calibration data, vapour pressure data and VLE data) are analysed and discussed in the seventh chapter, including the comparison of
Introduction
5 | P a g e carbon dioxide absorption capabilities of fluorinated compounds against those of an industrial solvent. The last chapter, which is the eighth chapter concludes the work in conjunction with the recommendations.
Literature review
6 | P a g e
2 Review of solvents for carbon dioxide physical absorption
2.1 Introduction
This chapter provides a review of solvents which are/may be used in the absorption of carbon dioxide through the physical absorption route. As was highlighted in the preceding chapter, some industrial applications have been developed which rely on the dissolution capabilities of carbon dioxide. However, the scope of the work carried out in this project focused primarily on reviewing the viability of three fluorinated compounds as potential solvents in carbon dioxide capture. Thus solvents used in the most prominent industrial physical absorption processes were also examined including the key characteristics necessary for the selection of an absorption solvent. Carbon capture processes were not discussed in this study, thus for concise information on the subject the reader is directed to the works of Bucklin and Schendel (1984), Olajire (2010) and Zaman and Lee (2013).
2.2 Characteristics of a suitable absorption solvent
The use of physical solvents in gas cleaning processes began to rise after the inception of the Fluor process in 1960. This technology utilised propylene carbonate as the absorption solvent in a relatively straightforward design scheme (Bucklin and Schendel, 1984). As a result, a number of processes have been developed, all using different solvents. However the search for superior solvents is still ongoing, but it is marred by the very nature of the screening process, which is expensive and time-consuming (Henni et al., 2005).
In order to validate the viability of a new solvent for carbon capture, the respective solvent should be benchmarked against already established solvents. Table 2-1 lists physical absorption processes, including the physical properties of the solvents used in each process. The RECTISOL process which uses methanol as the capture solvent was not included in the list by virtue of the liquids high vapour pressure at normal capture conditions, which makes its comparison with other processes difficult (Bucklin and Schendel, 1984). A number of studies have been conducted which focused on the comparison of various physical absorption processes, with the emphasis being on the entire process at large (Bucklin and Schendel, 1984; Doctor et al., 1993; Burr and Lyddon, 2008).
Chapter 2
Literature review
7 | P a g e However, the study herein focused primarily on the characteristics of the solvents, particularly their carbon dioxide dissolution capability, thus the study of Zawacki et al. (1981) was used to stream-line the industrial solvents to be discussed, to avoid redundancy.
8 | P a g e Table 2-1: Physical properties of industrial absorption solvents. Adapted from Bucklin and Schendel (1984).
PROPERTIES PROCESS
SELEXOL Fluor Purisol Sepasolv Estasolvan
Solvent name SELEXOL Propylene carbonate N-methyl -2-
pyrrolidone Sepalov Tributyl
phosphate
Licensor Dow Fluor Lurgi B.A.S.F Uhde & IFP
Viscosityc, Pa.s 0.006 0.003 0.002 - 0.002
Specific gravity 1030 1195 1027 - 973
Molecular weight 280 102 99 320 266
Vapour pressurec , mMPa 0.000097 0.0113 0.0533 0.000049 <0.001
Freezing point (K) 245.15 225.15 249.15 - 193.15
Boiling point, (K), 760 mm 𝐇𝐠 - 513.15 475.15 593.15
(453.15, 30 mm Hg
Thermal conductivity (𝐊𝐖/𝐦𝐊) 0.0001 0.0002 0.0001 - -
Maximum operating temperature
(K) 448.15 338.15 - 448.15 -
Specific heatc 0.49 0.339 0.40 - -
Water solubilityc ∞ 94 gm/l ∞ ∞ 65gm/l
Molar solubility of carbon dioxide
(K) a 0.76b 1.56 1.24 - -
Selectivity of 𝐊𝐂𝟐𝐇𝟔/𝐊𝐂𝐎𝟐a 2b 3.34 2.55 - -
a (Zawacki et al., 1981)
b Values for Dimethyl Ether of Tetraethylene glycol were used, which is a component of the SELEXOL solvent cTemperature dependent parameters were determined at 298.15 K
Literature review
9 | P a g e For a solvent to be deemed an economically viable option for flue gas cleaning, it should meet a specific criterion which hinges on economic, performance and environmental factors. Brief descriptions of the criterion above and its efficacy on the design of separation processes are highlighted below:
Low viscosity – This property of the fluid should be low, (approximately 0.006 Pa.s) at the lower end of the operating temperature range in the capture process to be employed (Higman and van der Burgt, 2003). High viscosity would result in adverse effects on the equipment, particularly pumping systems through the reduction of flow rate, head pressure and brake horsepower, leading to an increase in operating costs.
Thermal stability- The solvent of choice should not thermally decompose at the specified capture conditions. This degradation would result in the formation of unrequired substances which could be hazardous when emitted into the atmosphere and most likely lead to an increase in operating costs due to the excessive loss of solvent.
Non-corrosive - This is a rule of thumb for any design process, such that the material of construction for all process equipment and piping should be compatible with the solvent to be used.
Vapour pressure –The vapour pressure of the solvent should be negligible at the flue gas capture conditions. This will then prevent the loss of large amounts of the solvent in the regeneration step.
Absorption Capability - For practicality, the solvent used in a carbon dioxide capture process should have an equilibrium capacity for acid gases which is substantially larger than that of water and a low capacity for the main constituents of the gas stream, which can be hydrocarbons. The high capacity for carbon dioxide by the solvent will allow the process to effectively use the least amount of solvent possible for circulation.
Global warming potential (GWP) - This is a measure which quantifies the ability of a molecule to affect the climate, and is evaluated through the use of the molecules lifetime in conjunction with its radiation absorption capabilities (Good et al., 1998). Thus absorption solvents should ideally have very low or negligible GWPs since some interaction of the solvent with the environment is bound to occur primarily during the regeneration step of the process.
Literature review
10 | P a g e The cost of solvent – This is also a rule of thumb for any design process since the operation of the process has to be economically feasible. The cost of the solvent thus should not be excessive, which is a principle that applies to the entire process at large.
2.3 Industrial solvent
The study conducted by Zawacki et al. (1981) was the most robust solvent screening study conducted thus far and resulted in the screening of more than a hundred solvents, which eventually led to the selection of N-formyl morphine (NFM) and dimethyl ether of tetraethylene glycol (DMETEG). Krupp Uhde GmbH later licensed the former in 1997, while the latter is one of the dimethyl ethers that constitute the SELEXOL solvent (Henni et al., 2005). Due to its unparalleled industrial success in gas cleaning applications involving physical absorption, particularly in sweetening flue gases from integrated gasification combined cycle (IGCC) processes, the SELEXOL solvent is aptly discussed in the section that follows.
SELEXOL solvent
Before the advent of the SELEXOL process, polyethylene glycol ethers were studied and noted to exhibit attributes which made the substances ideal candidates for gas sweetening applications (Kutsher and Smith, 1968). These substances, however, were noted to be affected by disadvantages such as high volatility which would inevitably result in high solvent loss during operation. Heavier homologues of the substance were also not viable substitutes regardless of their low volatility, due to the high viscosities which are inherent in the compounds (Ameen and Furbush, 1971).
The SELEXOL solvent was thus developed through the mixing of dimethyl ethers of polyethylene glycols [CH3(CH2CH2O)nCH3], where n is in the range (3−9). The exact amounts of each homologue are proprietary information. However, the mixing was performed in such a manner that the vapour pressure and viscosity of the resulting mixture did not exceed 0.0013 mMPa and 0.0088 Pa.s respectively at temperatures up to 316.15 K (Ameen and Furbush, 1971). In order to further lower the viscosity of the mixture to a range between (0.001−0.005) Pa.s, one weight percent of carbon dioxide is initially dissolved into the liquid before its use in the process.
The carbon dioxide solvation mechanism of the SELEXOL solvent makes use of the ether functional group. The presence of these groups throughout the molecular structure of the complex
Literature review
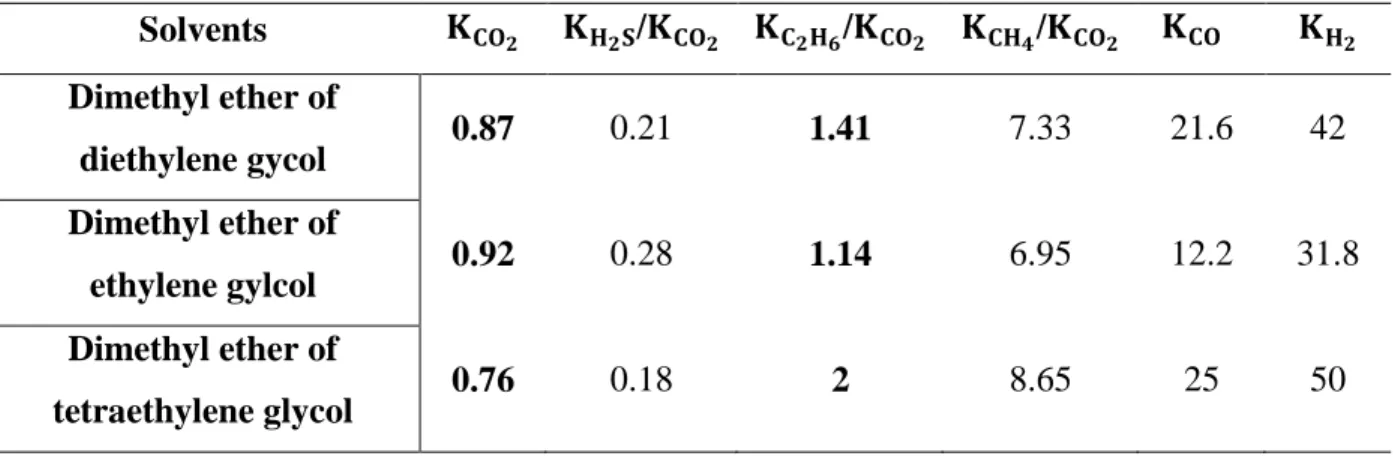
11 | P a g e liquid results in sites where Lewis acid−Lewis base reactions can occur, which enhance the solubility of the gas within the liquid (Hanson, 2001; Miller et al., 2010). Dimethyl ethers have also been noted to have near negligible GWPs (Good et al., 1998), signifying that the SELEXOL solvent does not negatively affect the global climate. The high solubility of carbon dioxide in the dimethyl ethers can also result in some adverse effects, as was shown in the work of Zawacki et al. (1981). The aforementioned study highlighted that as the molar solubility of carbon dioxide in the dimethyl ethers increased (which is shown by the low KCO2 values), the selectivity of removing the gas from hydrocarbons was reduced, as emphasised by the low values for the ratio of (KC2H6/KCO2) in Table 2-2.
Table 2-2: Selectivity of dimethyl ethers. Adapted from Zawacki et al. (1981).
Solvents 𝐊𝐂𝐎𝟐 𝐊𝐇𝟐𝐒/𝐊𝐂𝐎𝟐 𝐊𝐂𝟐𝐇𝟔/𝐊𝐂𝐎𝟐 𝐊𝐂𝐇𝟒/𝐊𝐂𝐎𝟐 𝐊𝐂𝐎 𝐊𝐇𝟐 Dimethyl ether of
diethylene gycol 0.87 0.21 1.41 7.33 21.6 42 Dimethyl ether of
ethylene gylcol 0.92 0.28 1.14 6.95 12.2 31.8 Dimethyl ether of
tetraethylene glycol 0.76 0.18 2 8.65 25 50
The solvent also has high miscibility with water, which impedes the absorption of carbon dioxide in an IGCC capture process (Miller et al., 2010). For the sake of gas cleaning process efficiency, new physical solvents are constantly screened and studied such as fluorinated compounds and ionic liquids in a bid to develop better performing solvents (Pennline et al., 2008).
2.4 Fluorinated solvents
The once-unusual behaviour of fluorinated compounds has become seemingly easier to comprehend due to the advancement of experimental and theoretical organic fluorine chemistry in the past two decades (Banks et al., 1994). This, in turn, has sparked numerous commercial applications for the substances, some of which are currently being thoroughly investigated, such as their potential use in gas cleaning applications. The following sections analyse the compound’s
Literature review
12 | P a g e gas dissolution capabilities, physical properties and published VLE binary data with carbon dioxide.
Solubility of carbon dioxide
The addition of fluorine atoms in the molecular structure of a compound has been shown to result in the reduction of its polarisability/solubility parameter value (Hoefling et al., 1992). This reduction enhances the solubility of carbon dioxide in fluorinated compounds since the gas also has a relatively low solubility parameter value, which is similar to the values of most fluorinated compounds. The correlation developed by Hansen (1967) highlighted the need for a small difference between the solubility parameters of the solute and solvent in order for the solute to be highly soluble in the solvent. This assessment was based on the fact that solubility parameters are a function of the cohesive energy density of the molecules of the compound, which in turn is a direct indication of the degree of van der Waals forces holding the molecules of the compound together (Burke, 1984). This then means that if two compounds have similar solubility parameter values/ cohesive energy densities, then the molecules of one compound will be able to separate molecules of the other and vice versa, thus allowing solubilisation of the solute to occur. The cohesive energy densities between the molecules in PFCs are approximately half those of their hydrocarbon counterparts (Barton, 1983). The aforementioned comparison is shown in Table 2-3.
The actual mechanism that occurs in the solubilisation of a solute was postulated by Gwinner et al. (2006). This study asserted that two thermodynamic steps characterise the absorption of a solute in a solvent. The initial step in the sequence involves the formation of cavities within the solvent through shearing of solvent-solvent interactions, which is energy dependent, thus rendering the step endothermic. This step, however, is made easier in fluorinated compounds due to the high ionisation potential and low polarisability of the fluorine atom, which results in relatively weak intermolecular forces within the compound (Ducheyne et al., 2015), thus resulting in lower solubility parameters, as stated above. The final step in the sequence involves the insertion of the solute molecule within the cavities of the solvent, which is an exothermic process that is dependent on the solute–solvent interactions that are created (Gwinner et al., 2006).
Physical properties
Besides the ability of imbuing compounds with greater gas solvation capabilities, fluorination also enhances physical properties of the respective compounds. Numerous studies attest to the effect of
Literature review
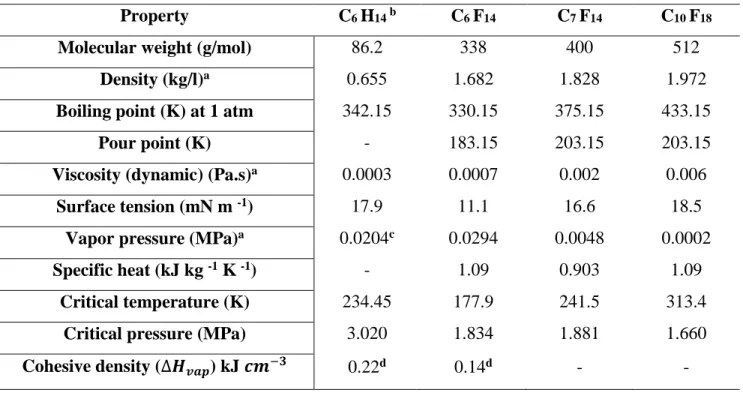
13 | P a g e fluorination on the physical properties of compounds, and this has mostly been achieved through the comparison of PFCs with their hydrocarbon counterparts (Maciejewski, 1990; Banks et al., 1994). Herein, only physical properties which affect the compounds ability to effectively function as an absorption solvent are discussed. Table 2-3 displays the physical properties of some fluorinated hydrocarbons. The list is non-exhaustive and serves to highlight the variation of physical properties when a hydrocarbon is fluorinated and the effect of chain length on the respective properties.
Table 2-3: Physical properties of some perfluorocarbons. Adapted from Banks et al. (1994).
Property C6 H14 b C6 F14 C7 F14 C10 F18
Molecular weight (g/mol) 86.2 338 400 512
Density (kg/l)a 0.655 1.682 1.828 1.972
Boiling point (K) at 1 atm 342.15 330.15 375.15 433.15
Pour point (K) - 183.15 203.15 203.15
Viscosity (dynamic) (Pa.s)a 0.0003 0.0007 0.002 0.006 Surface tension (mN m -1) 17.9 11.1 16.6 18.5
Vapor pressure (MPa)a 0.0204c 0.0294 0.0048 0.0002 Specific heat (kJ kg -1 K -1) - 1.09 0.903 1.09
Critical temperature (K) 234.45 177.9 241.5 313.4 Critical pressure (MPa) 3.020 1.834 1.881 1.660 Cohesive density (∆𝑯𝒗𝒂𝒑) kJ 𝒄𝒎−𝟑 0.22d 0.14d - -
a Temperature dependent parameters were determined at 298.15 K b (Maciejewski, 1990)
C(Carruth and Kobayashi, 1973) d (Robb, 2012)
The vapour pressure of fluorinated compounds is an important parameter as it governs the tendency of the compound to disseminate into the environment (Stock et al., 2004). The vapour pressures of PFCs are similar to those of their analogous hydrocarbons because both substances have no permanent molecular dipole moment. Thus the molecular attractive forces which contribute to the pressures are the Van der Waal forces. For both hydrocarbons and PFCs, the vapour pressures decreases with an increase in molecular weight, viz., carbon chain length, which
Literature review
14 | P a g e is an expected trend. However, the vapour pressures of PFCs displayed in Table 2-3 are substantially higher than those of industrial solvents such as the SELEXOL solvent, which has a vapour pressure of 0.00009 mMPa at 298.15 K. This then means that there is a higher chance of solvent loss during the regeneration step if pure fluorinated compounds are used in gas cleaning applications. This could have adverse effects on the environment if the fluorinated compounds in question are PFCs since these have been noted to have long life times and also absorb relatively larger amounts of longwave radiation (Zhang et al., 2011), which translates to large GWP values.
However, hydrofluoroethers, on the other hand, have significantly lower GWP values due to the ether functional group, which has been observed to reduce the molecular lifetime of compounds (Lazarou and Papagiannakopoulos, 1999).
Fluorinated compounds, particularly the compounds which have undergone complete substitution have been noted to exhibit high thermal and chemical stability. These properties are a function of the carbon-fluorine single bond, which is the strongest bond ever observed in organic chemistry thus far (Stock et al., 2004). Another unique feature of fluorinated compounds which has been postulated to enhance its thermal and chemical stability is their peculiar molecular geometry. The structure of fluorinated compounds changes as the carbon chain increases from a zigzag structure to one which is partly zigzag and helical when the chain length exceeds ten carbon atoms (Wang and Ober, 1999). This shift in the structure is due to the fact that the fluorine atom is larger than the hydrogen atom, thus saturated fluorination results in a compound with a rigid structure (Stock et al., 2004). In order to avoid steric hindrance, the structure of the compounds thus changes with size.
Solvents which are used in gas cleaning applications should ideally be insoluble in water, which in turn would allow the solvents to absorb large amounts of the desired waste gas constituents.
Fully fluorinated compounds are inherently insoluble in most liquids including water, with the exception of low chain hydrocarbons (Simons, 2012). The viscosity of the solvent is also an important characteristic as has been mentioned in the preceding section. Since fluorination results in rigid molecular structures, it stands to reason that the viscosity of a fluorinated compound will be greater than that of its hydrocarbon counterpart. Though the viscosities of low chain fluorinated compounds, particularly PFCs are lower than those of industrial absorption solvents, higher chain
Literature review
15 | P a g e PFCs have been shown to have viscosities which are substantially higher than the SELEXOL solvent (Heintz et al., 2008).
2.5 Physical properties of the chemicals of interest
As was stated in the preceding chapter, the study focused on the use of three chemicals, two perfluorocarbons, and one partially fluorinated ether. The choice of chemicals was dependent mostly on their availability, but the focal point was in utilising fluorinated compounds with different functional groups since it has been postulated that the functional group can act to enhance or impede the solubilisation of carbon dioxide (Gui et al., 2011). The chemicals that were eventually studied were perfluoroheptane, perfluorononane, and 1,1,2,2-tetrafluoroethyl 2,2,3,3- tetrafluoropropyl ether. VLE data were measured at three isotherms for all the binary pairs at the temperatures (273.15, 293.15, 313.15) K, with maximum pressures of approximately 7.5 MPa.
Table 2-4 highlights the physical properties of the chemicals of interest.
16 | P a g e Table 2-4: Physical properties of the studied chemicals.
Molecular formula 𝐂𝟕𝐅𝟏𝟔 𝐂𝟗𝐅𝟐𝟎 𝐂𝟓𝐇𝟒𝐅𝟖𝐎
Main molecular species Perfluoroheptane Perfluorononane
1,1,2,2-Tetrafluoroethyl 2,2,3,3- tetrafluoropropyl ether
Structure
Molecular weight (kg k mol-1 )b 388.04 488.06 232.07
Density (kg m-3 )a 1731.3 1799.9 1538
Boiling point (k) at 1 atmb 353.15 - 358.15 398.15 - 399.15 366.35
Viscosity (dynamic) (pa s)b 0.00093 0.0017 0.0011
Surface tension (n m-1 )b 9.15 18.1 -
Vapour pressure (mMPa)b 10.4 2.596 5.643a
Heat capacity (j/kmol-k)b 418497.3 478653.7 292850.8
Critical temperature (k)b 474.85 523.97 510.07
Critical pressure (MPa)b 0.162 0.156 0.258
Thermal conductivity (wm-1 k-1)b 0.063 0.01 0.059
Refractive indexa 1.261 1.274 1.290
a Exp data b Nist data
Temperature dependent parameters were determined at 298.15 K, except the experimental data, which was measured at 293.15 K.
Literature review
17 | P a g e A preliminary comparison of the chemicals of interest against the SELEXOL solvent reveals that the vapour pressures of the former are substantially larger than those of the latter. This would imply a relatively large possibility of incurring solvent loss during the regeneration step if the fluorinated solvents in question were to be used in an absorption process. However, this disadvantage can be overcome through the formulation of mixtures using various homologues of the fluorinated compounds, which in turn would result in a mixture with lower vapour pressure (Heintz, 2012). The viscosities of the fluorinated compounds are ideal, all being substantially below that of the SELEXOL solvent as can be seen in the data tabulated in Tables 2-1 and 2-4.
Other attributes of the chemicals of interest which make them potential flue gas absorption solvents were discussed in the preceding sections of this chapter. A concise explanation of the mechanisms at work is discussed in Chapter 7.
2.6 Published VLE data for carbon dioxide + fluorinated compounds
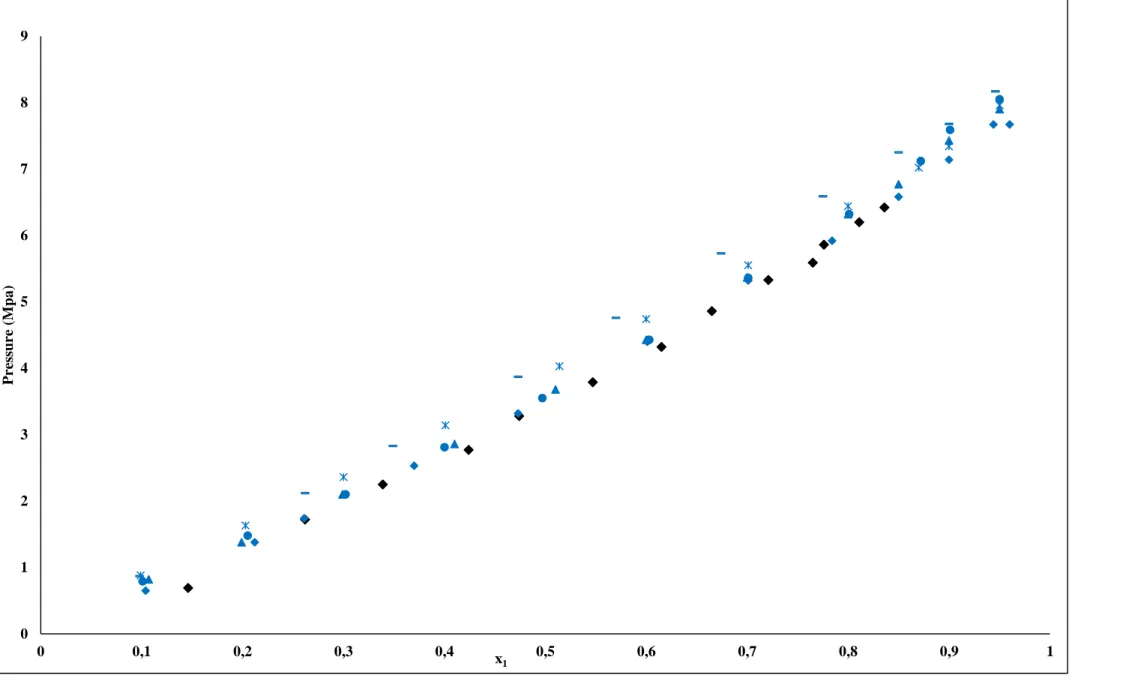
The data pertaining to carbon dioxide solubility in fluorinated compounds which are currently available in the open literature focus only on fully fluorinated hydrocarbons. Thus the mechanism of absorption utilised is similar throughout the different studies since the only difference between the studied PFCs is chain length and structural geometry. Figure 2-1 displays a P-x chart which features binary data for carbon dioxide with the following PFCs perfluoro-hexane (C6F14), perfluoro-benzene (C6F6), perfluoro-toluene (C7F8), perfluoro-methylcyclohexane (C7F14), perfluoro-octane (C8F18) and perfluorodecalin (C10F18). All the data in Figure 2-1 was measured using the synthetic technique at 313.15 K, thus a direct comparison could be undertaken.
18 | P a g e .
Figure 2-1: P-x plots for CO2 (1) + fluoro-compound (2) systems at 313.15 K. (a) Lazzaroni et al. (2005):(◆) C6F14, (b) Dias et al. (2006): (◆) C8F18, (▲) C6F6, (●) C7F8, (*) C7F14 and (—) C10F18.
0 1 2 3 4 5 6 7 8 9
0 0,1 0,2 0,3 0,4 0,5 0,6 0,7 0,8 0,9 1
Pressure (Mpa)
x1
Literature review
19 | P a g e From the data displayed in Figure 2-1, it is evident that the structure of PFCs has an effect on their carbon dioxide solubilisation capabilities. Straight chain and aromatic PFCs are noted to absorb similar amounts of carbon dioxide at 313.15 K, while cyclic PFCs displayed the least capability for dissolving the gas. The interaction of carbon dioxide with the PFCs is noted to result in a slight positive deviation from Raoult’s law, as highlighted by the near linear geometry of the various P- x plots in Figure 2-1. The carbon dioxide + perfluorohexane binary system which was measured by Lazzaroni et al. (2005) was modelled using the Patel–Teja equation of state in conjunction with Mathias–Klotz–Prausnitz mixing rules, whilst the data measured by Dias et al. (2006) was described using the soft statistical associating fluid theory equation of state.
Equipment review
20 | P a g e
Chapter 3
3 Equipment review
High-pressure vapour-liquid equilibrium (HPVLE) measurement is a highly developed field, dating back as far as the 19th century (Cagniard de La Tour, 1822). Since inception, the study has been marked by the development of numerous equipment configurations and experimental techniques. These have been further enhanced over the years, in a bid to make the inherently difficult process less cumbersome and more efficient. This development has, in turn, sparked an increase in publications relating to high-pressure phase equilibria, particularly in the last 30 years, for applications relating to carbon dioxide capture, hydrate formation, supercritical fluids, and polymer forming processes (Dohrn et al., 2012).
The two main classes of experimental techniques which are employed in HPVLE measurements can be categorised based on the manner in which the composition in each phase at equilibrium is determined and also the mechanism used to hasten the stasis. The latter can be achieved either through the internal agitation of the cell components (static) or the circulation of one of the phases (dynamic). However, the classification based on the agitation mechanism is not further explored as it has no clear reference to characteristic error sources (Dohrn et al., 2012). Therefore the composition of phases in equilibrium can be determined in one of two ways which are through the synthesis of a mixture of known compositions by either weighing the components prior to charging the cell or the loading of predetermined volumes of each component. The second pathway relies on the analyses of samples from each phase when equilibrium has been reached. This analyses can be achieved through the withdrawal of samples which can be thereafter analysed by gas chromatography (GC) or by use of gravimetric or spectroscopic methods. The variations in these two main pathways are depicted in Figure 3-1.
Equipment review
21 | P a g e Figure 3-1: Classification of experimental techniques for high-pressure phase equilibrium measurements.
Adapted from Dohrn et al. (2012).
Extensive information has been published by various authors reviewing HPVLE experimental techniques, spanning over a hundred years. Some authors compiled information for a specific period, the earliest being Knapp (1982), who reviewed techniques from (1900-1980), followed by Fornari et al. (1990) who covered the (1978-1987) period. Dohrn and Brunner (1995) covered (1988-1993), whilst Christov and Dohrn (2002) pulled the curtain over the 20th century by reviewing the techniques used in the (1994-1999) period. The techniques used in the 21st century thus far have been examined for only the first eight years of the new millennium by Dohrn et al.
(2012) from (2000-2004) and lastly Fonseca et al. (2011) for the (2005-2008) period. In light of the information which has been compiled over the years by various authors, including members of the Thermodynamics Research Unit, this chapter, therefore, reviews the operation of the isothermal analytical method which uses sampling and the synthetic visual method with phase transition as these were employed in this particular study. This was done in order to avoid any redundancy in the work. The reader is therefore directed to the works mentioned above for an aptly discussed analysis of most if not all VLE equipment configurations.
Equipment review
22 | P a g e 3.1 Analytic-Isothermal methods with sampling
As the name implies, this technique operates by utilising a sampling mechanism to withdraw samples from the phases present after equilibrium has been reached. Prior to sampling, the mixture is allowed to reach isothermal conditions while the other properties such as pressure and composition will naturally vary depending on the temperature. This technique can either be dynamic or static depending on the agitation mechanism employed as highlighted above.
Equipment which uses this method of operation function based on three main stages, which are:
Loading of the equilibrium cell
Facilitation of the cell contents to equilibrate
Sampling of each phase after equilibrium has been attained
The most crucial stage is the sampling. If this is not done appropriately, a pressure drop might occur within the cell, which will, in turn, alter the equilibrium conditions. In order to avoid this various sampling mechanisms have been developed, which ensure minimal disturbance to the cell contents during sampling, such as capillaries (Yu et al., 2006) and high precision sampling equipment such as the Rapid Online Sampler Injector (ROLSI TM) (Guilbot et al., 2000). Prior to the advent of sampling equipment that could sample minute amounts, large equilibrium cells were mostly used to avoid any pressure drop. A static version of this technique, with a 18 cm3 equilibrium cell was utilised in this study because of its ability to provide a complete characterisation of the phase behaviour of a vapour liquid system (Williams-Wynn, 2016), and also due to the smaller amounts of chemicals, the apparatus utilises. A non-exhaustive list of static analytical apparatus which have been reported in the open literature in the last decade is tabulated in Table 3-1. The list also includes a synopsis on the equipment description of these relatively modern apparatus. While the most recent novel design presented is dated 2011, to the best of the author’s knowledge, equipment presented in the published literature since then have been variations or modifications of the experimental designs presented in the table.