The neotropical, semi-woody perennial shrub Chromolaena odorata (L.) King and Robinson (Asteraceae: Eupatorieae) has become a seriously invasive weed in the subtropical regions of southern Africa, resulting in the initiation of an insect biocontrol research program at Cedara in KwaZulu Province Natal. In an attempt to identify possible causes of death, plants were grown on elevated grids in two trials; (winter-spring 2003) and (autumn-winter 2004) in Durban (subtropical area, within the natural range of C. odorata) and Cedara (temperate area, outside the natural range). Plants established at all sites in Trials 1 and 2 showed no visual symptoms associated with mortality; However, results from Trial 1 indicated that plants grown in a tunnel in Cedara were physiologically stressed, evidenced by lower transpiration rates despite higher vapor pressure deficits, compared to plants grown in a tunnel in Durban.
If the work of others has been used, this is duly acknowledged in the text.
ACKNOWLEDGEMENTS
Staff at the Soil Fertility and Analytical Services Division, plant and feed laboratories, KZN-DoA for providing the results of foliar nutrient and TNC analyses, and staff at the Pathology Laboratory, KZN-DoA for pathogen analysis results. Colleagues at the ARC-PPRI, Weed Division at Cedara: Derrick Nkala for grinding all the root and stem samples in such a timely manner and Lynnet Khumalo for helping with culture maintenance of Calycomyza eupatorivora (chromolaena biocontrol agent) in my absence. Many thanks to the friendly staff at the Faculty of Natural Sciences, UKZN (Howard College campus) for their administrative efficiency.
Thank you so much for making me feel like a student again and very much part of the UKZN team.
LIST OF ABBREVIATIONS
INTRODUCTION
- Origin and Distribution
- Growth characteristics
- Spread to the Old World Tropics and Sub-tropics
- Chromolaena odorata in South Africa
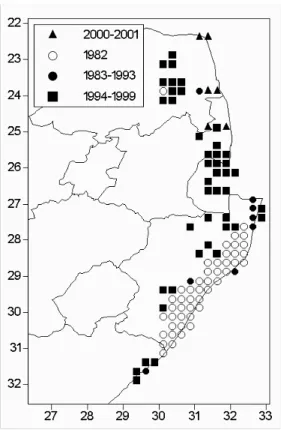
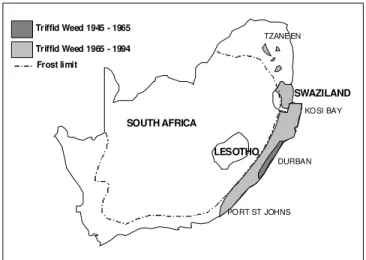
- Introduction and Distribution
- Management and Control
- Plant growth problems encountered
- Attempted solutions towards growing healthy potted plants (1998-2002)
- Study objectives
The family Asteraceae (formerly Compositae) is one of the largest and highly developed plant families, consisting mainly of dioecious herbs and shrubs, many of which are widespread weeds (Bennett & Rao, 1968; Wells & Balsinhas et al., 1986; McFadyen, 1988; McFadyen, 1991; Cronk & Fuller, 1995). A major advantage of perennials (e.g. C. odorata) and a key survival strategy is the total reserves of non-structural carbohydrates (TNC) stored in the roots, which allow the plants to survive disturbance and winter (Kozlowski, 1992; Ikuenobe & Ayeni, 1998). ). Chromolaena odorata has abundant multi-thicket branching resulting from removal or suppression of the top shoot, resulting in dense stands or thickets that suffocate native vegetation (Pancho & Plucknet 1971; Sajise et al., 1974; Holm et al., 1977; Erasmus , 1986; McFadyen, 1989; Goodall & Erasmus, 1996).
An overhead misting system was installed in the cold house to cool leaves when air temperatures reached 32 oC or higher and a plastic dome was erected over part of the cold house to C.

MATERIALS AND METHODS
- GENERAL TECHNIQUES
- Plant propagation and study sites
- Plant maintenance
- Transpiration measurements and vapour pressure deficit (VPD)
- Chlorophyll fluorescence measurements
- Pigment composition
- Harvesting, sorting and drying
- Biomass accumulation and growth analysis
- TNC analysis
- Leaf nutrients
- Structure of C . odorata stems and roots
- Statistical analyses
- EXPERIMENTS CONDUCTED
- Trial 1 (winter-spring)
- Trial 2 (autumn-winter)
- Fungicide trial and fertiliser treatments
- Spacing and drainage trial
- TNC analysis of unhealthy C . odorata stock plants
- Redox potential of the soil of C . odorata stock plants
Pots were placed in plastic bags (62 cm by 35 cm) and tied to the base of the plant with rubber bands to prevent soil evaporation. Comparisons were made between plants grown from August to October 2003 in the tunnels at Cedara and in Durban. Plant height was measured from the base of the plant (at the soil surface) to the tip of its highest apical shoot.
100 µl of the supernatants from parts I and II of the extraction were initially transferred to test tubes, filled up to 5 ml with glucose oxidase dye solution and incubated in a water bath for 15 min at 40 oC. Concentration of the supernatants from parts I and II was obtained from the standard glucose curve. The amount of water transpired per plant, was determined by lysimetry and this was related to the vapor pressure deficit in the microhabitat in which the plants were kept.
By visual assessment, we selected 16 healthy plants of the same physiological age and divided them into two groups. All plants were evenly spaced and placed on the floor of the tunnel during the experiment (from July to October 2004). 200 ml of solution was added to four plants from both groups (1a and 2a) every three weeks, and to the other four.
At the end of the trial, two plants from each group (treatment and control) were sent to the Plant Pathology Laboratory at the KwaZulu-Natal Department of Agriculture, Cedara, for pathogen analysis. This experiment was organized at the end of July 2004 in the tunnel at Cedara.
RESULTS
- Trial 1 (winter-spring)
- Transpiration rates and Vapour Pressure Deficit (VPD)
- Total non-structural carbohydrate (TNC) reserves
- TNC content and partitioning of reserves to roots of unhealthy stock plants
- Leaf nutrient analysis of healthy versus unhealthy C . odorata stock plants
- Trial 2 (autumn-winter)
- Fungicide trial (pathogen activity) and fertiliser treatments
- Spacing and drainage trial
- Stem structure and root anatomy
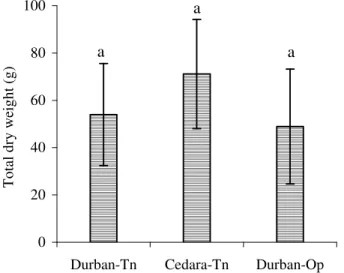
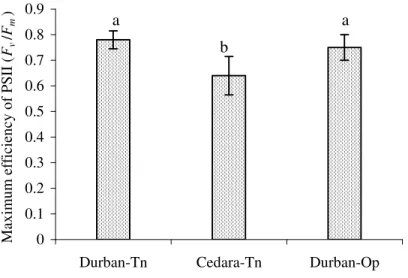
There was a significant difference in Fv/Fm values of leaves of Cedara-Tn-grown plants (Fig. 3.4) compared to Durban-grown plants (one-way ANOVA; p = 0.001), indicating lower photochemical efficiency of PS II in leaves of plants grown on Cedar. There was a marginally significant difference (p = 0.06) in total anthocyanin content of young leaves and a significant difference in total chlorophyll content of mature leaves (p = 0.0001) of plants grown on Cedara-Tn compared to those on grown in Durban areas (Fig. 3.5). Plants grown in Cedara-Tn had lower transpiration rates, calculated per pot, than those grown in Durban-Tn (Fig. 3.6) despite being exposed to high VPDs (Fig.
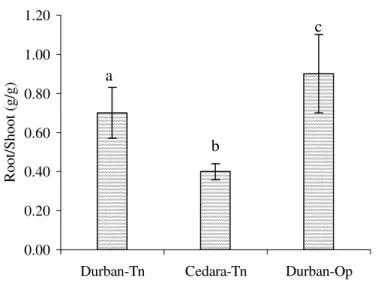
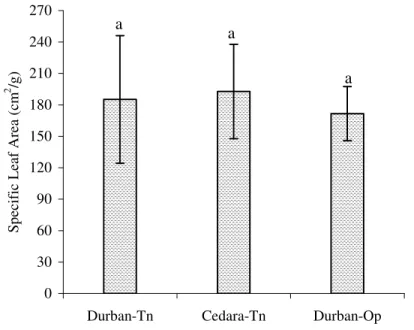
Results from an unpaired t test showed that there were no significant differences in transpiration rates between plants grown in Durban-Tn and Cedara-Tn for August (p = 0.357) and September (p = 0.778), but there was a in October (p = 0.042). Furthermore, at the end of the trial, plants grown in Cedara-Tn had a total leaf area greater than three times that of plants grown in Durban-Tn (Table 3.1). Plants grown in Cedara-Tn allocated less TNC to roots, and to a lesser extent, stems, compared to plants grown in Durban (Fig. 3.8).
ANOVA indicated significant differences in TNC reserves allocated to the leaves (p = 0.0001) and roots (p = 0.0001) of plants grown in Cedara-Tn and the Durban sites; One possible reason is that plants grown in Cedara-Tn were healthy and although less TNC reserves were allocated to the plant roots, the amount of TNC may have been sufficient. Furthermore, there was no direct correlation between plant health (based on visual symptoms (Fig. 3.10)) and TNC assigned to the roots (Fig. 3.11) of plants 1 to 6.
A possible reason for this is that these plants were grown in Durban and only kept in Cedara for a short period, thus plant growth and storage reserves were determined by the Durban environment and not the Cedara environment. The first column represents the number of plants that lost mortality in August, when potted plants were mainly placed on the ground. It appears that a combination of environmental factors affect the growth of plants at Cedara and with any additional stresses, e.g.
The redox potential (Table 3.5) of the soil of unhealthy and healthy mother plants of Chromolaena odorata showed that the Eh of both groups of plants was greater than 400 mV.
DISCUSSION
- Transpiration rates, VPD and TNC reserves
- Effects of spacing and drainage on plant growth
- Effects of waterlogging on plant growth
- Visual symptoms of mortality and redox potential of the soil of C . odorata plants In waterlogging stress, symptoms appear on the leaves only after the roots have been affected
- Morphological adaptations to waterlogging
- Conclusion and Recommendations
Plants grown in trials 1 and 2 may have had sufficient TNC reserves to alleviate the effects of environmental stress in the tunnel and shadehouse microhabitats at Cedara, and this may have enabled their survival. Plants placed (close together) on the ground in the spacing and drainage trial grew taller than plants placed (close together) on raised grids, but both groups of plants were less branched than plants placed (close together) on raised grids, but both groups of plants were less branched than plants placed (close together) on raised grids. apart) were placed on raised racks. the ground. But even if these 'Durban-grown' stock plants are placed in the ground at Cedara for a while, additional stress (oxygen deficiency) in the soil due to insufficient drainage (waterlogging) can lead to death.
Roots use oxygen (O2) from the soil for aerobic respiration, which provides energy to the roots for metabolic processes (e.g. nutrient uptake and carbohydrate metabolism, i.e. replenishing TNC reserves), but when the soil becomes saturated with water, the transfer of O2 from the air to the soil takes place. is blocked. Chemical changes depend on the intensity of flooding and are related to the reduction and oxidation status (redox) of the soil environment (Setter & Waters, 2003). Although redox potentials indicated that the soil of unhealthy and healthy plants was aerobic at the time of measurement, statistical analysis of redox potentials indicated that there was a marginally significant difference between the two groups of plants.
According to Handreck & Black (1994), waterlogged soils have a bad odor due to H2S and algal growth is observed on the soil surface; algal growth was observed on the surface of the soil supporting unhealthy C. Hypertrophied lenticels develop on the underground stem (stem base) to allow gas exchange between internal tissues and the atmosphere, thereby increasing O2 supply to plant roots when pore spaces in the soil become saturated with water (Kozlowski, 1997; Bacanamwo & Purcell, 1999). Plants grown in Durban were exposed to a less stressful environment than those grown in the microhabitats at Cedara, which may explain the survival of plants grown on the ground under natural conditions in Durban.
Soil aeration is also improved and roots are compressed from the air rather than growing into the soil, limiting stress on plants as they are transported between the tunnel and the canopy microhabitats. Probes can be placed in the soil to measure soil water content or potential and connected to a system that regulates the amount of water per pot based on plant size and to meet evaporation needs.
Seed dispersal of Chromolaena odorata reconsidered. eds) Proceedings of the Fourth International Workshop on Biological Control and Management of Chromolaena odorata. Preliminary results of the enzymatic diversity in Chromolaena odorata (L.) R.M. eds) Proceedings of the Second International Workshop on Biological Control of Chromolaena odorata. Ecology of Chromolaena odorata in the Neotropics. ed) Proceedings of the first international workshop on biological control of Chromolaena odorata.
Ecology of Chromolaena odorata in the Neotropics. eds) Proceedings of the Second International Workshop on the Biological Control of Chromolaena odorata. Effect of growing conditions and effectiveness of herbicides on the growth and development of Chromolaena. eds) Proceedings of the fourth international workshop on. University of Guam, Publication No. Ecology and distribution of Chromolaena odorata in Asia and the Pacific.
Coevolution of Siam Weed, Chromolaena odorata and its natural enemy, Pareuchaetes pseudoinsulata. eds) Proceedings of the Eighth International Symposium on Biological Control of Weeds. Global Invasive Species Database: Chromolaena odorata. http://www.issg.org/database/species/ecology.asp?si=47&fr=1&sts=sss. Invasion intensity and regenerative potential of the invasive non-native plant Chromolaena odorata in St. eds) Proceedings of Fifth International Workshop on Biological Control and Management of Chromolaena odorata, October 2000, Durban.
South African program for the biological control of Chromolaena odorata (L.) King & Robinson (Asteraceae) using insects. Evidence for a northern Caribbean origin for the southern African biotype of Chromolaena odorata. eds) Proceedings of Sixth International Workshop on Biological Control and Management of Chromolaena.