Objective: To determine whether abnormal saccadic eye movements in children with HIV/AIDS on HAART could be a predictor of their immune system status. Cornel Van Rooyen, biostatistician, for his generous time and help with the analysis of the data.
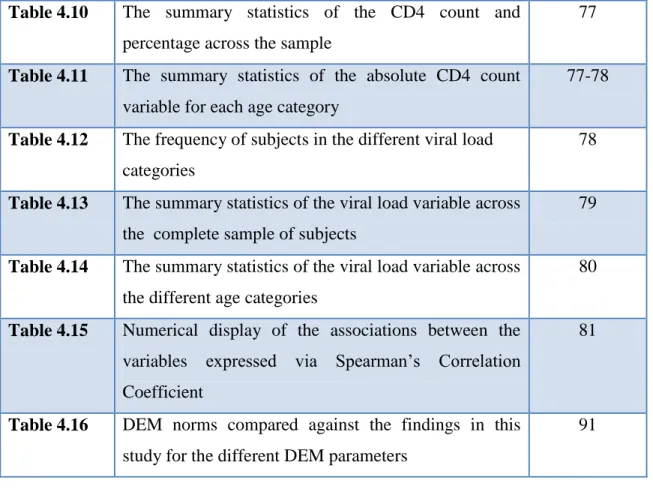
Index of Tables
List of Acronyms
CHAPTER ONE
INTRODUCTION
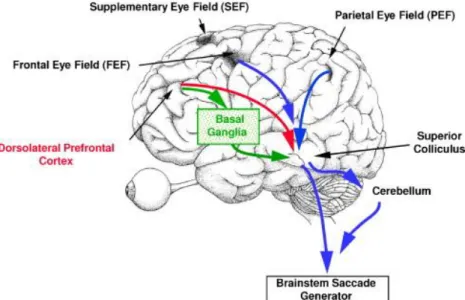
It has been said that activity related to eye movements can be found in every corner of the brain (Leigh and Kanna, 2006; Leigh and Zee 2006). Screening for ocular motility abnormalities by assessing saccadic eye movements is part of a basic optometric examination (Scheiman et al, 2002).
CHAPTER TWO
LITERATURE REVIEW
THEORETICAL FRAMEWORK
- HIV/AIDS: Global and National Epidemiological Outlook
- Testing, Diagnosis and the Classification System of HIV/AIDS in Children, globally and in South Africa
- South African ART Programme and Policy Implementation Guidelines
- HIV Pathogenesis and Life Cycle
- Neuro-Cognitive impairment in HIV Infection
- Neural Control of Saccadic Eye Movements
- Eye Movement Testing as a Tool in Psychiatric and Neurodevelopmental Disorders
- Eye Movement Analyses in HIV-Infected Subjects
Invasion of the nervous system occurs in the early stages of HIV infection by infecting cells of the immune system (Powderly, 2000; Lindl et al, 2010). Progression to the CNS occurs very rapidly by crossing the blood brain barrier (BBB).
CHAPTER THREE
METHODOLOGICAL FRAMEWORK .1 RESEARCH QUESTION
- PRIMARY OBJECTIVES
- SUPPORTIVE INVESTIGATIONS
- HYPOTHESIS
- RESEARCH DESIGN
- INCLUSION CRITERIA
- EXCLUSION CRITERIA
- SAMPLE SIZE
- SAMPLE SELECTION PROCESS
The DEM test was performed once and the results were compared with the latest immunological and virological findings of the subjects available at the time of data collection. All 128 subjects were on HAART and none of the subjects used English as their home language.
Phase 3: Subjects that were successful from phase 2 comprised of the final study sample and performed the DEM test
However, all subjects were familiar with English and performed the DEM test by pronouncing the numbers in English as standard. Review of health records to assess exclusion factors and extract the relevant data such as: -.
Phase 2: Appendix A was used for all subjects selected at the end of phase 1
DEM test and scoring sheet was used for subjects that passed the criteria in phase 2. The final results were recorded of the prepared DEM score sheet
- DATA COLLECTION SITES
- DATA COLLECTION INSTRUMENTS
- DEVELOPMENTAL EYE MOVEMENT (DEM) TEST Description, Procedure, Analysis, Interpretation and Characteristics
- DESCRIPTION
- PROCEDURE
The duration of the DEM test and the interaction with the subjects did not exceed 10 minutes, making it the least impressive for the subjects. The experimenter sat next to the subject at a table with the DEM test approximately 30 cm in front of the subject. The test procedure was performed as specified in the DEM test manual (Richman and Garzia, 1987).
The examiner then had the child to complete Test A (Figure 3.4). The subjects were then timed with a stopwatch and the duration of time taken to complete Test A
The subjects were then timed with a stopwatch and the length of time it took to complete Test A.
The subject was then prompted to perform Test B (Figure 3.5) in the same manner that Test A was done. The time was recorded with a stopwatch and written
In this final step, Test C (Figure 3.6) was carried out after an instruction was given on how to perform this horizontal test as it looked different from Test A and B
- ANALYSIS: TEST SCORE CALCULATION
- ETHICAL REVIEW
- Informed Consent
- Patient Confidentiality
- Moral Considerations and Conduct
- Administrative Obligations
- METHOD OF REFERENCING
Only errors made on the horizontal test were recorded and used in determining the adjusted horizontal time. Omissions and additions were the only types of errors used in the calculation of the adjusted horizontal time. The presence of the adult responsible for the subject during the data collection process was also welcomed.
CHAPTER FOUR
RESULTS
DEMOGRAPHIC PROFILE
Sample Size at Data Collection Sites
CLINICAL PROFILE
- Description of Variables
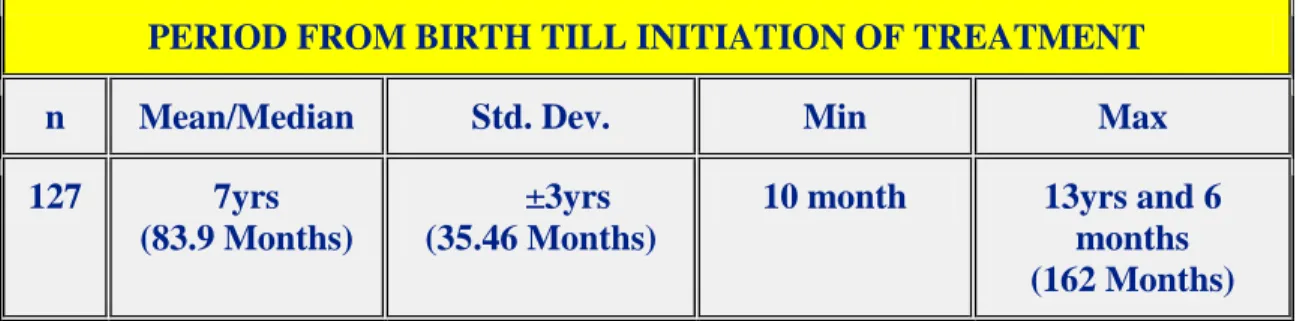
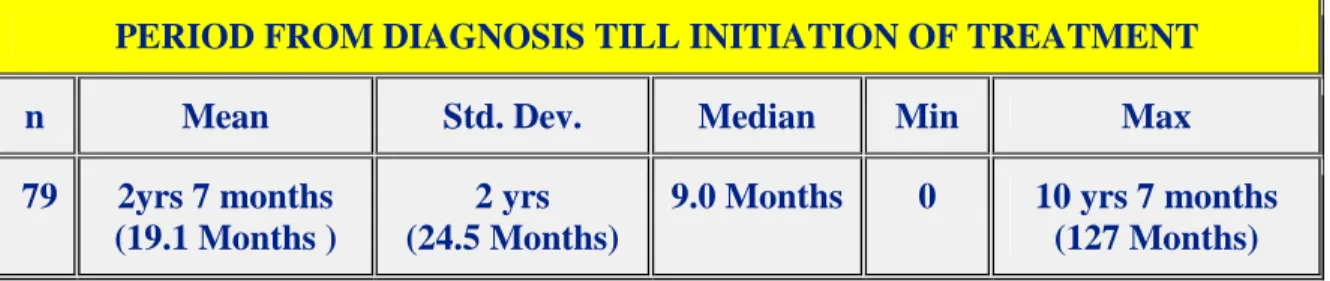
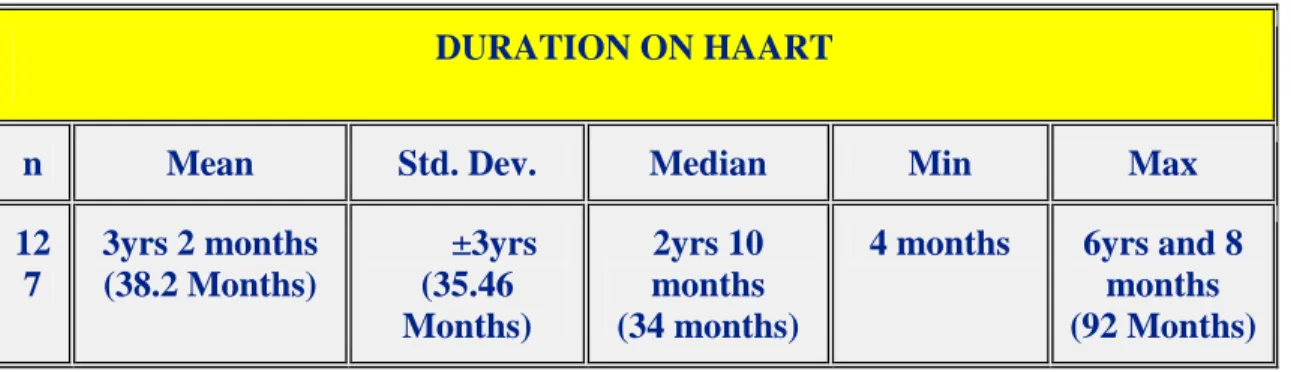
This section comprehensively describes the clinical profile of the sample using summary statistics by examining the virological status, immunological status as well as the diagnosis and treatment timelines for each of the subjects. More focused expression of the data regarding the viral load and CD4 count variables was described for each age group. This analysis is based on only 81 of the 128 subjects as there was insufficient data available in the remaining 47 subjects' health records from when the diagnosis was established.
- Correlation Analysis
The median is a more accurate statistic, as more than 50% of the sample has an undetectable viral load (40 copies/ml). In this case, the median is a more accurate description of the average viral load in different age groups. As treatment duration increased, viral load decreased, which is expected of HAART.
DEM ANALYSIS PROFILE
- Analysis of the DEM Test Results
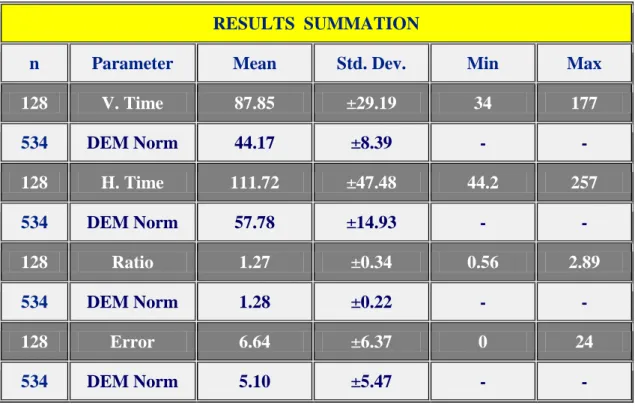
In the analysis of the trend between the above variables, a marginally weak negative correlation existed. A further interpretation of the coefficient was that the relationship between the variables was strong. The absolute value was 119 subjects outside the standard norm and 9 subjects within the norm.
OVERALL VERTICAL TIMES
83 studied the prevalence of behavior types in the sample and focused the investigation on each age category. Out of normal' refers to the combined A and B subtest time being 'slower' than the specified mean time. Therefore, Figure 4.2 reflects the overall performance of individual subjects in the entire sample, calculated with respect to the mean and standard deviation (±SD) for each age category.
MEAN VERTICAL TIME
85 By further inspection of the ±SD of the standard DEM mean and the study mean, the findings were still consistent in that the ranges were still beyond each other. An inverse relationship between age and time is a normal trend and is evident from the trend lines of the DEM norm and the study sample. The absolute value was 118 subjects were outside the mean within the DEM outside the mean DEM.
OVERALL HORIZONTAL TIMES
The survey vertical times were significantly slower than the standard and in some cases the average vertical times were more than twice the average DEM standard times. The results on the horizontal test (subtest C) nearly mimic performance on the vertical test. As with the vertical test, the norms (means and standard deviations) are age-specific and differ for different age groups.
MEAN HORIZONTAL TIME
The interpretation was that the resulting survey averages across the sample were below the norms, as shown by the presentation of a data table below the plot in Figure 4.5. The strategic use of a data table helped verify the graph presented and showed that the average horizontal times were much slower across all age norms. The use of the word "marginal" in this context referred to the lower limit of the ±SD of the study sample that overlaps the extreme upper limit of the DEM mean norm.
OVERALL RATIO
88 In Figure 4.6, a comparison of the percentage of subjects' absolute ratio scores against the DEM mean ratio norm, it is evident that 45% of 128 subjects had ratios outside the mean and ±SD of the entire sample of subjects (Figure 4.6) ) . The 45% of subjects were further subdivided for closer examination of the data to show that "Total outside DEM mean" was a combined term for those falling both above and below the standard deviation of mean ratios. An absolute number of 22 (17%) subjects of the 128 had uncharacteristic ratios below the DEM mean ratio and ±SD.
MEAN RATIO (H/V)
89 The average ratio graph in Figure 4.7 shows a different picture compared to the average vertical time graph and the average horizontal time graph. Although the vertical times and horizontal times were much slower in the subjects compared to the DEM norms, the mean ratios produced almost mimic the trend of the DEM ratio means. In 100% of the age categories, the study means and ±SD are within the DEM ±SD of the mean norm.
ERRORS
The average ratio graph in Figure 4.7 shows a different picture compared to the mean vertical time graph and the mean horizontal time graph. Figure 4.9 above shows a higher mean error value in the younger age group and almost a lower level than the 11 to 13 year range as shown by the trend line and supported by the data table. The inverse relationship between age and error is evident in the DEM norm as well as in the results of the study sample.
MEAN ERRORS
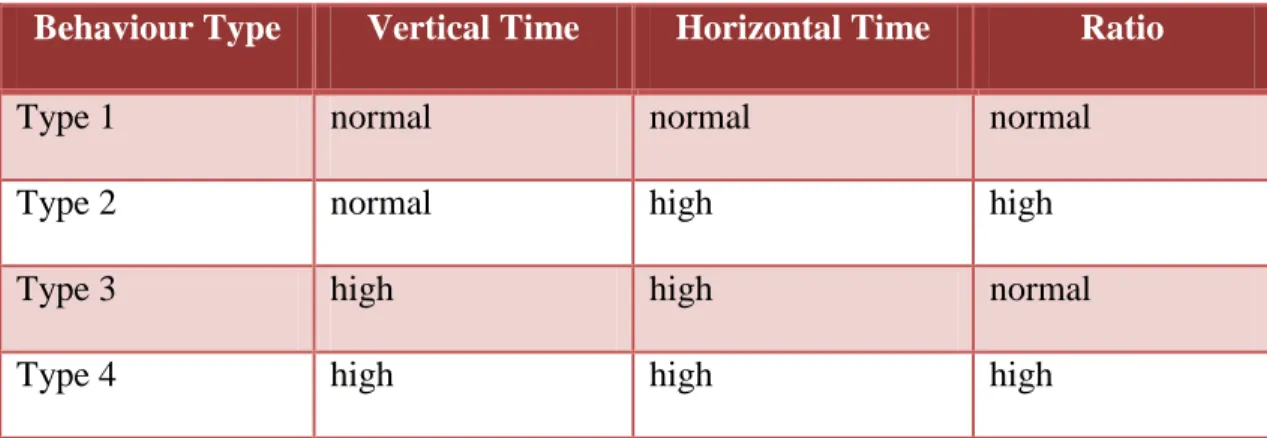
The purpose of this presentation of combining and averaging data across the sample to produce a mean and ±SD was to demonstrate overall differences in sample performance against DEM benchmarks for the reader to evaluate. The DEM test used a sample of 534 subjects in developing the DEM normative scale for reference. As shown in Figure 4.10, there are 5 types of behavior, of which type 1 to four are the standard types of behavior (Table 3.1) classified by the DEM test, and type 5 represents the unclassified type (Table 3.1).
BEHAVIOUR TYPE
93 type 3 and type 4, but with a low ratio outside the norm for this age of the subject. The four pie charts above represent the prevalence of different types of behavior in the four age categories. The reason why the researcher decided to present four pie charts of different age categories together and not separately as one would traditionally expect to create.
Behaviour type trend in 7 year olds
Behaviour type trend in 8 year olds
Behaviour type trend in 9 year olds
Behaviour type trend in 6 year olds
In the pie charts (b)–(d), behavior type 2 reappeared as the smallest percentage of the group, but again still represented only one item. Behavior type 3 was consistently found to represent no less than 57% of the sample in different age categories. Behavior type 5 (light blue) is represented in age group category 9, representing 6 out of 30 subjects in this age group.
Behaviour type trend in 11 year olds
The immediate impression is that behavior type 2 (red) is absent in these four age groups.
Behaviour type trend in 13 year olds
Behaviour type trend in 10 year olds
Behaviour type trend in 12 year olds
96 Through these four age categories and the previous four age categories, behavior type 4 (purple) never exceeded 41% or an absolute number of 7 subjects in any of the eight age categories, and it has the highest prevalence in the age category 12 years. . Behavior type 1 (dark blue) appears to increase in prevalence consistently as the subjects aged from the 9-year-olds to the 13-year-olds. Behavior type 5 (light blue) never appeared to exceed the quartile mark for the sample pool in each age category and never exceeded an absolute subject count of 6 in any of the age pools.
BEHAVIOUR TYPE vs VIRAL LOAD
97 In Figure 4.13, each cylinder consists of the different types of behavior commonly found in the three virological categories. 98 Figure 4.14: A representation of the occurrence of the different behavior types in the three immunological status categories of the sample. In Figure 4.14, each cylinder consists of the different types of behavior, but those that are common in three immunological categories.
BEHAVIOUR TYPE vs CD4 COUNT
Probability
In the analysis between viral load and behavioral types, a Chi Square analysis with 3 x 5 tables was performed. This showed that there was no statistically significant difference between the categories of behavioral types and viral load variables. This showed no statistical significance between categories of behavioral types and CD4 count variables.
SUMMARY OF RESULTS
- Demographic Profile:-
- Clinical Profile:-
- DEM Analysis Profile:-
Fig.4.3: 100% of the average vertical times per age group was higher than the age-specific mean for DEM and standard deviation. Fig.4.4: 92% of subjects had horizontal times that were outside the DEM mean and sample standard deviation. Fig.4.5: 100% of the average horizontal times per age group was higher than the DEM age-specific mean and standard deviation.
CHAPTER FIVE
DISCUSSION, LIMITATIONS, CONCLUSION, RECOMMENDATIONS AND SUMMARY
DISCUSSION
- Demographic Profile
- Clinical Profile
- DEM Analysis Profile
110 Analysis of the CD4 count results revealed that the subjects in this sample were largely "healthy". There was a progressive increase in the normal score in the DEM test (type 1) with the aging of the subjects, but it was still below the established norms. Evaluation of the performance in the DEM test was subnormal for all age-specified norms.
Incidence and prevalence of HIV encephalopathy in children with HIV infection receiving highly active anti-retroviral therapy (HAART). Cognitive functioning in school-age children with vertically acquired HIV infection treated with highly active antiretroviral therapy (HAART). Clinical progression of HIV-1 infection according to viral response during the first year of antiretroviral treatment.
PATIENT RECORDING FORM
DEMOGRAPHIC INFORMATION
Appendix A
VISION SCREENING INFORMATION
Naicker for your consent to participate in a research study of the child in your care. Procedure: First the child would have his vision checked, followed by eye movement testing. Children's confidentiality will be maintained throughout the study and after I have finished working with the child.
Appendix B1
Naicker
Die inligting in hierdie bylaag sal jou help om te verstaan wat van die kind verwag sal word en jy moet dit eers lees voordat jy toestemming gee. Prosedure: Eers sal die kind se visie getoets word en dan sal die oogbewegings getoets word. Deelnemer-identifikasie sal ook nie in enige publikasie of aanbieding gebruik word nie.
Appendix B2
Vertroulikheid van deelnemersidentifikasie sal tydens die studie sowel as na die voltooiing van die studie gehandhaaf word. 168 Jy het die reg om jou kind se deelname te weier en jy kan jou kind enige tyd tydens die studie aan die studie onttrek. Indien u wil, is u welkom om tydens die kind se assessering teenwoordig te wees.
Appendix B3
Ena ke kopo ea ka Monghali Naicker ho uena motsoali/mohlokomeli oa ngoana ho nka karolo le ho lumella ngoana ea tlhokomelong ea hao ho kena. Lintlha tse latelang li tla u lemosa hore u utloisise hore na ho lebeletsoe eng ho uena haeba u lumella ngoana ho kenya letsoho lipatlisisong. Hona joale motsoali/mohlokomeli ha a tlameha ho nka karolo empa u ka nka karolo ha u lumela.
Senior Optometrist/Junior Lecturer
CONSENT FORM
Appendix C1
Ek verstaan ten volle my regte en wat van die kind verwag word en is.
Appendix C2
Sehlomathisetswa sa A
Appendix C3