ABAQULUSI MUNICIPALITY
DRAFT
MEDIUM TERM BUDGET
2011/ 2012 TO 2013/2014
Table of Contents
Part Section description Page
List of figures, tables and annexures 3 – 4
Glossary 5 ‐ 6
Part 1 Annual Budget
1 Resolutions 7
2 Budget Overview: Ex Budget Synopsis & Executive summary 8 – 12
3 Annual budget tables 13
Part 2 Supporting documentation
4 Overview of annual budget process 14 – 18
5 Overview of the Integrated Development Plan 19 – 20
6 Measurable performance objectives and indicators 21 – 22
7 Overview of budget‐related policies 23 – 24
8 Overview of budget assumptions 25 – 30
9 Overview of budget funding 31 – 37
10 Expenditure on allocations and grant programmes 38 – 39
11 Allocations and grants 40
12 Monthly targets for revenue, expenditure and cash flow 41 – 42 13 Councillor and board member allowances and employee benefits 43 – 46 14 Annual budgets and service delivery and budget implementation
plans – internal departments 47
15 Contracts having future budgetary implications 48 – 49
16 Reconciliation of IDP strategic objectives and capital budget 50
17 Legislation compliance status 51
18 National Treasury directives 52
19 Capital expenditure details 53
20 Other supporting documents 54 ‐ 147
A. LIST OF FIGURES, TABLES AND ANNEXURES
No Description
Table 1 Budget Summary (Table A1)
Table 2 Budgeted Financial Performance (Revenue and Expenditure by standard classification) (Table A2)
Table 3 Budgeted Financial Performance (Revenue and Expenditure by municipal vote) (Table A3)
Table 4 Budgeted Financial Performance (Revenue and Expenditure) (Table A4)
Table 5 Budgeted Capital Expenditure by vote, standard classification and funding (Table A5) Table 6 Budgeted Financial Position (Table A6) 22
Table 7 Budgeted Cash Flows (Table A7) 23
Table 8 Cash backed reserves/accumulated surplus reconciliation (Table A8) Table 9 Asset Management (Table A9)
Table 10 Basic service delivery measurement (Table A10)
Figure 1 IDP and Budget link – Strategy implementation and budgeting model Table 11 IDP and Budget Time Schedule
Table 12 Performance Indicators (Support Table A8) Table 13 Parameters applied to staff budget
Table 14 Proposed revenue based on parameter increases Table 15 Projected collection rates
Table 16 Equitable Share Equation Table 17 Medium term operating budget
Table 18 Medium term capital budget and funding sources Table 19 Monetary investments by type (Support Table A15)
Table 20 Monetary investments by maturity date (Support Table A16) Table 21 National Allocations
Table 22 Provincial Allocations
Table 23 Expenditure on allocations and grant programmes (Support Table A19) Table 24 Monthly targets for revenue and cash flow (Support Table A30)
Table 25 Salaries, allowances and benefits (Political office bearers, Councillors and senior managers) (Support Table A23)
Table 26 Councillor and board member allowances and employee benefits (Support Table A22)
Table 27 Contracts having future budgetary implications (Support Table A33)
Table 28 Reconciliation of IDP strategic objectives and budget (Capital Expenditure) (Support Table A6)
Table 29 Detailed capital budget (Support Table A36)
Table 30 Financial performance budget (revenue source / expenditure type and department) (Support Table A2)
Figure 8 Revenue by major source
Figure 9 Revenue by minor source
Figure 10 Operating expenditure by major type Figure 11 Operating expenditure by minor type Figure 12 Revenue by municipal vote classification Figure 13 Expenditure by municipal vote classification Figure 14 Revenue by standard classification
Figure 15 Expenditure by standard classification
Figure 16 Capital expenditure by standard classification 83 Figure 17 Capital expenditure by municipal vote – major 83 Figure 18 Capital expenditure by municipal vote – minor 84 Figure 19 Capital funding by source 84
Annexure 1 Multi Year Capital Appropriations By Vote Annexure 2 Measurable Performance Objectives Annexure 3 Property (Tax) Rates
Annexure 4 Tariffs, Fees and Charges Book Annexure 5 Rates Policy
Annexure 6 Proposed Amended Tariff Policy
Annexure 7 Draft Credit Control and Debt Collection Policy and By-laws Annexure 8 Virement Policy
Annexure 9 Integrated Development Plan
Annexure 10 Transfers and grants made by the municipality
Annexure 11 Budgeted Financial Performance (revenue and expenditure) per directorate and department
Annexure 12 Operating and Capital ward allocation projects
Annexure 13 National Treasury Circular 54 – Municipal Budget Circular for the 2011/2012 MTREF
Annexure 14 National Treasury Circular 51 Annexure 15 National Treasury Circular 55
Annexure 16 National DORa Gazette – 33959 – 24 January 2011
Annexure 17 Provincial DORa Gazette – 27 – 04 March 2011
B. GLOSSARY OF TERMS AND ABBREVIATIONS
Adjustments Budgets – Prescribed in section 28 of the Municipal Finance Management Act, this is the formal means by which a municipality may revise its budget during a financial year.
Allocations – Money received from Provincial and National Treasury.
Budget – The financial plan of a municipality.
Budget related policy – Policy of a municipality affecting, or affected by, the budget. Examples include tariff policy, rates policy and credit control and debt policy.
Budget Steering committee – Committee established to provide technical assistance to the Mayor in discharging the responsibilities set out in section 53 of the MFMA.
Capital Expenditure – Spending on municipal assets such as land, buildings and vehicles.
Any capital expenditure must be reflected as an asset on a municipality’s balance sheet.
Cash Flow Statement – A statement showing when actual cash will be received and spent by the municipality, and the month end balances of cash and short-term investments.
CPI – Headline Consumer Price Index DMTN – Domestic Medium Term Note
DORA – Division of Revenue Act. Annual legislation which shows the allocations from national to local government.
DORb – Division of Revenue Bill. Annual legislation tabled in parliament, but not enacted, which shows the allocations from national to local government.
Executive Management Team – A team comprising the Municipal Manager and the Executive Directors. It reports to the Municipal Manager.
Equitable Share – A general grant paid to municipalities. It is predominantly targeted at assisting municipalities with the costs of free basic services.
GDFI - Gross Domestic Fixed Investment
GFS – Government Finance Statistics. An internationally recognised classification system that facilitates comparisons between municipalities.
IDP – Integrated Development Plan. The main strategic planning document of a municipality.
KPI – Key Performance Indicators. Measures of service output and/or outcome.
MFMA - Municipal Finance Management Act (No 53 of 2003). The principal piece of legislation relating to municipal financial management.
MTREF – Medium Term Revenue and Expenditure Framework, as prescribed by the MFMA. It
sets out indicative revenue and projected expenditure for the budget year, plus two outer
financial years.
MYPD – Multi Year Price Determination NT – National Treasury
Operating Expenditure – The day-to-day expenses of a municipality such as general expenses, salaries & wages and repairs & maintenance.
Portfolio Committee – In line with Section 79 of the Structures Act, the Municipality’s Portfolio Committees process policies and bylaws relating to the functional areas within their terms of reference, and are responsible for implementation monitoring of these, as well as oversight of the functional areas. Portfolio Committees are also responsible for assessing and monitoring services delivery, ensuring that annual budgets are spent wisely, and that there is no wastage or corruption.
Rates – Local Government tax based on assessed valuation of a property.
TMA – Total Municipal Account SCM - Supply Chain Management
SDBIP – Service Delivery Budget Implementation Plan. A detailed plan comprising quarterly performance targets and monthly budget estimates.
SFA – Strategic Focus Areas. The main priorities of a municipality as set out in the IDP.
Budgeted spending must contribute towards achievement of these Strategic Focus Areas.
Vote – One of the main segments into which a budget is divided, usually at directorate level.
1. RESOLUTIONS
The 2011/2012 MTREF Budget Resolutions recommend that:
1. The annual budget for the financial year 2011/2012; and indicative allocations for the two projected outer years 2012/2013 and 2013/2014 and related policies, as tabled, be noted, as set out in the following schedules and annexures:
a) Operating expenditure by GFS classification reflected in Table 2.
b) Operating expenditure by vote reflected in Table 3.
c) Operating revenue by source reflected in Table 41.
d) Multi-year capital appropriations by vote reflected in Annexure 1 and Table 40.
e) Capital expenditure by GFS classification reflected in Table 5.
f) Capital funding by source reflected in Table 5.
g) Cash Flow statement as reflected in Table 7.
h) Salaries and Benefits of Political Office Bearers, Councillors and Senior Officials as reflected in Table 28 and Table 29.
i) Performance Indicators for 2011/2012 as set out in Table 13.
j) Assessment (property) rates as set out in Annexure 3.
k) Revised Consumptive Tariffs, Rates and Basic Charges for Electricity Services, Water Services and Waste Management Services as set out in Annexure 5.
l) Tariffs, Fees and Charges Book incorporating miscellaneous tariffs, charges, rates and levies for 2011/2012 as set out in Annexure 6.
m) Draft Budget Policy as set out in Annexure 7.
n) Amended Tariff Policies as set out in Annexure 8.
o) Draft Credit Control and Debt Collection Policy as set out in Annexure 9 (with effect from 01 July 2011).
p) Integrated Development Plan as set out in Annexure 10.
q) Budgeted Financial Performance (revenue and expenditure) per directorate and department as per Annexure 11.
r) Operating and Capital ward allocation as set out in Annexure 12.
s) Virement policy as set out in Annexure 13.
2. Service Delivery Plans / Business Plans with measurable targets to be approved by the Executive Mayor within 28 days after the approval of the budget.
3. The National Treasury Circular 54 (“Municipal Budget Circular for the 2011/2012 MTREF”) is annexed to this report for noting.
4. Further ward allocation projects to be identified and approved towards the end of March
and to be included in the budget to be submitted to Council for approval.
2. BUDGET SYNOPSIS & EXECUTIVE SUMMARY
a. General
The 2011/12 MTREF was drafted in context of a reviving economy, whilst still acknowledging the lingering effects of the economic downturn of the past couple of years.
The budget for the 2011/12 MTREF period was based on the realisation that no, or limited, scope for additional externally- or internally-funded revenue growth existed and was further reiterated in National Treasury guidelines (circular 51) - “…over the next few years, government must deliver more services – and deliver them more efficiently – within a tight resource envelope. Achieving this objective requires a new way of working:
the budget has been reprioritised so that money is moved from low-priority programmes to high-priority programmes. Municipalities are encouraged to adopt similar stances on these issues. This is particularly important in the run-up to the local government elections. Mayors and Councils need to remain focused on the effective delivery of core municipal services….”
b. Operating Budget Expenditure
Total operating expenditure increased from R 261 million in 2010/11 to R363 million in 2011/12. The overall growth of 38.9% can be attributed to increases on several
expenditure components. Examples of these are:
2010/11 Budget
R
2011/2012 Budget
R
Year on year
Employee related costs 91,664,140 95,667,590 4.3%
Remuneration of Councillors 10,638,600 12,193,370 14.6%
Depreciation 0 16,337,340 100%
Bulk purchases 65,675,000 99,300,000 51%
Contracted Services 21,750,000 19,540,000 -11%
Grants paid 12,825,000 12,825,000 0%
Other expenditure 58,657,900 107,139,480 82.6%
Total expenditure 261,210,640 363,002,780 38.9%
Reasons for significant variances:
Remuneration of Councillors – The 2011/12 provision includes an allocation for
additional Councillors following ward demarcation amendments and the impact of
additional sub Councils post the 2011 municipal elections.
Depreciation & Asset Impairment – The increase results from the adjusted (reduced) life span of certain asset classes and the depreciation impact of major projects as well as the revaluation of certain asset classes;
Bulk Purchases – The increase results from higher than inflationary bulk purchase costs envisaged for the Electricity Services.
Other expenditure – This expenditure component now includes all other grant funding including the grant funding for capital in terms of GRAP accounting standards
Staff Cost increases:
2010/11 Budget
R
2011/2012 Budget
R
Year on year
%
Council & Executive 10,638,600 12,193,370 13%
Municipal Manager 3,959,440 3,790,870 -5%
Budget & Treasury 11,678,510 12,014,640 3%
Corporate Admin 4,384,770 5,039,580 13%
Information Technology 999,880 1,621,290 38%
Human Resources 2,458,690 2,581,760 5%
Parks & Gardens 2,480,770 3,055,530 19%
Library 2,039,550 2,480,430 18%
Museum 272,140 288,110 6%
Community Development 1,578,890 1,524,400 -4%
Cemeteries 1,684,540 1,462,990 -14%
Safety & Security 7,300,690 9,021,180 19%
Housing Services 880,650 904,550 3%
Health & Clinics 678,060 449,410 -51%
Planning & development 3,019,640 3,779,020 2%
Roads 9,166,190 7,991,430 -13%
Vehicle Licencing 689,470 932,680 26%
Technical Administration 1,719,220 2,048,130 16%
Electricity 12,342,580 14,086,600 12%
Water 11,482,630 10,273,660 -11%
Waste Water 8,962,140 9,053,150 1%
Waste Management 2,711,390 3,001,860 10%
Other - Tourism 224,300 266,320 16%
Total Staff costs 101,352,740 107,860,960 6%
Reasons for significant staff cost variances:
Council and Executive – additional Councillors
Information Technology – new post
Vehicle Licencing – additional staff
Departments where there are reductions in costs are due to vacancies frozen
The 2011/12 Operating Budget provides for the following additional allocations:
Revenue
Total operating revenue increased from R 261 million in 2010/11 to R 363 million in 2011 / 12 (% growth).
Major contributing items are:
• An increased allocation in respect of the National Equitable Share allocation (from R 57 million (2010/11) to R69 million (2011/12))
• Projected organic growth and tariff increases on Property Rates Tax and Service Charges (Water, Sanitation, Electricity and Refuse)
Revenue sources:
2010/11 Budget
R
2011/2012 Budget
R
Year on year
Property Rates tax 33,500,000 34,671,020 3%
Property Rates – penalties 728,930 778,740 7%
Services charges – Electricity 103,795,110 128,043,000 23%
Services charges – Water 17,072,260 21,124,000 24%
Services charges – Sanitation 13,871,140 14,639,000 5%
Services charges - Refuse 10,606,390 11,355,000 7%
Rental of facilities and equipment 587,430 579,000
Interest earned – investments 195,250 4,399,000
Interest earned – outstanding debtors 1,680,000 779,000
Fines 3,017,980 1,672,730
Licences and permits 4,645,570 4,493,450
Grants & Subsidies 61,478,000 73,217,000 19%
Grants & Subsidies - capital 0 48,605,000 100%
Other Revenue 10,070,550 19,432,890 93%
Total Revenue 261,248,610 363,009,830 38.9%
Reasons for significant Revenue variances:
Water – allowance made for growth in consumption
Interest on Investments must now be shown as revenue
Various classes of revenue reduced due to downturn in economy
Other Revenue – includes contribution for depreciation Individual service tariffs / Rates
The proposed tariff increases in the table below are averages; i.e. some clients may pay more and others less than the average.
Average Tariff increases for 2011/12, 2012/13 and 2013/14:
2011/12
%
2012/13
%
2013/14
%
Rates 6 5 5
Electricity 20.38 5 5
Water 6 5 5
Sanitation 6 5 5
Refuse Removal 6 5 5
Rates
The tariff increase is 6%
Water and Sanitation
An average tariff increase of 6%
Solid Waste
An average tariff increase of 6%.
Electricity
Although the Eskom bulk supply costs increases by 26.71%, the average tariff increase is 20.38%.
c. Capital Budget
The Capital Budget increases from R39 million in 2010/11 to R48 million in 2011/12. This overall growth of 25% can be attributed to various factors:
increased allocations made by National and Provincial spheres of Government for the Housing and Roads & Electricity votes
2010/11 Budget
R
2011/12 Budget
R
Increase/Decrease R
Capital Grants 36,980,000 48,605,000 11,625,000
Total 36,980,000 48,605,000 11,625,000
Major capital expenditure is planned in the following areas during the 2011/12 financial year:
Roads – R 20,975,000
Electricity – R 13,773,000
Housing – R 10,000,000
Buildings – R 3,500,000 The most significant projects are in:
Technical Directorate:
Roads Services:
o Rural Roads & Bridges o eMondlo Roads o Lakeside Bus Route
Electricity Services:
o Electrification of New England o Electrification of Mhlongo Farm
o Electrification of Vrede/Cliffdale – Phase 2 o Connection of A School
Housing Directorate:
o Refurbishment of hostels
Buildings
o Thusong centre in eMondlo
New projects (extract) in the draft 2011/12 Capital Budget:
Project Description 2011/2012
Budget R
Thusong Centre 3,500,000
Hostel Refurbishment 10,000,000
Vrede/Cliffdale Electrification 944,650
New England/Mhlongo farm Electrification 12,328,350
School connection - electricity 500,000
Roads 20,975,000
3. ANNUAL BUDGET TABLES
Budget schedules to be approved by resolution of Council Table A1 - Budget Summary
Ref to page 55 – 56
Table A2 - Budgeted Financial Performance (Revenue and Expenditure by standard classification) Ref to page 57 – 62
Table A3 - Budgeted Financial Performance (Revenue and expenditure by municipal vote) Ref to page 63 – 66
Table A4 - Budgeted Financial Performance (Revenue and Expenditure)
Ref to page 67 – 68
Table A5 - Budgeted Capital Expenditure by vote, standard classification and Funding Ref to page 69 – 74
Table A6 - Budgeted Financial Position Ref to page 75 – 76
Table A7 - Budgeted Cash Flows Ref to page 77
Table A8 - Cash backed reserves/accumulated surplus reconciliation Ref to page 78
Table A9 - Asset Management Ref to page 79 – 80
Table A10 - Basic service delivery measurement
Ref to page 81 - 82
4. OVERVIEW OF ANNUAL BUDGET PROCESS
a. Budget Process Overview
In terms of Section 24 of the MFMA, Council must, at least 30 days before the start of the financial year, consider the annual budget for approval. Section 53 requires the Mayor of a municipality to provide general political guidance over the budget process and the priorities that must guide the preparation of the budget. In addition, Chapter 2 of the Municipal Budget and Reporting Regulations, gazetted on 17 April 2009, states that the Mayor of a municipality must establish a Budget Steering Committee to provide technical assistance to the Mayor in discharging the responsibilities set out in section 53 of the Act.
In line with the above requirements, the budget process for the 2011/2012 MTREF period proceeded/will proceed according to the following timeline:
26 July 2010:
Planning meeting and establishment of Budget Committee including review of IDP and budget policies as per Gazette 32141
8 September 2010 : Budget Framework
Meeting the HOD’s to discuss budget process. Preparation of budget framework to provide parameters and request budget and tariff inputs for 2010/2011
22 September 2010
Presentation of Departmental and Capital Budgets
Departments to present budget requirements to Finance, including tariff proposals.
Suggested amendments to Budget related Policies 08 March 2011 Draft Budget
Submit Draft budget, tariffs, SDBIP’s to Exco for recommendation to Council Submit Draft IDP to Exco for recommendation to Council
b. Integration of the review of the IDP and the preparation of the Budget
The IDP is the principal strategic planning instrument that guides and informs its planning, management and development actions. This visionary framework is rolled out into objectives, key performance indicators (KPIs) and targets for implementation. These are then broken down into Service Delivery and Budget Implementation Plans (SDBIPs) that reflect the detailed projects. Each of these projects is allocated budgetary and other resources.
The IDP also informs the municipality’s performance management system, as the KPIs are monitored and must be reported on every quarter.
The figure below visually represents the link between the IDP and the Budget and
demonstrates how corporate strategy is cascaded towards through the organisation, and
how it influences and shapes the operating and capital budgets of the various directorates and departments within the municipality.
Figure 1: IDP and Budget link
Figure 1: IDP and Budget Link
c. Consultation with the community and key stakeholders
The IDP public engagement was held from November 2010 to February 2011. Public awareness of the process was ensured through extensive regional and local print media advertising as well as invitations to ward forums. The first series of direct engagements occurred with consultation taking place at a sub Council level.
The tabled budget will provided to the National and Provincial Treasury for their assessment in accordance with S23 of the MFMA in March 2011.
d. Schedule of Key Deadlines relating to budget process [MFMA s 21(1)(b)]
The 2011/2012 IDP and Budget time schedule was approved in 31 August 2010. The schedule is reflected below.
IDP O veral l Stra teg y
PMS M on ito ri ng an d
Eva lu atio n.
P la n to e ns u re s tra te g y is e ffe c ti ve
a n d e ffi ci e nt.
Budget Re sou rce Pl an .
S u p po r ts th e str a te g y.
DATE ACTIVITY RESPONSIBILITY 26 July 2010
Planning meeting and establishment of Budget Committee including review of IDP and budget policies as per Gazette 32141
Budget Committee 10 August 2010 Draft Process Plan to EXCO for approval IDP Manager
13 August 2010 IDP Steering Committee IDP Manager
16 August 2010 Meeting with Mayor, EXCO and MANCOM to establish
consultation forum and plan program of meetings. MM/CFO 25 August 2010 Advertising of Process Plan IDP Manager 8 September 2010
Budget Framework
Meeting the HOD’s to discuss budget process. Preparation of budget framework to provide parameters and request budget and tariff inputs for 2010/2011
CFO
22 September 2010
Presentation of Departmental and Capital Budgets Departments to present budget requirements to Finance, including tariff proposals. Suggested amendments to Budget related Policies
HOD’S/CFO
23 September 2010 First IDP Representative Forum IDP Manager 29 September 2010 First Service Provider Forum IDP Manager 08 October 2010 Completion of Salary Budget CFO
14 October 2010 Second Service Provider Forum IDP Manager 16 October 2010 Prepare draft budget three year operational and
capital budget
CFO
22 October 2010
Submission of Budget Inputs
Final date for HOD’s to submit departmental budget inputs.
Proposed Capital projects from IDP
HOD’S
27 October 2010 Report back on progress with Budget inputs CFO MANCOM
03 November 2010
Budget discussion document
Compile discussion document from inputs and submit to BUDGET COMMITTEE, EXCO and MANCOM
IDP Steering Committee
CFO
IDP Manager 10 November 2010
Budget Workshop
Discussion of budget inputs, link capital and operational plans to IDP and determine proposed tariffs
EXCO MANCOM 23 November 2010 Draft Budget
Submit 1
stDraft to Exco CFO
07 December 2010 Draft Budget
Submit 1
stDraft to Council CFO
12 January 2011 IDP Steering Committee IDP Manager
11 February 2011 Review of current budget and inputs for new budget MANCOM
10 February 2011 IDP Steering Committee IDP Manager
17 February 2011 IDP Steering Committee IDP Manager
08 March 2011
Draft Budget
Submit Draft budget, tariffs, SDBIP’s to Exco for recommendation to Council
Submit Draft IDP to Exco for recommendation to Council
24 March 2011
Draft Budget
Submit Draft multi-term operational and capital budget, SDBIP to Council, National and Provincial Treasury, DCGTA
Advertise draft budget and tariffs for comment Submit Draft IDP to Council, National and Provincial Treasury & DCGTA
CFO
IDP Manager
30 March - 15 April 2011
Public Consultation Process
Public Consultation on Draft budget throughout municipality
Public Consultation on Draft IDP
Advertise both budget and IDP for comment
MAYOR EXCO MM
IDP Manager
21 April 2011
Respond to Public Comments
Response to public comments and sector comments.
Incorporate recommendations into Draft budget and IDP if possible and feasible
MAYOR CFO
26 May 2011
Approval of Final Draft Budget
Approve the Draft multi-term operational and capital budget
Approve the Draft IDP
COUNCIL
08 June 2011
Advertising
Publication of approved budget. Place on web site Publication of approved IDP. Place on web site
MM CFO
10 June 2011
Submission of Budget
Submit approved budget to National and Provincial Treasury and DPLGTA.
Submit approved IDP to National and Provincial Treasury and DPLGTA
CFO
IDP Manager
23 June 2011
Finalise SDBIP
Finalise service delivery and budget implementation plan(SDBIP) and submit to Council for approval
MAYOR
MM
Table: 11: IDP and Budget Time Schedule
“To make the people of AbaQulusi enjoy the most improved quality of life and community-driven services by 2020”
5. OVERVIEW OF THE MUNICIPALITY’S INTEGRATED DEVELOPMENT PLAN
a. The Vision of the Municipality The Municipality’s long term vision is:
MISSION
b. The 5-Year IDP and Strategic Focus Areas
On 1 July 2007, the AbaQulusi Municipality implemented a new five-year IDP for the period July 2007 to June 2012 to inform and guide the current elected public representatives in their term of office. This document is the fifth and last annual review of the IDP, and outlines the Municipality’s intent in terms of the agreed six strategic focus areas that are required to overcome AbaQulusi’s challenges, achieve its vision, and give effect to its other strategic considerations.
Low economic growth and unemployment
Poor access to basic household services
High levels of poverty
Low levels of literacy and skills development
The issue of HIV / AIDS and other diseases
AbaQulusi Municipality commits to the following:
• Creating an environment conducive to economic development and growth.
• Becoming the focus area for the Zulu-cultural tourism.
• Making AbaQulusi area a safe and vibrant place to live and work in.
• Improved service delivery.
• Good governance.
Exposure to unacceptably high level of crime and risk
Unsustainable development practices
Ineffective, inefficient, inward looking local government LOCAL PRIORITIES
To build a functionally efficient and local government structure
To maintain financial stability and sustainability
To create an integrated and efficient spatial structure
To promote equitable access to infrastructure and basic services
To improve the standard of living for the entire community of AbaQulusi municipality
To facilitate economic development and growth
The draft Integrated Development Plan is attached as Annexure 11.
c. Measurable performance objectives and indicators
The Municipality’s measurable performance objectives, as reflected in Support Table
SA7 of Schedule A of the Municipal Budget and Reporting Regulations, are attached as
Annexure 2.
6. MEASURABLE PERFORMANCE OBJECTIVES AND INDICATORS
Key financial indicators and ratios
Table 12: Performance Indicators (Support Table A8)
KZN263 Abaqulusi - Supporting Table SA8 Performance indicators and benchmarks
Description of financial indicator Basis of calculation
2007/8 2008/9 2009/10 Current Year 2010/11 2011/12 Medium Term Revenue &
Expenditure Framework Audited
Outcome Audited
Outcome Audited
Outcome Original
Budget Adjusted
Budget Full Year
Forecast Pre-audit outcome
Budget Year 2011/12
Budget Year +1 2012/13
Budget Year +2 2013/14
Borrowing Management
Borrowing to Asset Ratio Total Long-Term Borrowing/Total Assets 0.0% 0.0% 0.0% 0.0% 0.0% 0.0% 0.0% 0.0% 0.0% 0.0%
Credit Rating
Capital Charges to Operating
Expenditure Interest & Principal Paid /Operating
Expenditure 0.0% 0.0% 0.0% 0.0% 0.0% 0.0% 0.0% 0.0% 0.0% 0.0%
Borrowed funding of 'own' capital
expenditure Borrowing/Capital expenditure excl.
transfers and grants and contributions 0.0% 0.0% 0.0% 0.0% 0.0% 0.0% 0.0% -3.8% 0.0% 0.0%
Safety of Capital
Debt to Equity Loans, Creditors, Overdraft & Tax
Provision/ Funds & Reserves 0.0% 0.0% -4.6% 23434.8% 50432.8% 139.8% 139.7% 122128.0% 133.5% -17.8%
Gearing Long Term Borrowing/ Funds &
Reserves 0.0% 0.0% 0.0% 0.0% 0.0% 0.0% 0.0% 0.0% 0.0% 0.0%
Liquidity
Current Ratio Current assets/current liabilities – – – 6.6 6.6 12.4 12.4 12.3 15.9 15.9 Current Ratio adjusted for aged debtors Current assets less debtors > 90
days/current liabilities – – – 6.6 6.6 12.4 12.4 12.3 15.9 15.9 Liquidity Ratio Monetary Assets/Current Liabilities – – – 5.1 5.1 2.2 2.2 2.2 2.9 2.9
Revenue Management
Annual Debtors Collection Rate
(Payment Level %) Last 12 Mths Receipts/Last 12 Mths
Billing 2998.5% 0.0% 123.1% 123.1% 123.1% 123.1% 99.7% 70.8% 63.9%
Outstanding Debtors to Revenue Total Outstanding Debtors to Annual
Revenue 0.0% 0.0% 0.0% 2.3% 2.3% 30.3% 30.3% 21.3% 19.8% 20.0%
Longstanding Debtors Recovered Debtors > 12 Mths Recovered/Total
Debtors > 12 Months Old
Creditors Management
KZN263 Abaqulusi - Supporting Table SA8 Performance indicators and benchmarks
Description of financial indicator Basis of calculation
2007/8 2008/9 2009/10 Current Year 2010/11 2011/12 Medium Term Revenue &
Expenditure Framework Audited
Outcome Audited
Outcome Audited
Outcome Original
Budget Adjusted
Budget Full Year
Forecast Pre-audit outcome
Budget Year 2011/12
Budget Year +1 2012/13
Budget Year +2 2013/14 Creditors System Efficiency % of Creditors Paid Within Terms
(within`MFMA' s 65(e))
Funding of Provisions
Provisions not funded - % Unfunded Provns./Total Provisions
Other Indicators
Electricity Distribution Losses (2) % Volume (units purchased and generated less units sold)/units purchased and generated
Water Distribution Losses (2) % Volume (units purchased and own source less units sold)/Total units purchased and own source
Employee costs Employee costs/(Total Revenue - capital
revenue) 804.2% 0.0% 34.1% 35.1% 32.4% 28.4% 28.4% 26.4% 28.4% 30.8%
Remuneration Total remuneration/(Total Revenue -
capital revenue) 0.0% 56.7% 38.3% 38.8% 35.9% 38.9% 29.7% 31.8% 34.4%
Repairs & Maintenance R&M/(Total Revenue excluding capital
revenue) 0.0% 0.0% 0.0% 0.0% 0.0% 0.0% 0.0% 0.0% 0.0%
Finance charges & Depreciation FC&D/(Total Revenue - capital revenue) 30.7% 0.0% 8.3% 0.0% 0.0% 0.0% 0.0% 4.5% 4.4% 4.7%
IDP regulation financial viability
indicators
i. Debt coverage (Total Operating Revenue - Operating
Grants)/Debt service payments due within financial year)
– 27.1 57.9 217.8 217.8 217.8 210.1 294.6 298.7 288.6
ii.O/S Service Debtors to Revenue Total outstanding service debtors/annual
revenue received for services 0.0% 0.0% 0.0% 3.5% 3.6% 45.5% 45.5% 36.9% 36.8% 34.7%
iii. Cost coverage (Available cash + Investments)/monthly
fixed operational expenditure 6.6 5.0 4.0 2.0 2.0 3.9 3.9
(1.1)
(3.7) (7.7)
7. OVERVIEW OF BUDGET-RELATED POLICIES
Revenue Framework
Section 18 of the MFMA states that the budget can only be funded by realistically anticipated revenue to be collected, as well as cash backed accumulated funds from previous years and not committed for other purposes.
In addition, NT Circular 42 stipulates that the budget is to be managed in a full accrual manner, reflecting a transparent budget and accounting system approach.
The MFMA requires the municipality to adopt and implement a tariff policy. Council has approved such policies for all major tariff-funded services provided by the municipality, which are attached as annexures to this document.
Council is required to adopt budgetary provisions based on realistic anticipated revenue for the budget year from each revenue source, as per the requirements of the MFMA (Chapter 4, S17 (1) (a) & (3) (b)).
1. Revenue related policies General Tariff Policy
The Municipal System Act requires Council to adopt a Tariff Policy. The general financial management functions covered in section 62 of the MFMA include the implementation of a tariff policy. Specific legislation applicable to each service has been taken into consideration when determining this policy. The General Tariff Policy is attached as Annexure 8.
Credit Control and Debt Collection Policy
This Policy has been formulated in terms of section 96 (b) and 98 of the Local Government: Municipal Systems Act, 2000 and the Credit Control and Debt Collection By-Law. The Policy also includes the Indigent Policy as per Annexure 9.
2. Budget related policies Approved policies
The following budget related policies have been approved by Council and is available on the Municipality’s website.
Supply Chain Management Policy
Cash Management and Investment Policy
Asset Management Policy
Virement Policy – approved
Reviewed/Amended policies
The following budget related policies are currently being reviewed/amended in line with National Guidelines and legislation.
Property Rates Policy
Minor amendments to the approved policy are to be considered in March 2011 and the
amended policy is attached as Annexure 16.
8. OVERVIEW OF BUDGET ASSUMPTIONS
Environment in which the 2011/12 Budget was prepared
The MTREF/budget is susceptible to the economic climate and it is therefore vital that the projected economic condition is properly considered during the budget preparation process.
The 2011/2012 MTREF was drafted in context of a reviving economy. Negative impacts of the multi-year recession are however still experienced and reported by both the private and public sectors.
Figure 3: Key economic trends – 2004 to 2015 (Sourced from BER)
In the midst of the recession, GDP was at a deficit of 1.8%; the inflation rate at 11.85%; the R/$
exchange rate averaged at R8.50 and interest rate levels averaged at around 13.5%.
The preparation of the 2011/2012 MTREF first draft produced much improved projections; for example - GDP at 3.55%; inflation rate of 5.35%, R/$ exchange of R7.76 and average interest rates of 10%.
Budgetary constraints and economic challenges meant that the Municipality had to apply a combination of cost-saving interventions and higher than headline CPI revenue increases to ensure an affordable, credible and sustainable budget over the 2011/2012 MTREF.
The draft budget for the 2011/2012 MTREF period, resulted from the realisation that no, or limited, scope for additional externally- or internally-funded revenue growth existed and the challenge that more needed to be done with the existing resource envelope. This was reiterated in National Treasury Budget Circular 54 as well as a National Treasury presentation to municipalities in August 2010.
The challenges that faced the Municipality in preparing the 2011/2012 MTREF included:
In attempting to reduce the high Rates revenue parameter, several interventions to multiyear targets of both revenue and expenditure across services were required, while simultaneously retaining the strategic links to and focus on the draft IDP.
Substantial, once-off revenue which cover semi-permanent expenditure obligations;
Persistent staff costs increases over the medium term beyond CPI levels (with inflation linked Revenue increases in corresponding periods).
Declining equitable share and year-on-year growth.
The interventions applied to eradicate the above challenges included, amongst others:
Budget reduction targets set to all services in accordance with its portion of vacancies
which existed for more than 12 months.
Financial modelling
The AbaQulusi Municipality MTREF model is annually reviewed to determine the most affordable level at which the municipality will be able to operate optimally. In addition, sustainability forms the basis of the preparation of the Operating and Capital Budgets. It sets out the economic context and assumptions that inform the compilation of the next three years’
budget.
The principles applied to the MTREF in determining the affordability envelope were:
Higher than headline CPI revenue increases, to the extent that they affect and support Council’s operational activities of relevant services;
Assumption of a 100% capital expenditure implementation rate based on current spending patterns;
Credible collection rates, based on collection achievements to date, incorporating improved success anticipated on selected revenue items; and
Higher than nationally projected inflation provisions for repairs and maintenance, to attain nationally benchmarked levels on this expenditure item, and ensure/enhance the preservation of the Municipality’s infrastructure.
Key Financial Indicators in the 2011/2012 MTREF Budget Headline Consumer Price Index (CPI) – Inflation Outlook
Headline CPI applied in the 2011/2012 MTREF is 5.0%, 5.9% and 5.9% respectively for the 3- year period. This differs somewhat from the CPI forecasts of 5.6%, 5.5% and 5.4% for the same period. The levels are within the NT and SARB CPI projections (3% to 6% range).
Budgetary allocations within the current financial year (2010/2011) were largely based on a CPI level of 5%. The MTREF outer years is proposed to remain at 5.9% and 5.9% respectively.
EXPENDITURE FRAMEWORK
Salaries, wages and related staff costs
The municipality’s salary increases applied to the staff budget were as follows:
BASE BUDGET 2010/2011
%
2011/2012
%
2012/2013
%
2013/2014
%
Salaries 6.5 5 5.5 5.5
Add: Increments 2 2 2 2
Table 13: Parameters applied to Staff Budget
The promulgation of the Salary and Wage Collective Agreement by the South African Local Government Bargaining Council (SALGBC) provided the general salary adjustment guidelines for the period 2009/2010 to 2011/2012.
The 2011/2012 financial year represents the 3rd year of the SALGA salary and wage agreement, which provides for an across the board increase based on the average CPI (February 2010 to January 2011) + 2%, for calculating staff costs increases for the 2011/2012 financial year. The projected staff CPI is 4.6%, however a provision of 5% was made for 2011/2012 due to the agreement stating that “should the average CPI be lower than 5% or higher than 10% for the period…..any party may be entitled to re-open the negotiations”, thereby indicating that a lower than 5% salary CPI might not be accepted
In the absence of an agreement going forward, the 2011/2012 increase formula was used to project for the two outer years. A further increment allowance of 2% was provided to cover performance- and other notch increases.
Salary increases are consistently higher than CPI. The increase in the salary budget was a contributing factor to the cost pressures experienced on the operating budget
General expenses
The general expenses base was increased from R 142 million to R 175 million due to the increase in Bulk electricity of R 34 million. Therefore the growth in general expenses has been severely limited.
Repairs and Maintenance
The National Treasury Municipal Budget Circular 54 for the 2011/2012 MTREF stated that
“municipalities must “secure the health of their asset base (especially the municipality’s revenue generating assets) by increasing spending on repairs and maintenance”. The Municipality has, over the last three financial years, consistently increased the investment in repairs and maintenance by above CPI.
Due to the high increase in bulk electricity the impact has been felt on the repairs and maintenance budget.
REVENUE FRAMEWORK Service growth
The current unstable economic climate has restricted any material service growth. The
provision for growth for Electricity for the 2011/2012 financial year is now limited to the areas
which have not yet been provided with electricity. Within the AbaQulusi licence area the
municipality has almost reached universal access. AbaQulusi are now assisting Eskom with the
provision of electricity to Eskom Licence areas, in order that all the community of AbaQulusi has
electricity.
Revenue growth parameters: Rates and trading services
The following revenue parameter increases were applied to the 2011/12 MTREF which informs the tariff increases reflected in the Total Municipal Account (TMA):
Revenue growth parameters: Rates and trading services
Ensuring an affordable and sustainable budget necessitated a higher than CPI year-on-year revenue growth to be applied to the Rates and Trading services.
The following revenue parameter increases were applied to the 2011/12 MTREF which informs the tariff increases reflected in the Total Municipal Account (TMA):
Rates: With the backdrop of the current economic climate and other cost pressures negatively impacting on the budget, the rates revenue increase was 6%. This above CPI increase is required to achieve an affordable and balanced rates budget without impeding on service delivery.
Electricity: Electricity tariffs are linked to the ESKOM tariffs for bulk purchases of electricity, which is proposed by NERSA to be 26.71% for the 2011/12 financial year. In terms of NERSA’s Guideline on municipal electricity tariff increases dated November 2010, municipalities should not exceed a tariff of 20.38% to their consumers:
Water & Sanitation: The revenue parameter adjustment for both water and sanitation is 6% for 2011/2012 financial year. It must be noted that the Natal Spa Agreement comes to an end in June 2011.
Refuse Removal: This revenue parameter increase was modelled at 6%, which is within the ambit of the BER’s CPI projection for 2011/2012.
The revenue parameters applied will generate the following revenue parameters:
REVENUE CATEGORY
ADJUSTMENT BUDGET 2010/2011
R’000
ORGANIC GROWTH PARAMETERS
AVERAGE TARIFF INCREASE
2011/2012 BUDGETED
REVENUE R’000
Rates 32,200,000 1.7% 6% 34,671,020
Refuse 13,530,500 0% 6% 14,255,230
Electricity 110,693,630 0% 20.38% 130,542,970
Water 20,932,000 0.65% 6% 22,324,360
Sanitation 15,945,400 17.79% 6% 19,739,190
Table 14: Proposed Revenue based on parameter increase
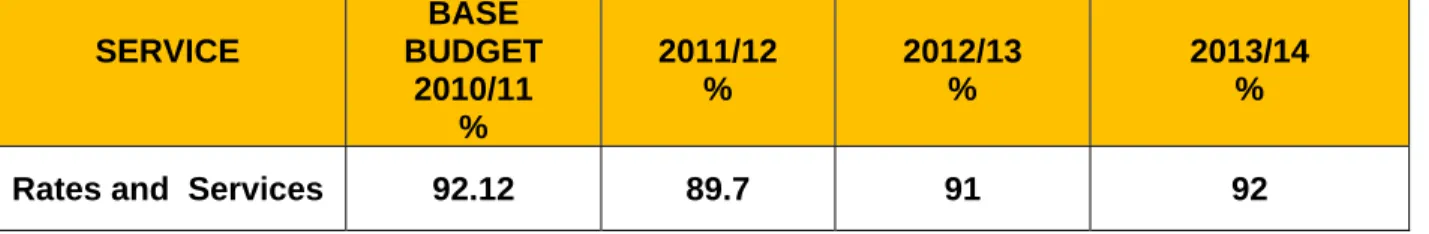
The high increase in organic growth parameter for Sanitation is the 61% increase in free service Collection rate
In accordance with relevant legislation and national directives, the Municipality’s projected revenue recovery rates are based on realistic and sustainable trends. In calculating the working capital reserve the following collection ratios were applied as per the table below.
SERVICE
BASE BUDGET
2010/11
%
2011/12
%
2012/13
%
2013/14
%
Rates and Services 92.12 89.7 91 92
Table 15: Projected collection rates
The total collection rate for 2011/2012 averages 89.7% and is based on a combination of actual collection rates achieved to date and the estimated outcomes for the current financial period.
The projections for the outer years remained stable.
NATIONAL GRANTS Equitable Share
The Constitution provides that each sphere of government is entitled to an equitable share of revenue raised nationally to enable it to provide basic services and perform the functions allocated to it. The equitable division of revenue takes into account the functions assigned to each sphere under the Constitution and the capacity of each government to pay for these functions through own receipts and revenues.
The local government equitable share allocations supplement municipalities’ own revenue sources for the provision of basic services to poor households within their areas of jurisdiction.
The equitable share per municipality is calculated using the following equation:
Grant = BS + D + I – R ± C Where
BS is the basic services component
D is the development component
I is the institutional support component
R is the revenue raising capacity correction
C is a correction and stabilisation factor
Table 16: Equitable Share equation
Initiatives are currently being pursued to assess the application of the equation for the AbaQulusi Municipality to ensure that the allocation received by AbaQulusi is equitable and fair.
The annual Division of Revenue Act (DORA) publishes the equitable share allocations. The following indicative allocations, as published in the 2010/2011 DORA, were provided as follows:
2011/2012 – R 69.2 million
2012/2013 – R 76.5 million
2012/2013 – R 81.5 million (Forecasted based on year on year average growth) Interest rates
Average interest rates over the 2011/2012 MTREF period Interest on investments - 5.55%, 5.91% and 6.34%.
Depreciation
Depreciation was calculated on a straight line method based on the lifespan of the asset class
and capitalisation date. For multi-year projects it was assumed that capitalisation will only take
place when the project is completed and depreciation will take effect then.
9. OVERVIEW OF BUDGET FUNDING
1. 2010/2011 and 2011/2012 to 2013/2014 projected financial performance 1.1. Operating Budget
The Operating budget increases from R 261 million in 2010/2011 to R 363 million in 2011/2012.
The growth is mainly attributable to:
Cost of Bulk Purchases (Water and Electricity)
Employee related costs due to the financial impact of the Wage Curve Collective Agreement and the Salary/Wage increase above CPI levels
The GRAP requirement to include Capital grants in the operating budget
1.2. Capital Budget
The capital budget increases from R 39 million in 2010/2011 to R 48 million in 2011/2012.
The overall growth of 23% can be attributed to various factors, such as:
The significant additional external funding allocations to Housing, Roads & Electricity Projects votes
Funding for the Thusong Centre
Major increases can therefore mainly be attributed to the following:
Increase of approximately R3 million for Roads
Increase in allocation for electrification
Addition of Thusong Centre
2. Medium Term Outlook: 2011/2012 to 2013/2014 Operating Budget
The table below reflects the increase in the operating budget in the medium term:
2011/2012 R
2012/2013 R
2013/2014 R
Operating Budget 363,009,830 391,797,150 387,719,800
Table 17: Medium Term Operating Budget
Capital Budget
The table below reflects the capital budget and its funding sources in the medium term:
2011/2012 R
2012/2013 R
2013/2014 R
Capital Budget 48,605,000 55,504,000 44,906,000
Funding Source:
MIG 20,975,000 25,504,000 26,906,000
DOE 13,773,000 20,000,000 8,000,000
Human Settlement 10,000,000 10,000,000 10,000,000
COGTA 3,500,000 0 0
Other Revenue 357,000 0 0
Table 18: Medium Term Capital Budget and Funding Sources
The funding sources listed below are appropriated towards the following major projects on the capital budget:
National Grant Funded
Rural Roads and Bridges
Municipal Infrastructure projects to improve bulk infrastructure
eMondlo Roads
Electrification of Houses
Provincial Grant Funded
Integrated Human settlement (Housing) projects and informal settlement upgrades
Upgrading of Hostels
Thusong Centre 3. Sources of Funding
Rates, tariffs and other charges Property Tax Rates
The proposed property rates are to be levied in accordance with existing Council policies, the Local Government Municipal Property Rates Act 2004 (MPRA) and the Local Government Municipal Finance Management Act 2003.
The proposed average rates increase is 6% for all categories of Properties.
Property tax rates are based on values indicated in the General Valuation Roll 2009
(GV).
The Roll is updated for properties affected by land sub-divisions, alterations to buildings, demolitions and new buildings (improvements) through Supplemental Valuation Rolls. All values are as at the date of the GV, being 1 July 2009.
Rebates and concessions are granted to certain categories of property usage and/or property owner.
The definitions and listing of categories are reflected in the Rates Policy attached as Annexure 7.
Water and Sanitation
The proposed Water and Sanitation Tariffs for 2011/2012 are consistent with National Policy on the provision of free basic services, the National Strategic Framework for Water and Sanitation and with Council’s Indigent relief measures, Rates and Tariff Policies and Equitable Service Framework.
The progressive nature of the existing domestic stepped tariff structure both for water and sanitation is pro-poor and allows for the needs of the indigent. It is also designed to discourage high water consumption levels, which have an impact on the size of both the water and sanitation portions of a consumer’s bill. It enables all consumers to adjust their consumption levels to ensure affordability.
There is a proposed 6% increase in volumetric water and sanitation tariffs. The Bulk Water tariff has been increased by 6%.
There is a proposed 6% increase on miscellaneous tariffs.
The proposed consumption based as well as miscellaneous tariffs are shown in the attached Tariffs and Charges Book.
Changes in the tariff policy and tariff schedules for the 2011/2012 financial year are reflected in Annexure 4.
Electricity
The proposed revisions to the tariffs have been formulated in accordance with the AbaQulusi Municipality Tariff and Rates Policy and comply with Section 74 of the Municipal Systems Act as well as the recommendations of the National Energy Regulator of South Africa (NERSA).
In terms of section 75A of the Local Government Municipal Systems Act, any fees, charges or tariffs which a municipality may wish to levy and recover in respect of any function or service of the municipality, must be approved by a resolution passed by the municipal Council with a supporting vote of a majority of its members.
The Electricity Regulation Act requires that proposed revisions to the electricity consumption
based tariffs be submitted to the Regulator for approval prior to implementation. Provisional
approval will therefore be requested with the express proviso that any alterations required by
Council will be submitted to the Regulator as soon as possible.
Domestic consumers supplied directly by the Municipality and charged at the Lifeline Tariff and receiving less than 150 kWh per month on average will continue to receive the free basic supply of 50 kWh per month (included in the 450kWh per month). Note that national guidelines allow for the provision of the free basic supply of 50 kWh per month to be made available to consumers using less than 150 kWh per month. Customers supplied by Eskom and receiving less than 150kWh per month on average will continue to receive a free basic supply of 50kWh per month (again, included in the 150kWh per month).
Guidelines for the municipal electricity tariff increase in July were issued by NERSA as being 20.38%. However, the bulk purchases by the City are expected to rise by 26.71%. This increase, together with increases in expenditure on Salaries and Wages, Repairs and Maintenance, contributions to the Rates Account require the electricity tariffs to increase by an average of 20.38%.
In an effort to bring the pre-paid electricity tariff into line with the conventional meter tariff, it is proposed that there be NO increase in this tariff until they are aligned. This is in an effort to encourage more consumers to convert to the pre-paid system.
The consumptive tariff details are reflected in Annexure 4.
Solid Waste Management
The Solid Waste Tariffs are levied to recover costs of services provided directly to customers and include collection fees, disposal fees, compost sales, clearance of illegal dumping on private properties, weighbridge fees and other ad hoc services. It is proposed that the Tariffs increase (within CPI) by 6%.
The New/Changed Tariffs and amendments to the existing Tariff Policy are reflected in Annexure 5.
Tariffs and Charges Book
Council is permitted to levy rates, tariffs, fees and charges in accordance with the Local Government Municipal Property Rates Act, the Local Government: Municipal Systems Act, Act 32 of 2000, Section 75A and the Municipal Finance Management Act, No. 56 of 2003, 17(a)(ii).
The Tariffs and Charges Book is attached as Annexure 4 and contains all levies, rates and service charges determined for all functions or services performed by the municipality for which a charge is made.
An average growth parameter of 6% was applied to all the miscellaneous tariffs.
All Levies, Rates and Service Charges are determined in compliance with:
Local Government Municipal Property Rates Act 2004
Municipal Finance Management Act 56 of 2003
Local Government Municipal Systems Act 32 of 2000
4. Investments
Monetary investments by type
Table 19: Monetary investments by type (Support Table A15) Monetary investments by maturity date
KZN263 Abaqulusi - Supporting Table SA15 Investment particulars by Type
Investment type
Ref
2007/8 2008/9 2009/10 Current Year 2010/11 2011/12 Medium Term Revenue &
Expenditure Framework Audited
Outcome Audited
Outcome Audited
Outcome Original
Budget Adjusted
Budget Full Year
Forecast
Budget Year 2011/12
Budget Year
+1 2012/13 Budget Year +2 2013/14
R thousand
Parent municipality
Securities - National Government
Listed Corporate Bonds
Deposits - Bank 44,706 44,706 44,706 55,518
Deposits - Public Investment Commissioners
Deposits - Corporation for Public Deposits
Bankers Acceptance Certificates
Negotiable Certificates of Deposit - Banks
Guaranteed Endowment Policies (sinking)
Repurchase Agreements - Banks
Municipal Bonds
Municipality sub-total 1 – – 44,706 44,706 44,706 55,518 – – –
Entities
Securities - National Government
Listed Corporate Bonds
Deposits - Bank
Deposits - Public Investment Commissioners
Deposits - Corporation for Public Deposits
Bankers Acceptance Certificates
Negotiable Certificates of Deposit - Banks
Guaranteed Endowment Policies (sinking)
Repurchase Agreements - Banks
Entities sub-total – – – – – – – – –
Consolidated total: – – 44,706 44,706 44,706 55,518 – – –
KZN263 Abaqulusi - Supporting Table SA16 Investment particulars by maturity
Investments by Maturity Ref Period of
Investment Type of Investment Expiry date of investment
Monetary value Interest to be realised
Name of institution & investment ID 1 Yrs/Months Rand thousand
Parent municipality
ABSA (Notice Deposit) 60 Day Notice 882
ABSA (Guarantee ESKOM) Spiral Plan 1,490
ABSA (Call) Call Account 765
ABSA (Call) Call Account 12,576
ABSA (Call) Call Account 648
ABSA (Call) Call Account 1,910
SIMS Call Account 37,248
Municipality sub-total 55,519 –
Entities
Entities sub-total – –
TOTAL INVESTMENTS AND INTEREST 1 55,519 –
Table 20: Monetary investments by maturity date (Support Table A16) 5. Long – Term investments and loans
No new borrowings are proposed for the MTEF budget period 6. Grant Allocations
National Allocations
The table below reflects the grant allocations in terms of the 2010 Division of Revenue Act (No.33959 of 24 January 2011) that have been included in this medium term budget:
Table 21: National Allocations
2011/2012 2012/2013 2013/20104
NATIONAL GRANTS R R R
FINANCIAL MANAGEMENT GRANT 1,450,000 1,500,000 1,750,000 NATIONAL ELECTRIFICATION PROGRAMME 13,773,000 20,000,000 8,000,000
EQUITABLE SHARE 69,224,000 76,515,000 81,515,000
MUNICIPAL SYSTEMS IMPROVEMENT 1,000,000 1,000,000 900,000 MUNICIPAL INFRASTRUCTURE GRANT(MIG) 20,975,000 25,504,000 26,906,000
EXPANDED PUBLIC WORKS PROGRAMME 357,000
0 0TOTAL 106,779,000 124,519,000 119,071,000
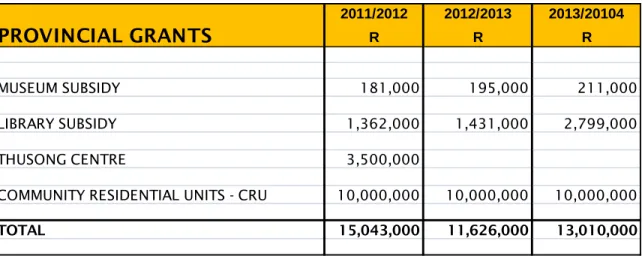
Provincial Allocations
The table below reflects the grants allocated in terms of the Provincial Gazette 6703 ( 27 dated 04 March 2011) that have been included in this medium term budget:
Table 22: Provincial Allocations
2011/2012 2012/2013 2013/20104
PROVINCIAL GRANTS R R R
MUSEUM SUBSIDY 181,000 195,000 211,000
LIBRARY SUBSIDY 1,362,000 1,431,000 2,799,000
THUSONG CENTRE 3,500,000
COMMUNITY RESIDENTIAL UNITS - CRU 10,000,000 10,000,000 10,000,000
TOTAL 15,043,000 11,626,000 13,010,000
10. EXPENDITURE ON ALLOCATIONS AND GRANT PROGRAMMES
Table 23: Expenditure on allocations and grant programmes (Support Table A19)
Description Ref 2007/8 2008/9 2009/10 Current Year 2010/11 2011/12 Medium Term Revenue &
Expenditure Framework
R thousand Audited
Outcome Audited
Outcome Audited
Outcome Original
Budget Adjusted
Budget Full Year Forecast
Budget Year 2011/12
Budget Year +1 2012/13
Budget Year +2 2013/14
EXPENDITURE: 1
Operating expenditure of Transfers
and Grants
National Government: – – – 2,200 2,200 2,200 2,450 2,500 2,650
Equitable share
–
–
–
–
–
–
–
–
–
Finance Management – – – 1,200 1,200 1,200 1,450 1,500 1,750
Municipal Systems Improvement
–
–
–
1,000
1,000
1,000
1,000
1,000
900
–
–
–
–
–
–
–
–
Other transfers/grants [insert –
description]
–
–
–
–
–
–
–
–
–
Provincial Government:
–
–
–
791
1,741
1,741
1,362
1,431
2,799
Health subsidy
–
–
–
611
541
541
–
–
–
–
–
–
–
–
–
–
–
–
Library
–
–
–
180
1,200
1,200
1,362
1,431
2,799
District Municipality:
–
–
80
100
100
80
80
100
100
Tourism Grant
–
–
80
100
100
80
80
100
100
–
–
–
–
–
–
–
–
–
Other grant providers:
–
–
–
73
73
73
181
195
211
Museum
–
–
–
73
73
73
181
195
211
–
–
–
–
–
–
–
–
– Total operating expenditure of
Transfers and Grants:
–
–
80
3,164
4,114
4,094
4,073
4,226
5,760
Capital expenditure of Transfers and
Grants
National Government:
–
–
–
25,440
27,440
27,440
35,105
45,504
34,906
Municipal Infrastructure